Mathematica Eterna
Open Access
ISSN: 1314-3344
ISSN: 1314-3344
Research Article - (2023)Volume 13, Issue 4
Digital companies have become an important provider of items, products, and services and they are increasingly replacing traditional markets. The growth of this business has created a heated competition among digital companies to extend their customer base and increase revenue. For this purpose, digital companies are now aware of the importance of gaining new customers and more importantly, maintaining existing customers as acquiring new customers is more expensive than retaining existing customers. That is why e-companies do their best to build strong bonds with their customers and support all efforts to predict possible churners and take proactive actions towards potential churners.
In this paper we will build a framework based on time-series Markov model that performs both potential churn customers prediction and predicts visitors who tend to exit from the e-company without making purchases. Markov model is a statistical model able to observe states in temporal patterns of data. Proposed model will be implemented on public dataset called “RecSys2015” and we will compare its results with other algorithms for benchmarking.
Customer churn prediction; Visitor exit prediction; Markov model; Markov chain
The world has been witnessing increasing shift to digital marketing, and digital marketing companies, providing e-commerce services, compete to maximize the base of customers they have. Building a base of customers helps e-commerce companies to increase their revenues, expand and add new products and items, and provide better services to their customers. But convincing customers to buy from the company and building a relation with customers is not an easy process, especially that the cost to attract new customers to buy from the e-company is high because of the need for educating, advertising, creating new accounts and requires huge efforts from digital marketing companies [1]. On the other hand, the cost of retaining customers to continue buying products and services is far less and some research estimate it five times less [2]. Taking this fact into consideration raises the crucial need for predicting customers that show tendency to exit the business and discovering factors that lead customers to churn by using Artificial Intelligence (AI) and Machine Learning (ML) techniques [3].
Many research papers in the literature addressed customer churn prediction and its importance in increasing revenue and customer retention rates using ML. For example, Support Vector Machine (SVM), Neural Networks (NN), random forest were implemented to predict customer churn without taking time attributes into consideration [4-7]. Another paper addressed same issue but with considering time to predict churn based on a hybrid model of multiple classification techniques [8]. Other papers approached methods to target customers who do window shopping without making purchases so that they can convince them to place orders, for instance, they proposed a model based on the number of visits to the e-company [9-11]. Wang et al. proposed a model to predict customers that need to be targeted based on the type of purchase made in the past [12]. Yeo et al. built a frame that combines the product purchased in the past, number of visits, and duration of visits [13].
In this paper we propose a framework to predict customer churn based on the history of product purchased, the time a customer spent browsing products, the customers who make no purchases and may exit the e-commerce company, and the amount of money customers spent on previous purchases. This model will be built with markov model and will be compared against other ML algorithms like SVM.
The paper is structured as follows. In Related work, we will discuss related work in the literature. Gap analysis and problem statement introduces problem definition, gap analysis and the contribution of proposed work. In propose solution, we will describe the methodology for the proposed model and different approaches followed to build the framework. In evaluation, complexity analysis and evaluation of the proposed model is introduced, in addition to the benchmark with different algorithms to confirm the findings. Finally, we will discuss the results and future work to enhance the proposed model
Related work
Prediction of customer churn has been given special consideration in the literature due to its positive impact on increasing digital companies revenue and improving customer satisfaction as it allows companies to take proactive actions to maintain their customers whose behaviors might show tendency to leave the business. In other scenarios, we may utilize powerful ML techniques to predict the status of web site visitors who have not made purchases before and deal with them as potential customers requiring a special approach to convince them to buy from the company.
Different papers addressed customer churn prediction to classify the customers as churning and non-churning. Coussement et al. proposed an SVM-based model to predict churning customers of a newspaper subscription and found that SVM outperformed a model based on logistic regression [4].
Castanedo et al. proposed a four-layered feed forward NN model to predict churn in a telecommunication company and they found that using NN gave better results than random forest-based model [5]. Spanoudes et al. exploited deep learning to predict churn in any subscription-based company by using abstract feature vector [6]. Papers predicted customer churn based on studying customer behaviors irrelevant of time attributes that has important role in prediction as shown in Table 1 [4-6].
Moeyersoms et al. focused on the importance of data preparation on getting better churn prediction and how it impacts prediction results, but their work was mainly on categorical and small scale of variables [16].
Mozer et al. did not carry out data preparation before prediction and included all attributes of the dataset including uncorrelated variables in their prediction causing inaccurate results [17].
Other papers studied mainly customer “clicks” activities during browsing the website. Prediction of customer churn was based on the number of visits to the different products and items offered in the website as per their time and date of visits [9-11]. Their prediction did not include the historical purchases events that contribute in generating better prediction.
On the contrast, predicted customer behaviour based on the purchases made by customers and did not consider browsing and visits activities [12]. Valero-Fernandez et al. studied customer behaviours to decide on the customers that should be targeted by marketing campaigns, but the paper studied only the accuracy of their models and did not include other metrics in the evaluation [18].
We are inspired by paper where the authors used a public dataset “recsys2015” simulated over datasets from the market to imitate customer performance that includes visits and purchases as customer as recsys2015 dataset includes information about sessions not customers [13]. They simulated the public dataset with other datasets to bin the sessions of RecSys2015 in customer-based scenario. The authors built a framework that included:
• The type of purchase that may lead to new purchase (Need Recognition),
• The number of visits/clicks in the e-commerce website.
• The time spent by visitors/customers browsing the website.
To summarize the main disadvantages of related work in providing a complete picture during the evaluation of the proposed models and framework, we can say that one of the cons is disregarding activities sequencing over time and its importance in creating strong models to predict customer behaviour because logically our decisions as humans are made based on sequences of related activities over time that build up to create an indicator to what people will do in the future. In other words, the quantitative measures of activities are important, but the order of the activities has more impact on predicting future activities.
The other problem found in the related work discussed in Table 1 is the insufficient metrics used to evaluate and benchmark the proposed models. Many papers focus on improving specific metric and highlighting the impact of this metric without shedding the light on other factors that must be considered when assessing the proposed model to accurately evaluate the work.
| Ref | Topic | Strengths | Weaknesses |
|---|---|---|---|
| [4] | SVM-based model to predict customer churn | Better accuracy compared with other models on same dataset | Time attributes not considered in this work |
| [5] | NN based multi-layer framework for churn prediction | NN reward-based model outperformed ML techniques | Although the accuracy of the model is better, but results cannot be used with trust as they do not consider time sequence of customer events |
| [6] | Deep learning model to predict customer behaviour | Deep NN (DNN) framework showed noticeable decreasing trend of errors when learning more data and much better accuracy than other models | The consequences of customer behavior not considered du to not relying on activities and events timing. |
| [9-11] | NN-based model to predict customer behaviour (customer conversion rate) | Considered number of visits to browse items and products as a key indicator to predict customer behavior to encourage visitors to buy and customers to make new purchases | Although number of visits is an important indicator that contributes in customer behavior prediction, but there are other factors that need to be considered |
| [12] | Opportunity model to predict user behavior | Joint probability model that suggests and predicts an item to the customer for new purchase after a specific time of previous purchase | The model only takes the time of previous purchase as indicator for possible future purchases |
| [13] | Predictability Aware Aggregation (PAA) model to predict customer behavior | The proposed PAA model takes into consideration previous purchases, users and customers visits to the website, and the duration spent by users and customers while browsing | The simulation of the public dataset over other private datasets to imitate customer behavior by binning multiple session under one simulated customer is not clear. |
| [14] | Binary-classification prediction model based on GBDT classifier to predict customer purchase behaviour | From accuracy point of view, the model works fine | Only accuracy was provided not any other metrics, no complexity analysis was provided, and the proposed model was not benchmarked using other algorithms. |
| [15] | XGBOOST-based classifier model to predict if e-commerce customer is going to make future purchase or not | Details on performance metrics were added to reflect the performance of imbalanced dataset without carrying out any kind of data balancing | The proposed model was not compared with other algorithms to confirm performance. Moreover, F1 measure was low, and no complexity analysis was provided |
| [17] | NN model to predict churners in telecom company | The AUC value of proposed NN model outperformed other models on same dataset | No time information was considered and other metrics than accuracy was not provided to confirm model effectiveness. Moreover, the data modeled without balancing. |
| [18] | Multi-ML techniques to predict customer churn | The dataset was processed by multiple ML techniques for customer churn prediction | Time information was not considered in this study, no data balancing was carried out |
Table 1: Related work (strengths vs weaknesses).
The last thing is the factors utilized to build the model, as we found in many cases that the authors are counting on important factors to build their models but actually these factors are not enough to create a framework that can be used in customer behaviour prediction. For example papers proposed different factors to be combined in their proposed models, but they have not included some other factors that certainly have important contribution in customer behaviour prediction [9-13].
Gap analysis and problem statement
As discussed in related work, most papers in the literature studied customer behaviour prediction using different techniques and models. Many of them study the data without including the time and chronology of events and activities of the customer.
Other papers proposed models that takes time sequence of events but without covering as many aspects of user activities as it should be, to come out with more reliable prediction that really imitate the tendency of customers in order to target right customers with appropriate offers to avoid customer churn, improve customer satisfaction, reduce unnecessary costs and, thus, increase digital companies revenue.
In this work, we are inspired by that built a framework that considers time as major factor in predicting customer conversion probability under the following conditions 1) browsing data, 2) browsing duration, and 3) conversion ratio [13]. They built a framework that combines the three factors in one model, making the results of the predictions more concrete and they showed improvement of accuracy for low customer conversion predictability. Yeo et al. considered the conversion probability of visited products toward a purchase, but there are some points in their work that need to be discussed [13]:
• The authors did not include some important factors in their work (ie. Item price, amount of purchases, recency)
• As described in Table 1, the authors used private datasets to simulate customer events without providing further details on the source of these datasets and the methodology they followed for simulation purpose
• The paper showed increasing errors with time using the proposed framework.
Problem statement: This paper will use the public dataset RecSys2015 without binning or simulating the customers, because the intention of this paper is to provide new proposal based on a public dataset that is accessible to everyone and can be tested without modification or change.
In this paper we are going to utilize all attributes in the datasets to build a framework that will include the following Factors (F) that represent the score or impact of each item in the dataset on the form of a sequence of transactions leading to a future purchase, exit, or churn:
• Browsing Ratio score (BR) of an item in the sequence of items for each customer (session) : F1
• Browsing Duration score (BD) of an item in the sequence of items for each customer (session) : F2
• Purchase ratio:
• Purchase value score of an item in the sequence of items for each customer (session) : F3
• Number of purchases score of an item in the sequence of items for each customer (session) : F4
• Recency of purchases score that represents the last time an item was purchased for each customer (session) : F5
• Frequency of purchases score that represents the frequency of a purchased item for each customer (session) : F6 as shown in Figure 1.

Figure 1: High level model presentation based on given factors.
In this paper, we are focusing on predicting churn and exit. Figure 2 shows high-level presentation of the model and the predictions required.

Figure 2: Proposed model.
As per Figures 1 and 2, the framework aims to generate two types of predictions:
• Exit prediction : When the data set records one or more visits to a website by a visitor without making any purchase from the website.
• Churn prediction: When the data set records a customer (with at least one purchase in the past) to churn.
To the best of our knowledge, this is the first paper that addresses the problems of customer churn and the analysis of customers and visitors events taking into consideration all the factors discussed above as they all have an impact on predicting the customer behaviour.
Contribution of proposed model: In related work we highlighted the disadvantages that related works in the literature have when handling the problem of customer behaviour prediction. In this proposed model, our goal is to produce a better and more accurate prediction by addressing all the issues found in related papers through covering the following points:
• In this model, we make sure that we include all metrics that help evaluate and assess the performance of the proposed work. We will calculate all the measures needed to assess the contribution of this work in improving the prediction of customer behaviour. We will measure the accuracy, but we will also have recall, precision, and F1_measure. We will also evaluate how the model can distinguish between all classes (majority and minority) so that we confirm the functionality of this model from all sides and we do not exclude any factor that may have impact on the accurate evaluation of the model. This comprehensive evaluation is missing in many papers in the literature as the effort was put in to highlight the strength of proposed model from specific point of view that does not reflect the overall performance of the proposed model.
• This model takes into consideration the sequential order of activities as a factor that has an impact on the decisions that will be made by customers in the future. This will certainly improve the quality of the prediction because we cannot separate the impact of time and order of activities exhibited by customer from the events or decisions the customer will make and that will help in the prediction. In many papers in the literature, the authors tend to evaluate the results of the activities made by customer (i.e. purchase, no purchase, more spending, less spending..etc) and disregard the activities and their time order that have an impact on the action taken by the customer.
• Some papers in the literature included sequential factors that may lead to improve prediction, but they failed to consider all major factors that have impact on the prediction, such as studying the impact of time spent in the website, the number of items visited, or the history of purchased items, but we found no paper that takes in consideration all these factors together in addition to other important factors (i.e. spending amount over time, frequency of visiting and purchases, recency of visiting and purchases). In our proposed model we include all factors that would contribute in producing better prediction as per problem statement where we include six factors that will together improve the quality of predicted events of the customer.
Propose solution
Dataset description: there are two sets of data:
Yoochoose-clicks: Click activities of customers and visitors with more than 33 million rows. It includes the following attributes: Session, timestamp, item and category
Yoochoose-buys: Purchases activities of customers with more than 5 hundred thousand rows. It includes the following attributes: Session, timestamp, item, category, count of purchased items and price of item as shown in Tables 2 and 3.
| Information | Session | Timestamp | Item | Price | Count | Category |
|---|---|---|---|---|---|---|
| Dataset | ||||||
| Buy | × | × | × | × | × | |
| Clicks | × | × | × | × |
Table 2: Shows the attributes included in each dataset.
| # of sessions | # of clicks | # of purchase transactions | # of items |
|---|---|---|---|
| 9249729 | 33003944 | 1150753 | 52739 |
Note: #Many items in the dataset have not been purchased at all (items only visited)
Table 3: Includes general information in both datasets.
Statistics description: Based on the information from the dataset
details in propose solution which contains customers and visitors
events over 6 months (4![]() 9), we can see that the trends of customer
activities is moving in descending direction, raising the need for effective prediction of users and customers behavior as shown in Figures 3a and 3b.
9), we can see that the trends of customer
activities is moving in descending direction, raising the need for effective prediction of users and customers behavior as shown in Figures 3a and 3b.

Figure 3: (A): Clicks information; (B): Purchase information. amount.
Analyzing the dataset states can help identify the issues in the dataset and discover the reasons that have impact on the poor performance, especially that the majority of items sold on the website have no purchases transactions during the duration of the events in the dataset, while few items have high purchases and high number of hits. Figures 4a and 4b shows high-level performance of the website in term of the number of hits and item purchases:

Figure 4: (A): Distribution of click and purchase rates in the dataset; (B): Top items clicked vs. purchase ratio.
It is of high importance to discover hidden relation between the proposed Factors (F) in this model, but we can verify to some extent the relation between browsing duration and browsing ratio with the amount of purchases made through the website. Figures 5a and 5b shows high-level relation between hit ratio and duration with purchases number and value. This relation indicates the importance of proposing an accurate framework that builds upon the strong correlation between hit/browsing activities with the amount and value of purchases to predict customer and visitor activities in order to increase revenue, reduce customer churn, and encourage visitors to place orders and make purchases from the website.

Figure 5: (A): Relation of no. of visits with purchase info; (B): Relation of visit duration with purchase info.
As aforementioned, the work in this paper was inspired by Yeo et al [13]. What makes our work different is that we build our model based on RecSys2015 dataset only without simulating it over other private datasets. On the other hand, our work does not consider product conversion, instead, it considers in addition to browsing ratio and browsing duration, the monetary of products, size of purchases, purchase recency, and purchase frequency made through the website.
It is important before we start the implementation of our framework
to explore some of the relations between different attributes in the
dataset. Exploratory Data Analysis (EDA) can give us an idea about
the relations between different events in the dataset and discover the mutual impact including the impact of events sequencing over
time  on different clicks and purchases activities.
Figures 6a and 6b gives an idea about the impact of website hits/ clicks on both spending and amount of purchases. We can see that the revenue and purchases improve in relation to browsing activities.

Figure 6: (A): Hits to spending; (B): Hits to amount of purchases.
In such kind of datasets, it is important to verify from the data the relation between time and different activities taking place in the website. Figure 7 shows the purchase rate dynamics upon sequencing the purchases over the time domain as per customer events in the dataset.

Figure 7: Buying ratio dynamics over time domain.
The impact of the identified pair can be seen in Figures 8a and 8b that reflect the relation between these activities and the amount of purchases recorded in the click-buy dataset.

Figure 8: (A): Session duration vs. buy ratio; (B): Number of clicks vs. purchase.
The Figures 9a and 9b shows how the duration spent in the session (browsing duration) and the number of clicks (browsing ratio) have a clear impact on the purchase.

Figure 9: (A): Time dynamics (Day) vs. purchase; (B): Time dynamics (hour) vs. purchase.
The impact of time sequence on the prediction can be observed from the Figure 8 that shows the impact of addressing the time [t0 : t0 + Δt] to recognize the solution that provides the best results.
Another impact of the time [t0 : t0 + Δt] that we are studying is the time that a customer spends to check the item or the items of same category on the purchase action. The more time a customer spends checking the item page, the more chances that the customer places an order and makes a purchase as shown in Figure 10.

Figure 10: Time spent on item page vs. purchase action
Conceptual diagram: Figure 11 shows high level diagram of the proposed model detailed description in system model of the proposal starting from receiving data of users’ activities on the website, preparing data, modeling data, and then predicting the states based on Markov chains.

Figure 11: High level conceptual model.
System model: Another major difference in this work is the usage of Markov Chain to build our model and figure out non-observed events and their probabilities. Markov chain utilizes algorithms like “Forward” and “Viterbi” to infer the hidden states from a sequence of observations. The two main outputs of markov model are “Transition probability matrix” and “State pair” array. Based on markov algorithm, we are going to check the effectiveness of the proposed framework from different aspects and we are going to evaluate the model by comparing different metrics with those of other algorithms like KNN, SVM.
To the best of our knowledge, this is the first time markov model is to be used with an imbalanced dataset without scaling the data up or down that results in a change in the real data collected from real events.
We will provide the format of the dataset and define the proposed solution. Table 4 defines the notations in our paper that define different activities of the model.
| Notation | Description |
|---|---|
| ✔,c | Customer set, A customer |
| S,∈ | Session Set, A session |
| P, p | Purchase Set, A purchase |
| t,u | User Set, A user |
| V,v | Visit Set, A visit |
 |
Event sequence of a customer/user, A page visit event |
| Ce | Customer ID of event e |
| re | Visited page ID of event e |
| te | Click time of event e |
| pe | Product ID displayed on re |
| Ie | Item set, An item |
| pr | Price |
| ct | Count |
 |
Active customer |
| pt | Active user |
| ft | Inactive user |
 |
Churned customer |
Table 4: The notations which defines different activities of the model.
User click/hit events: Each session ∈ S in dataset “click” has a set
of events stored in the dataset and can be represented as containing ID e , page visited
 , visit time
  , and product visited
  . Sessions are collected over six months and needs to be sequenced
for further processing. E✔={e1,e2……} where
. Sessions are collected over six months and needs to be sequenced
for further processing. E✔={e1,e2……} where 
In this dataset, some products p are on sale during the duration of
recording the dataset and these products has a special description
page. If a page visit event occurs on an on-sale product page,is recorded by related product id, otherwise it is recorded as =Null.
Customer purchases events: When a session ∈ S in the “clicks”
dataset ends up with a purchase, corresponding purchase
information is stored in a record e = ( e , re , te , pe , pr ,ct ) containing IDe ,
page visited re , visit time te , and product visited pe , price pr , count ct . Sessions are collected over six months and needs to be sequenced
for further processing.  where
where 
Dataset attributes description: Based on the data in above Table 4 and the given description, we will carry out two types of predictions:
• Exit prediction: when the dataset records does not
end up with a purchase pe in the purchase dataset. In other
words, a customer (in our case c = ) visits the website v without
making any purchase
does not
end up with a purchase pe in the purchase dataset. In other
words, a customer (in our case c = ) visits the website v without
making any purchase
• p through the website. Every time a customer starts a session, customer session information is stored in “clicks” database
• Purchase prediction: When the dataset records one purchase
or more by a customer  . In such case the customer will have records in both “clicks” and “buy” dataset { (c = )∈ P }and{(c = ) ∈ }.
Both problems will be studied with two concepts conversion candidate and user exit.
Conversion candidate: Given the dataset, let C be a finite set of customers (∈S ) , let P be a finite set of purchases, let be a finite set of visits, and finally, let U a finite set of users. We call (P, p) a customer- purchase pair where (c∈C) and( p∈P) . We call (u,v) a user-visit pair where (u∈t) and (v∈) .
Factor and customer/visitor state estimation: To continue with our description, we can define four transitional states that any customer or user can land on based on their behavior recorded in datasets over the time. The states are:
{active customer- , active user-Pt, inactive user-ft, churned customer-
  }
}
The purpose of this work is to find out the predictability of inactive user ft, and churned customer  . To do so, we first introduce the factors (Fi) and how they are calculated.
F1− Browsing Ratio score (BR):From the dataset, we can calculate the average number of purchases for each item in the dataset. For simplicity, the number of purchases for each item is divided into three categories representing the BR score:
{High (H), Medium (M), Low (L)} where:
• BR=H: For top 10% of calculated BR
• BR=M: For BR value in the range of [30%-90%]
• BR=L: For BR value in the range of [0%-30%]
In other words, the BR score for each item (I) can be expressed as: BR=[H, M, L]
F2– Browsing Duration score (BD): From the dataset, we can calculate the average proportion of time for each item in the dataset. For simplicity, the time duration for each item is divided into three categories representing the BD score: {High (H), Medium (M), Low (L)} where:
• BD=H: For top 10% of calculated BD of all items
• BD=M: For BD value in the range of [30%-90%] of all items
• BD=L: For BD value in the range of [0%-30%] of all items
In other words, the BD score for each Item (I) can be expressed as:
BD = [H, M, L]
F3– purchase value score: If an item is purchased in the dataset, the spending of customers on this item can fall in one of the following categories: {High (H), Medium (M), Low (L)}, but if an item was not part of any purchase transaction, the item can be referred to as {Exit (E)} where:
• Purchase value=H: For top 10% of calculated purchase value of all items
• Purchase alue=M: For purchase value in the range of [30%- 90%] of calculated purchase value of all items
• Purchase value=L: For purchase value in the range of [0%- 30%] of calculated purchase value of all items
The overall representation of the value of an item based on purchase/no-purchase status is: Purchase value=[H,M,L,E]
F4– number of purchases score: If an item is purchased in the dataset, the number of purchases of this item can fall in one of the following categories: {High (H), Medium (M), Low (L)}, but if an item was not part of any purchase transaction, the item can be referred to as {Exit (E)}.
• Number of purchase=H: For top 10% of calculated number of purchase of all items
• Number of purchase=M: For number of purchase in the range of [30%-90%] of calculated number of purchase of all items
• Number of purchase=L: For purchase value in the range of [0%-30%] of calculated number of purchase
The overall representation of the value of an item based on purchase/no-purchase status is: Number of purchase=[H, M,L,E]
F5– Recency of purchases score: If an item is purchased in the dataset, the gap between the last date a purchase was made and the end date of the dataset is calculated to get the recency of this item, and can fall in one of the following categories: {High (H), Medium (M), Low (L)}, but if an item was not part of any purchase transaction, the item can be referred to as {Exit (E)}.
• Recency=H: For top 10% of calculated recency of all items
• Recency=M: For recency in the range of [30%-90%] of calculated recency of all items
• Recency=L: For recency in the range of [0%-30%] of calculated recency of all items
The overall representation of recency based on purchase/nopurchase status is: Recency=[H,M,L,E]
F6–frequency of purchases score: If an item is purchased in the dataset, the frequency of item purchases representing the gap between a purchase and the next purchase can be calculated for each item, and can fall in one of the following categories:
{High (H), Medium (M), Low (L)}, but if an item was not part of any purchase transaction, the item can be referred to as {Exit (E)}.
• Frequency =H: For top 10% of calculated frequency of all items
• Frequency=M: For frequency in the range of [30%-90%] of calculated frequency of all items
• Frequency=L: For recency in the range of [0%-30%] of calculated frequency of all items
The overall representation of frequency based on purchase/nopurchase status is: Frequency=[H, M, L, E]
Based on the given factors F1, F2, F3, F4, F5, F6 and their possible values defined above, for each item, it can be represented as a weight (ω ) that combines the factors F1, F2, F3, F4, F5, F6 as shown in Figure 12 and Table 5.

Figure 12: Frequency for each item represented as a weight (ω )
| Factors | Value range | Weight | ||||
|---|---|---|---|---|---|---|
| F1 | H | M | L | - | ||
| F2 | H | M | L | - | ||
| Item (I) | F3 | H | M | L | m | |
| F4 | H | M | L | E | ||
| F5 | H | M | L | |||
| F6 | H | M | L | |||
Table 5: Based on the given factors F1, F2, F3, F4, F5, F6 and their possible values defined above, for each item, it can be represented as a weight 
that combines the factors F1, F2, F3, F4, F5, F6 .
Weighted items sequencing for weighted session: Following the same concept in factor and customer/visitor state estimation, the value of weight (ω ) which represents a combination of all factors that can fall in one of the following categories as shown in Figure 13:

Figure 13: Weighted session for prediction.
• ω =[H, M, L] for items that have purchases from the dataset, OR
• ω =[H, M, L, E] for items that were not purchased from the dataset
According to this assumption, for each session (∈S ) that has
a sequence of items  and each item has a weight
 , we can calculate a weight for a session calculated
from the combined weights of all items in the session:
, we can calculate a weight for a session calculated
from the combined weights of all items in the session:
• (ω ) =[H, M, L] for any session that ends up with a purchase
• (ω ) =[H, M, L], [E] for any session that does not any purchased item in the sequence of items
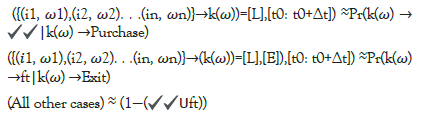
In the same way since information related to the status of customers is not given in the dataset, we induce these states based on thresholds (Hi) that are calculated from sequencing the items visited and/or purchased in each session and weighted by combination of given factors F1, F2, F3, F4, F5, F6 as per below:
• Active customers: Customers whose transactions may lead to purchases from the website
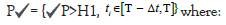
T is prediction time, Δt = prediction duration, H1 is {(ω ) = [H, M]}
• Churned customers: Customers whose transactions may not lead to a purchase:

T is prediction time, Δt = prediction duration, H1 is {(ω ) = [L]}
• Active user: Users whose activities on the website may continue:
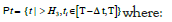
H3 is {(ω )=[H, M], [E]}
• Inactive user: Users whose activities may not lead to new visit:
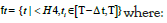
H4 is {k(ω )=[L], [E]}
Exit/churn simulation
The simulation of our work is based on time and sequence of activities so that the sequential move from one event to another over the time domain will have an impact on the decisions made by the algorithms that will predict the class.
All these time related activities will certainly have an impact
on the effort to improve customer perception during browsing
different items and how to use event sequences over time (t0 + Δt)
in the calculation of probabilities discussed earlier in this section,
specifically in a customer’s browsing history  (a sequence of
page visit events of customer). The predictive factors are browsing
ratio (F1), browsing duration (F2), purchases value (F3), number of
purchases (F4),
(a sequence of
page visit events of customer). The predictive factors are browsing
ratio (F1), browsing duration (F2), purchases value (F3), number of
purchases (F4),  (F5), frequency (F6) from events.
In our work, we are going to use Markov Chain model to calculate these probabilities as a series of sequential states represented by transition probability from one state to another as described in weighted items sequencing for weighted session. Moreover, the data will also be evaluated against different algorithms to compare the performance of Markov model with other models.
Markov chain model
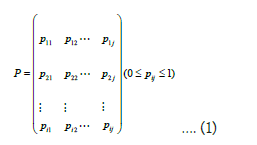
Markov Chain model is a statistical model utilized in this work to
build a process {X (t ), t∈ T}that models state transitions from one
to another in a complex system. Below formulas from Zhou et al.,
describe state transitions and probabilities represented by a matrix
P whose elements are positive and their sum is ![]() and
they represent the probability of future behavior if current state is
known [19].
and
they represent the probability of future behavior if current state is
known [19].
Markov property is:
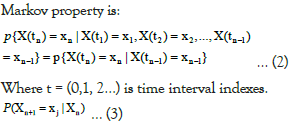
The probability of  in state j after
  is given by:
Detailed technical design
Below diagram describes in detail the high-level conceptual diagram in statistics description. It provides step-by-step process toward building a proper model to predict sequential activities over time after preparing and modeling the data as per factor and customer/ visitor state estimation and weighted items sequencing for weighted session.
In the prediction part of the proposed model, we are going to focus on Markov model as a solution but we will compare the results with other classifiers (SVM, KNN) to have more insights on the strengths that markov model offers compared to other classifiers by comparing all performance metrics like accuracy, recall, precision, and F21 score as shown in Figure 14.

Figure 14: Proposed model diagram.
Algorithm pseudocode: (BR): Browsing Ratio; (BD): Browsing Duration; (PV): Purchase Value; (PN): Purchase Number; (PR): Purchase Recency; (PF): Purchase Frequency as shown in Figure 15.

Figure 15: Markov conversion implementation pseudocode.
Design discussions: The recent paper that built a framework to predict item conversion (item visit >> item purchase) was concerned on predicting the changes of customer behavior toward available items offered in the website and the visited items that might be changed to possible purchases, but they did not consider the customer that could churn from the website which may reflect possible loss of revenue [13].
The rational behind selecting this model is to include different types of user activities to predict user or customer behaviour in terms of whether they will keep using the website and place orders and purchases through it or not. Especially that the consideration of values of purchases and amount of purchased items over time scale could add better insights in predicting weather there is tendency for customers to churn or not, and if visitors are showing more interest in visiting the website so that they may change to customers, or the interest of visiting the website over the time is getting less which indicates a problem that needs special care. Based on these points, Markov is a good algorithm to model sequences that would discover the hidden states of website customers and users over the time as it is able to capture the constraints of sequential events and it allows predicting future user/customer activity based on the discovered constraints in the dataset leading to better performance in term of predicting future customer behaviour on the form of sequence patterns.
Evaluation
Time complexity and big-o notation: Evaluating time complexity of sequential models is not easy when handling big dataset as the one we are working on. Markov chains would be much better with smaller datasets as the big-o notation is O (n2) with quadratic shape. The time computation of a sample of the processed dataset upon the implementation of the main function that finds the probability matrix between the items as per proposed solution on different sizes of the dataset is shown in Figure 16.

Figure 16: Time computation.
Due to the huge number of items and the unique sequences created from moving from one item to another, the time complexity is high in windows OS with “12 GB” RAM and “Intel(R) Core(TM) i5- 7200U CPU @ 2.50GHZ” CPU. So, computation time is mainly related to the process of identifying the probability matrix and the sequencing of the events for all possible combinations through the dataset. For this reason, CPU utilization measured by jupyter notebook is high [67%]. While memory utilization also showed high value around [74%].
Despite the high computation time, in next section we will see the pros of markov chain over other algorithms based on metrics calculation and assessment.
Functional analysis: One of the requirements to build Markov
chain model is to produce the states  that Markov process is
going to move through over a sequential timely events, so that we
can predict future customers or visitors actions during
that Markov process is
going to move through over a sequential timely events, so that we
can predict future customers or visitors actions during
In this section we are going to carry out a comparison between
three algorithms that can be used with sequences like the one in
the given dataset: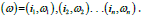
The algorithms that we are going to compare with markov are KNN and SVM. Our target is to compare all metrics not only accuracy, so that we may have better insights on the actual benefits of markov model over other models. One observation regarding this data is that it is biased toward exit class, as most of the sequences end up with exit. This means that such data is not balanced. Usually, there are different techniques to handle imbalanced datasets like overfitting. Under fitting, SMOTE, but in such dataset as the one we are using, implementing these techniques is not possible for the sequential pattern of data [20-22] moreover, any manipulation of this kind will change the nature of the data even when we use advanced techniques like SMOTE. In this case, our judgement will be based on F1 score that combines both recall and precision not the accuracy that might give misleading information about the performance of the models.
The processed data was split into training set of 75% size, and test set of 25% size as this scenario has given the best metrics taking into consideration keeping the same distribution of all classes among the two sets to avoid the scenario of a missing class in one of the generated sets. The training set was fit into the three algorithms to predict the results over the test set.
To validate our results, we can cross-validate the performance of each machine learning algorithm by tuning the set of parameters for the algorithm that generates the best metrics values.
For KNN, the parameter k-step was given different values to find out the best one that gives the best performance that will be used as a benchmark with markov model. Table 6 shows the metrics generated by KNN algorithm for each k-step value. We notice that for k=5, the metrics show best performance as k=7 shows degradation compared to k=5.
| KNN | ||||
|---|---|---|---|---|
| K-Step | Accuracy | Recall | Precision | F1 |
| 1 | 0.9 | 0.35 | 0.34 | 0.344928 |
| 3 | 0.39 | 0.39 | 0.35 | 0.368919 |
| 6 | 0.91 | 0.45 | 0.42 | 0.434483 |
| 7 | 0.89 | 0.38 | 0.36 | 0.36973 |
Table 6: Below table, shows the metrics generated by KNN algorithm for each k-step value. We notice that for k=5, the metrics show best performance as k=7 shows degradation compared to k=5.
In the same way, SVM also cross-validated to find the best values of the metrics so that it can be used for the benchmarking and evaluation of different algorithms. Below is the combination of parameters that produced the best results for benchmarking:
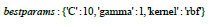
Figure 17 we can find the confusion matrices for all algorithms used in this paper:

Figure 17: Confusion matrix for all algorithms.
Table 7 reflects the comparison carried out between KNN and SVM algorithms used for benchmarking from one side, with the algorithm proposed in this work on the other side.
| Metrics benchmarking | ||||
|---|---|---|---|---|
| Classifier | Accuracy | Recall | Precision | F1 |
| Markov | 0.87 | 0.81 | 0.54 | 0.648 |
| KNN | 0.91 | 0.45 | 0.42 | 0.4344 |
| SVM | 0.93 | 0.48 | 0.41 | 0.4422 |
Table 7: Below table reflects the comparison carried out between KNN and SVM algorithms used for benchmarking from one side, with the algorithm proposed in this work on the other side.
The results clearly show that despite both SVM and KNN have higher accuracy, but Markov shows noticeably higher recall, precision and F1_score as result, reflecting better performance this means that markov can handle all classes in an imbalanced system more efficiently than other algorithms and can generate a better perclass performance than other algorithms used for benchmarking.
To confirm our findings, we can plot the AUC-ROC of each algorithm to find out the capability of each model to distinguish between all classes so that we can decide on the best model for the proposed framework:
Figure 18 shows that the AUC of markov (~0.71) is better than the other two algorithms of SVM (~0.56) and KNN (~0.54) and this means that the ability to correctly separate all classes outperforms SVM and KNN. This is very important in scenarios where we need to carry out a study of sequential events over time leading to imbalanced classes and there is no chance to achieve balanced data used with traditional systems like in proposed by Idris et al., Pecorelli et al., and Vajiramedhin et al [20-22].

Figure 18: AUC value.
 Markov, AUC=0.7105.
Comparison with existing work: This work is implemented on a public dataset recsys15 that was used in different papers like in proposed by Yeo et al [13]. In this section, we will carry out a comparison between our work and other works used same dataset to study conversion probability on this dataset.
Yan et al. used recsys15 to predict if a user is going to make a purchase or not [14]. They used GBDT classifier for prediction and they showed the accuracy of the model only using the proposed classifier without introducing other metrics and they did not even compare their model using other classifiers. The other point is that there was no complexity analysis for the proposed model. Romov et al. were more specific in discussing the problem of customer behaviour prediction in imbalanced recsys15 dataset and they calculated different metrics (accuracy, recall, precision, and AUC) [15]. They addressed this problem as a binary prediction using XGBOOST to predict whether a customer will make a purchase. The authors of this paper also did not carry out any comparison with other models to confirm the best results and they did not add complexity analysis.
Yeo et al. the paper made in a professional way and the authors used the dataset to predict online purchase conversion based on assessing customer behaviour over the duration of the dataset taking purchase history, customer visits to items, and the time taken to visit the website [13]. In this paper, the work was based on modeling the data in the given dataset with other datasets NOT publicly available to extract customer distribution over the recsys15 dataset since NO customer information was available. The target was to predict whether a customer would make a purchase or not based on the simulated data. The authors built their own model and they compared the results with other existing models that take into consideration some factors for predicting customer conversion. In this paper, the authors compared their model to other existing models using RMSE and PCC to evaluate their regression framework, but the disadvantages of their work:
• They modeled customer behaviour over existing sessions in the recsys15 dataset without providing clear methodology for doing this, making the evaluation of this work, and then improving it not practically possible.
• Although they modeled recsys15 over private dataset, RMSE showed increasing values in time, reflecting the rise of errors in their model.
• The authors did not cover complexity and computation resources utilized in this work.
• Their model, despite including additional factors, did not consider important factors that impact prediction like purchase value, purchase number, purchase recency, and purchase frequency.
In our work, we built a model based on recsys15 also, but with following advantages:
• We used the dataset as the only dataset to build our model and each session is considered as a customer.
• To the best of our knowledge, this is the first paper that addresses not only customer churn, but also visitors’ activities and exit prediction.
• We used markov process designed to address the problem of sequential activities to predict customer churn and visitor exit.
• This model can be evaluated and developed by anyone interested in predicting customer behaviour as all steps to build the model are explained and discussed in the paper.
• All metrics were evaluated and compared with other algorithms to confirm performance.
In this paper, we used recsys15 data set to predict customer behaviour (customer churn and visitor prediction). For this, we built a framework that is based on markov model and other machine learning techniques to calculate model’s metrics of accuracy, recall, precision, F1, and AUC. Then we compared the results with frameworks built with other classification algorithms (SVM and KNN). Results show that our model is able to make accurate prediction not only on overall system level (due to biased to majority class), but also a model which is able to separate the classes properly with good performance in such imbalanced data. The results also show that proposed model outperformed other models (SVM and KNN) on per class prediction and this is reflected in F1 values and AUC.
The results are encouraging, and markov model can be further improved if e-marketing website can provide more information about customers and users in addition to session information.
Moreover, the performance of markov model can be further improved by increasing the order of neighboring events that can be configured for prediction with additional computation resources.
[Crossref ] [Google Scholar].
[Crossref ] [Google Scholar ].
[Crossref] [Google Scholar].
[Crossref ] [Google Scholar ].
[Crossref] [Google Scholar].
[Crossref] [Google Scholar].
[Crossref] [Google Scholar].
[Crossref ] [Google Scholar]
[Crossref] [Google Scholar].
[Crossref] [Google Scholar]
[Cross ref ] [Google Scholar]
[Cross ref ] [Google Scholar ]
[Crossref ] [Google Scholar]
Citation: Pierre A (2023) A Study on Applying Artificial Intelligence and Machine Learning for Modeling and Predicting Customer Behaviors, Churning and Conversion. Mathe Eter. 13: 196
Received: 14-Nov-2023, Manuscript No. ME-23-28010; Editor assigned: 17-Nov-2023, Pre QC No. ME-23-28010 (PQ); Reviewed: 04-Dec-2023, QC No. ME-23-28010; Revised: 13-Dec-2023, Manuscript No. ME-23-28010 (R); Published: 22-Dec-2023 , DOI: 10.35248/2574-0407.23.13.196
Copyright: © 2023 Pierre A. This is an open-access article distributed under the terms of the Creative Commons Attribution License, which permits unrestricted use, distribution, and reproduction in any medium, provided the original author and source are credited