Global Journal of Life Sciences and Biological Research
Open Access
ISSN: 2456-3102
+44-77-2385-9429
ISSN: 2456-3102
+44-77-2385-9429
Research Article - (2023)Volume 9, Issue 1
Background: Since COVID-19 has become one of the biggest challenges for health care systems in the past decade. The SARS-CoV-2 primarily affects the lungs, but many studies implied that other health complications such as brain damage, heart failure, and kidneys dysfunction also are associated with SARS-CoV-2 infection. Many scientific efforts have revealed the clinical and molecular details of SARS-CoV-2 pathogenesis. However, comprehension of COVID-19 complications demands more investigations. In this context, the relation between SARS-CoV-2 infection and cancer has been less addressed. In this regard, we aimed to discover any possible links between SARS-CoV-2 infection and cancer development in a bioinformatics study.
Methods: The pertinent datasets were chosen from the GEO database. COVID-19 was searched for differentially expressed genes where |Log2 FC|>1 and P<0.05 were deemed statistically significant. The Cluster Profiler package employed gene ontology and pathway enrichment analysis for common genes. Functional interaction of proteins was predicted using STRING online, then Cytoscape analysis was carried out to determine the target genes. Finally, gene set enrichment analysis was performed to find any correlation between candidate genes and different types of cancer.
Results: The analysis showed that numerous cancer-related genes up-regulated in SARS-CoV-2 infected patients, particularly those genes participating in the cell cycle regulation or engaged in cellular senescence processes.
Conclusion: Our findings suggest that SARS-CoV-2 can be considered a potential risk factor for increasing the probability of developing cancer.
COVID-19; SARS-CoV-2; Neoplasms; Omics analysis
Soon after the Severe Acute Respiratory Syndrome Coronavirus 2 (SARS-CoV-2) pandemic, numerous disquisitions indicated that the affection of the SARS-CoV-2 is not only limited to the lungs but other organs such as brain, heart, and kidneys also could be involved [1]. It has previously been indicated that SARS- CoV-2 shares transcriptional gene signatures with some specific human tumor cell lines [2]. Yet, there are no sufficient pieces of evidence regarding the risk of developing cancer in COVID-19 patients. However, we already know that infectious agents are responsible for about 15-20% of all human cancers, on the top of the list are oncogenic viruses [3]. These viruses can lead to cancer by inducing the expression of genes that interrupts cell cycle regulation and promote the nonstop cell division [4,5]. In the context of SARS-CoV-2, an association with the pancreatic adenocarcinoma SARS-CoV family has been suggested [6]. Also, a network analysis study reported that SARS-CoV-2 could make an impact on tumorigenesis-related regulators including cell proliferation, death, migration, and the immune system in cancer patients [7]. Accordingly, we conducted a bioinformatics analysis of 5 data sets to identify the expression pattern of cancer-related genes in blood sample of SARS-CoV-2 infected patients.
Dataset selection
We searched Gene Expression Omnibus (GEO) database (https://www.ncbi.nlm.nih.gov/gds) for publicly available RNA sequencing datasets of COVID-19 infected patients. We used “SARS-CoV-2” and “COVID-19” keywords as the query. Only datasets with more than 10 patients diagnosed with COVID-19 based on the RNA blood sample were included in our study. Studies in which patients were undergoing treatment or the samples were not blood-derived were excluded. In addition, we avoided using the normalized format of data such as Transcripts Per Million (TPM) or Reads Per Kilobase of transcript per Million reads mapped (RPKM). The raw count data were downloaded in .txt or .csv format from the database.
RNA-seq data processing
We acquired GSE157103, GSE152641, and GSE171110 as major datasets in our study because of the big sample size (a total of 206 COVID-19 patients and 60 healthy objects). We imported the read counts table into R studio using the “read.csv” function. Firstly, “DGEList” function (edgeR package) was used for creating a digital gene expression list [8]. The second step was the filtering and normalization of data. Features with a low count in CPM (Count Per Million) were filtered. For data normalization, we used the Trimmed Mean of M-values (TMM) calculated by “calcNormFactors” function in the edgeR package. The edgeR package was also used to define Differentially Expressed Genes (DEGs). In each dataset, we performed a t-test to compare the specific gene expression in COVID-19 patients with healthy samples. To avoid multiple comparisons problem, the Benjamini Hochberg method was used for p.value adjustment. Additionally, the ratio of mean expression of genes in COVID-19 patients to that in the healthy controls, which is the Fold-Change (FC), was calculated. We considered the genes with adjusted p.value<0.05 and |log2 FC| >1 as DEGs. The intersection between DEGs in three datasets was demonstrated via the Venn diagrams web tool of Bioinformatics and Evolutionary Genomics (http:// bioinformatics.psb.ugent.be/webtools/Venn/).
Samples annotation
For converting Ensembl gene IDs to NCBI official gene symbols, we used Homo sapiens annotation package (hgu133plus2.db) in R. The biomaRt package was used to match Ensembl gene IDs to the official gene names in the annotation database [9].
Pathway and functional enrichment analysis
The CusterProfiler package of R was applied to perform the pathway and functional enrichment analysis according to the Gene Ontology (GO) database (http://geneontology.org/) and Kyoto Encyclopedia of Genes and Genomes (KEGG) database (https://www.genome.jp/kegg/) [10]. GO is comprised of three different categories including Biological Process (BP), Cellular Component (CC), and Molecular Function (MF). KEGG is a collection of manually drawn pathway maps that shows molecular interactions in constructing a biological pathway. We defined terms with adjusted p.value <0.05 as significant and displayed the top significant terms in bar plot and dot plot format using ggplot2 package in R.
Transcription Factor Enrichment Analysis (TFEA)
We used enrichR web tool (https://maayanlab.cloud/Enrichr/) to define Transcription Factors (TFs) that control the expression of differentially expressed genes. The category of “ENCODE and ChEA consensus TFs from ChIP-X” was selected in these analyses. ChEA utilizes a gene-set library with transcription factors labeling sets of putative target genes curated from published ChIP-chip, ChIP-seq, ChIP-PET, and (DNA adenine methylase Identification) DamID experiments. The Encyclopedia of DNA Elements (ENCODE) is a collaborative consortium with the goal of constructing a comprehensive parts list of functional elements in the human genome, such as transcription factors. The DEG names were imported as inputs to enrichR and the processed results were shown in a clustergram.
Protein-protein interaction network
We used the assigned DEG symbols in “the Search Tool for the Retrieval of Interacting Genes/Proteins” (STRING) (https:// string-db.org/). We set known interactions (curated databases and experimentally determined) as highly valid interaction sources. A minimum confidence scores higher than 0.4 was adjusted for protein-protein interactions. Afterwards, we exported the network in Tab-Separated Values (TSV) format. The TSV file was imported to the Cytoscape app [11]. Then MCODE plug- in was used to show highly interconnected regions (clusters) in our network with default settings. The clusters with more than 10 nodes and a score higher than 5 were considered significant clusters [12].
Gene Set Enrichment Analyses (GSEA)
We analyzed GSE189990 and GSE152418 datasets and DEGs were defined according to the above description. In the next step, the DEGs of each dataset were given a scale according to their fold change. GSEA were conducted through the “GSEA” function of cluster Profiler package of R. Curated gene sets in the MSigDB database (C2 category) (https://www.gsea-msigdb.org/ gsea/msigdb/) was used for our analysis. P.values less than 0.05 were considered to be significantly enriched. “gseaplot2” function of enrich plot package of R was used for presenting GSEA results.
Gene differentially expression
Firstly, five different datasets, three main datasets and two confirmatory datasets, were analyzed to obtain a list of differentially expressed mRNAs in COVID-19 patients (Table 1). The expression levels of mRNAs were compared in the blood, PBMC and plasma sample of COVID-19 patients. In total, 756, 1060, and 2458 differentially expressed mRNAs have been found in GSE157103, GSE152641, and GSE171110, respectively. Next, we determined the mRNAs which were dysregulated in our datasets altogether. The commonly up-regulated genes are outlined in Figure 1. Our analysis indicated that 183 genes were up-regulated in both GSE157103 and GSE171110, 322 genes in GSE171110 and GSE152641, 14 genes in GSE157103 and GSE152641 and 186 were up-regulated among the datasets (Figure 1A). On the other hand, 33 genes were down-regulated in GSE157103 and GSE171110, 44 genes in GSE171110 and GSE152641, 2 genes in GSE157103 and GSE152641 and 8 were down-regulated in all datasets (Figure 1B). The commonly up- regulated genes are listed in Table 2.
| Num | Dataset acc | Samples | RNA source | Platform | Data type |
|---|---|---|---|---|---|
| 1 | GSE157103 | 100 COVID | Plasma and leukocyte | Illumina NovaSeq 6000 | Raw counts |
| 26 Healthy | |||||
| 2 | GSE152641 | 62 COVID | Whole blood | Illumina NovaSeq 6000 | Raw counts |
| 24 Healthy | |||||
| 3 | GSE171110 | 44 COVID | Whole blood | Illumina HiSeq 2500 | Raw counts |
| 10 Healthy | |||||
| 4 | GSE189990 | 20 COVID | Whole blood | Illumina NextSeq 500 | Raw counts |
| 4 Healthy | |||||
| 5 | GSE152418 | 17 COVID | PBMC | Illumina NovaSeq 6000 | Raw counts |
| 17 Healthy |
Table 1: Datasets information
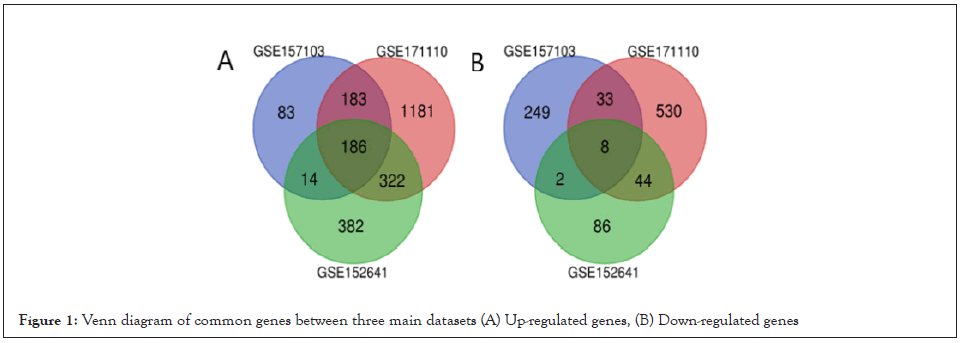
Figure 1: Venn diagram of common genes between three main datasets (A) Up-regulated genes, (B) Down-regulated genes
| WASF1 | HASPIN | SH3TC2 | IFIT3 | DDX60 | RRM2 |
| TPX2 | HERC6 | OLFM4 | CDC25A | BEND7 | TOP2A |
| CCNB1 | NSG2 | CCNB2 | ESPL1 | TICRR | CAV1 |
| ERG | XAF1 | CRACD | E2F8 | PYCR1 | NEXN |
| CEACAM6 | OLR1 | CEP55 | ANKRD34B | HTRA3 | LTF |
| LEP | MCM10 | OAS2 | DHCR24 | CENPA | SPC25 |
| CMPK2 | SIGLEC1 | TACSTD2 | CCNA1 | CAMP | BUB1B |
| GINS1 | USP18 | CDC45 | FRMD3 | TXNDC5 | HJURP |
| ANLN | KCNN3 | GLDC | DEPDC1B | PTX3 | H2BC8 |
| BIRC5 | TYMS | DLGAP5 | TRIM22 | CDC20 | SMTNL1 |
| CD38 | SPATS2L | CKAP2L | RGS16 | BUB1 | DTL |
| FOXM1 | EPSTI1 | RNASE1 | H4C8 | POLQ | RSAD2 |
| MAOA | OTOF | HERC5 | CRYM | PBK | RAD51 |
| CDK1 | ZWINT | MKI67 | DEFA4 | BHLHA15 | SERPINB10 |
| MZB1 | CCNA2 | CLSPN | PLK1 | AZU1 | HMMR |
| TMEM255A | MACIR | ACOXL | KIAA1958 | OASL | LY6E |
| SERPING1 | GTSE1 | MX1 | CEACAM8 | SKA1 | KIF20A |
| HESX1 | CHIT1 | DZIP1L | CHEK1 | CRISP3 | SAMD9 |
| ORC1 | E2F7 | ZCCHC2 | KIF18B | TRIP13 | LCN2 |
| BAMBI | PCSK9 | CDCA2 | E2F1 | TROAP | TTK |
| SEPTIN4 | CA12 | EXO1 | H2BC7 | DEFA3 | NCAPG |
| CDC6 | CDCA5 | CARD17 | H2BC5 | SHCBP1 | CD274 |
| APOBEC3B | RPH3A | DOC2B | UBQLNL | MAOB | TARM1 |
| IFI27 | TRIM6 | IFIH1 | KIFC1 | INHBA | CENPM |
| AURKB | XKR3 | CAV2 | PRRT4 | CDCA3 | SCN5A |
| OAS1 | ZNF608 | EPAS1 | MYBL2 | TCN1 | SCN9A |
| GLDN | DEPDC1 | SUCNR1 | IFIT2 | UBE2C | JCHAIN |
| H2BC9 | IQGAP3 | BPI | ARNTL2 | SDC1 | IFI44 |
| KIF4A | GGH | RHOBTB1 | OAS3 | IFI44L | CENPF |
| TNFRSF17 | EIF2AK2 | ABCA13 | MPO | IFIT1 | H2BC17 |
| ETV7 | MMP8 | DUSP13 | SAMD9L | SAP30 |
Table 2: Common up-regulated genes
Pathways and biological processes
KEGG enrichment analysis revealed that 186 of the up-regulated genes were enriched in various biological pathways related to cell division such as cell cycle, viral carcinogenesis, cell senescence and so forth (Figure 2A). Subsequently, a GO analysis was performed to pinpoint the biological processes with up-regulated genes. The analysis in the BP module revealed that the processes with up-regulated genes were related to cell cycle regulation such as mitotic nuclear division, nuclear division, organelle fission and so on. According to the CC module, up-regulated genes were located in condensed chromosomal regions, centromeric regions and the loci for chromosome division particles such as spindle and kinetochore. Moreover, the MF module confirmed that up-regulated genes were mostly involved in DNA replication pathways (Figure 2B). On the other hand, a GO analysis of GSE152641, GSE1711110 and GSE157103 was carried out to reveal the down-regulated genes in SARS-CoV-2 samples. As a result, the genes involved in T cell activation, interleukin-4, and interleukin-5 were down-regulated in GSE152641, GSE1711110 (Figure 2C). Furthermore, the involved genes in protein targeting to membrane, protein targeting to Endoplasmic Reticulum (ER), nonsense-mediated decay, protein localization to ER, as well as the genes encoding the ribosome subunits were down-regulated in GSE157103, GSE1711110, which in turn may help the viruses escape the human immune system (Figure 2D).
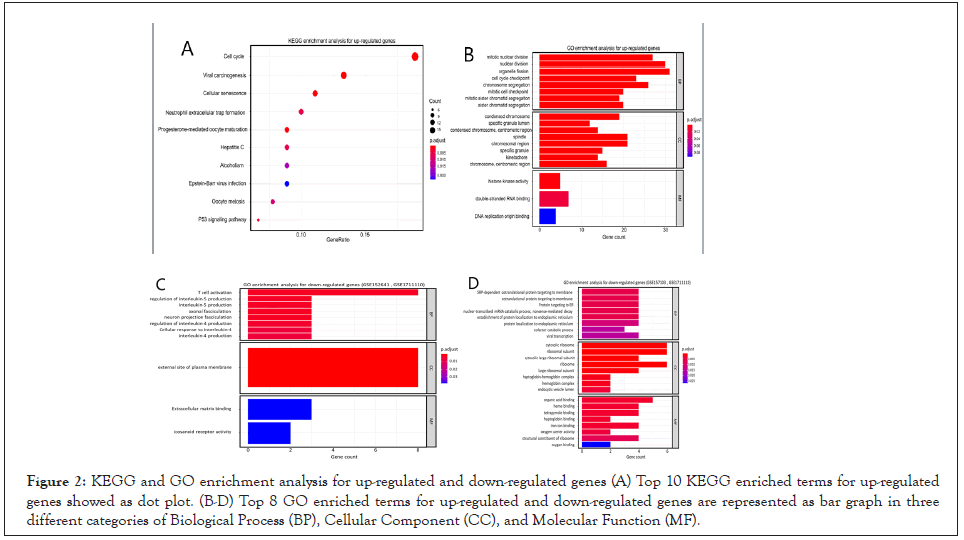
Figure 2: KEGG and GO enrichment analysis for up-regulated and down-regulated genes (A) Top 10 KEGG enriched terms for up-regulated genes showed as dot plot. (B-D) Top 8 GO enriched terms for up-regulated and down-regulated genes are represented as bar graph in three different categories of Biological Process (BP), Cellular Component (CC), and Molecular Function (MF).
Regulation by transcription factors
We discovered 20 validated transcription factors for up-regulated genes using ENCODE and ChEA projects (Figure 3). Of these, FOXM1, E2F4, SIN3A, E2F1 had higher significance value. FOXM1 is a crucial transcription factor in cell proliferation [13]. E2F1 and E2F4 are involved in the regulation of DNA replication, DNA damage process, cell cycle progression, and the apoptosis [14,15]. SIN3A, a transcription factor with Paired Amphipathic Helix (PAH) domains, can interact with other transcription factors such as STAT-3 and adversely regulate its function [16]. There were other up-regulated transcription factors in the analysis with insignificant results. These include IRF1, 3 and 8 implicated in interferon responses, E2F1, 2, 6, NF-YA/B with roles in cell cycle regulation, DNA replication, DNA damage repair and apoptosis, and lastly TP53, TP63 and FOS with proto- oncogenic properties.
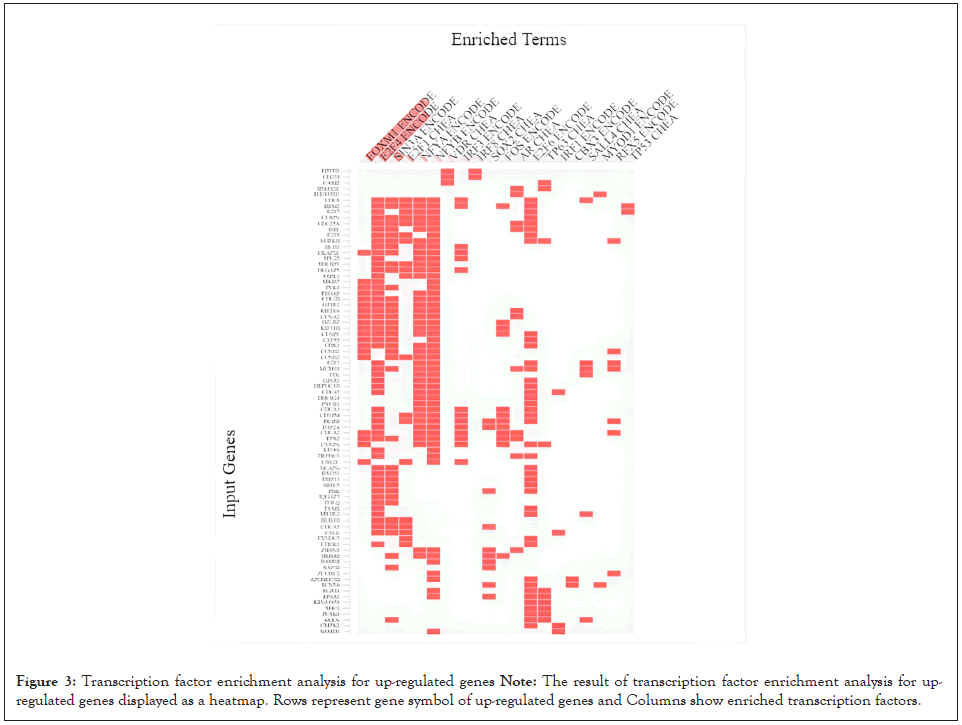
Figure 3: Transcription factor enrichment analysis for up-regulated genes
Note: The result of transcription factor enrichment analysis for up-
regulated genes displayed as a heatmap. Rows represent gene symbol of up-regulated genes and Columns show enriched transcription factors.
Protein-protein interaction network
We utilized STRING database in order to identify the important protein connections and the known interactions with scores higher than 0.4 were extracted in TSV format. The TSV file was imported to the Cytoscape app. Then MCODE plug-in with default settings was used to locate highly interconnected regions (clusters) in our network. The clusters with more than 10 nodes and a score higher than 5 were defined as significant clusters. We also performed the functional enrichment analysis for the first two significant clusters. Genes in cluster 1 (score: 10, 10 nodes and 45 edges) mostly took part in the type I interferon signaling and defense responses to viruses. Furthermore, KEGG analysis showed enrichment not only in COVID-19 but other viral infection such as Hepatitis C, Influenza A and Measles (Figures 4A-4C). The genes in cluster 2 (score: 6.63, 20 nodes and 63 edges) participated in the regulation of cell cycle phase transition and the cell cycle checkpoint control (Figures 4D-4F). These data suggest a possible association between COVID-19 infection and a high risk for cancer development. So far, our analysis indicated that the cell cycle related genes are up-regulated in COVID patients. Also, our protein-protein interaction analysis identified active protein networks in viral infection process which were also involved in the control of cell cycle progression. We imported the differentially expression genes data from GSE189990 and GSE52418 (confirmatory datasets) to GSEA and searched the terms related to cell cycle/cell cycle regulation. Results were congruous with our previous findings and the target genes were enriched in COVID-19 phenotype in both confirmatory datasets (Figures 5A and 5B). Furthermore, up-regulated genes from GSE189990 were enriched in the terms related to cancer, including hepatic cancer (Chiang_liver_cancer_subclass_proliferation_up), breast cancer (Smid_breast_cancer_basal_up), cervical cancer (Rosty_cervical_cancer_proliferation_cluster), gastric cancer (Vecchi_gastric_cancer_early_up) and adrenocortical tumor (West_adrenocortical_tumor_up) (Figure 6A). Moreover, targets genes from GSE52418 were also up regulated in cervical cancer (Rosty_cervical_cancer_proliferation_cluster), breast cancer (Smid_breast_cancer_basal_up), liver cancer (Chiang_ liver_cancer_subclass_proliferation_up), adult T cell leukemia (Sasaki_adult_T_cell_leukemia), and gastric cancer (Vecchi_ gastric_cancer_early_up) terms (Figure 6B).
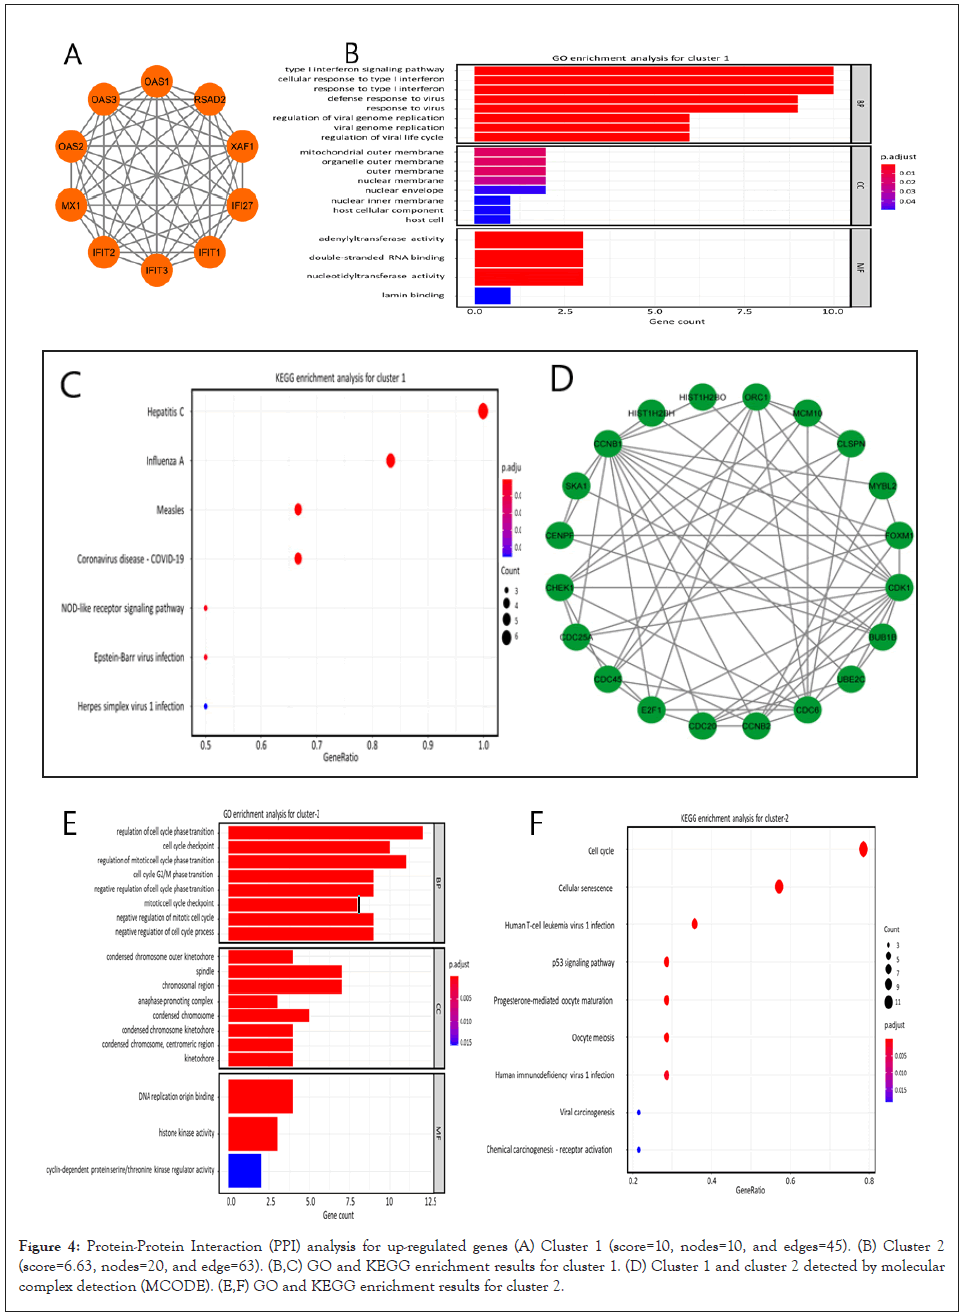
Figure 4: Protein-Protein Interaction (PPI) analysis for up-regulated genes (A) Cluster 1 (score=10, nodes=10, and edges=45). (B) Cluster 2 (score=6.63, nodes=20, and edge=63). (B,C) GO and KEGG enrichment results for cluster 1. (D) Cluster 1 and cluster 2 detected by molecular complex detection (MCODE). (E,F) GO and KEGG enrichment results for cluster 2.
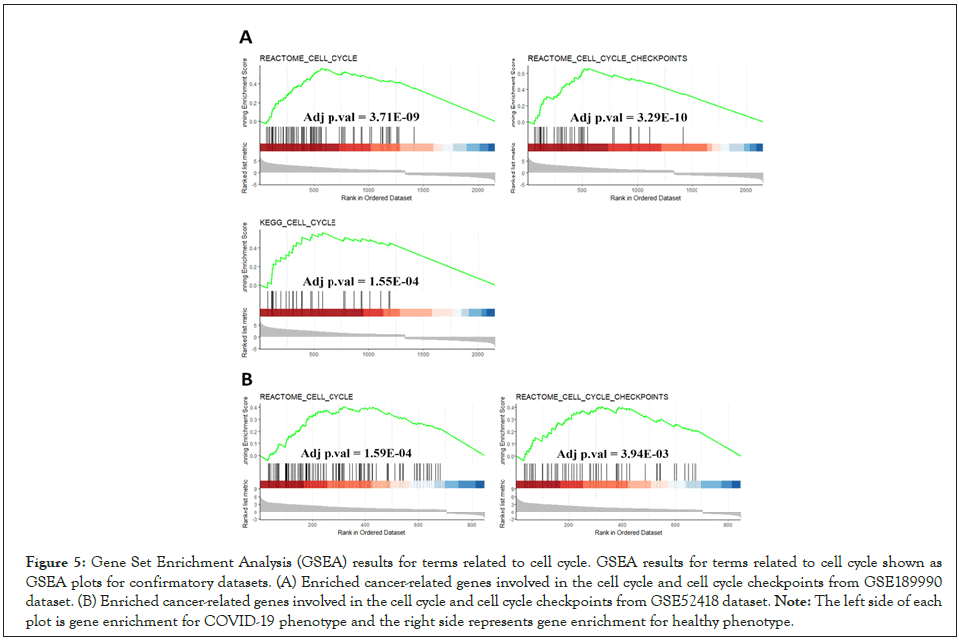
Figure 5: Gene Set Enrichment Analysis (GSEA) results for terms related to cell cycle. GSEA results for terms related to cell cycle shown as
GSEA plots for confirmatory datasets. (A) Enriched cancer-related genes involved in the cell cycle and cell cycle checkpoints from GSE189990
dataset. (B) Enriched cancer-related genes involved in the cell cycle and cell cycle checkpoints from GSE52418 dataset.
Note: The left side of each
plot is gene enrichment for COVID-19 phenotype and the right side represents gene enrichment for healthy phenotype.
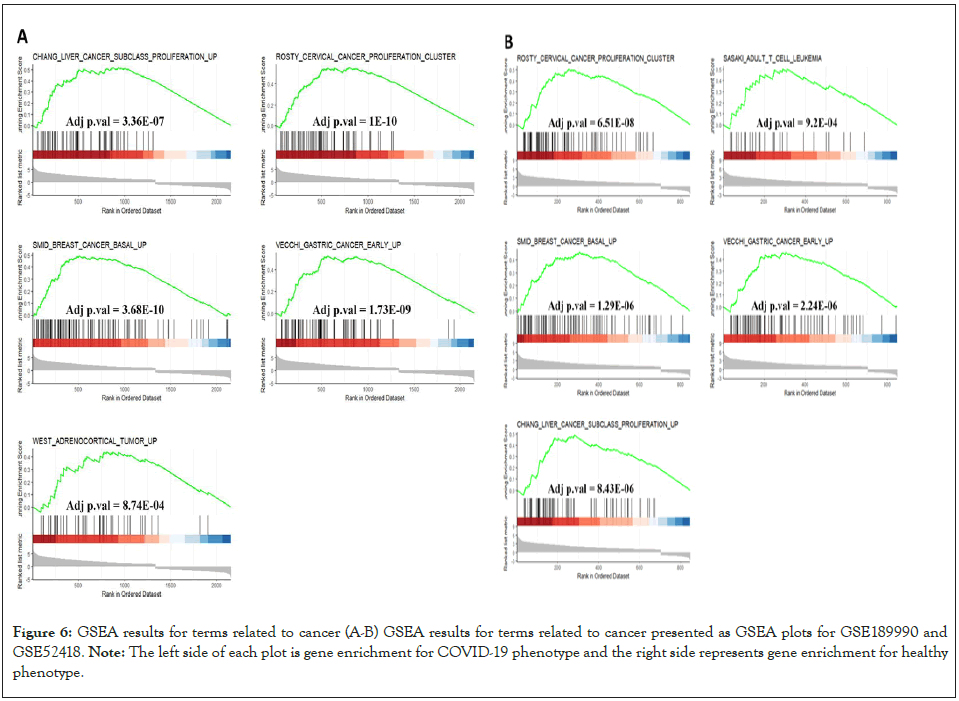
Figure 6: GSEA results for terms related to cancer (A-B) GSEA results for terms related to cancer presented as GSEA plots for GSE189990 and GSE52418.
Note: The left side of each plot is gene enrichment for COVID-19 phenotype and the right side represents gene enrichment for healthy
phenotype.
Although the SARS-CoV-2 predominantly is a pulmonary disease [17], but other complications such as heart failure, brain damage and kidneys impairment have been reported [18-20]. To date, limited studies have described SARS-CoV-2 as a potential risk factor for developing cancer. Former analysis on transcriptomic databases suggested that SARS-CoV-2 induces the expression of the host transcription factors which also could be identified in NHBE, A549, and Calu-3 lung cancer cell lines. In the course of SARS-CoV-2 invasion host immune checkpoints and cytokine pathways such as Programmed Death Ligand 1 (PDL1), PDL2, Interleukin 6 (IL-6), type II interferon, and NF-Kappa B (NF-κB) are activated in order to wipe-out the infection. These pathways also manifested in cancer cell lines similar to host reaction against SARS-CoV-2 [2]. Another bioinformatic study analyzed the gene expression pattern of 10 most life-threatening cancers. The TCGA database results demonstrated up-regulation of CREB1, PTEN, SMAD3, and CASP3 genes in pancreatic adenocarcinoma. Based on their conclusion, SARS-CoV-2 potentially could induce the expression of these genes through interaction with Angiotensin- Converting Enzyme 2 (ACE2) on the cell surface of pancreatic cells [6]. Also, it has been suggested that SARS-CoV-2 is involved in tumorigenesis mechanisms that control cell proliferation, death, migration as well as immune system responses [7].
However, due to the complexity of SARS-CoV-2 pathogenicity, the long-term health consequences demand more investigations. In this context, our analysis revealed that the up-regulated genes in COVID-19 is similar to cancer processes at least in three different categories including: cell cycle regulation, viral carcinogenesis, and cellular senescence.
The most characteristic feature of cancer development is dysregulation of the cell cycle machinery [21]. The cell cycle regulatory mechanism is tightly associated with the cellular processes of proliferation, differentiation, and apoptosis [22]. Any disruption in the cell cycle regulation leads to molecular changes that result in aberrant biological behavior of cancer cells [23]. This includes resistance to DNA damages, apoptosis and anti-mitotic programs as well as activation of oncogenes or deactivation of tumor suppressor genes that are mediated by cell cycle regulatory mechanisms [24]. Accordingly, 17 cell cycle-related genes were up-regulated in SARS-CoV-2 patients including: CCNB2, ESPL1, TTK, CCNA2, CCNB1, CDC6, CDC20, CDK1, BUB1, CHEK1, BUB1B, CDC45, PLK1, CCNA1, ORC1 AND E2F1. Any dysregulation in the expression of these genes is linked with various cancers, such as breast cancer, digestive tract cancer, bone cancer, endometrial cancer, skin cancer, brain cancer, lung cancer and so on. For example, the Cyclin B2 (CCNB2) is a cell cycle regulator and a member of B-type cyclins superfamily [25]. CCNB2 deficiency causes the G2/M checkpoint to fail during the cell cycle, resulting in gene mutations and cancer [26]. The role of CCNB2 in the development of various cancers and metastatic conditions has also been documented. Its overexpression is associated with poor prognosis in Hepatocellular Carcinoma (HCC) patients [27]. Also, targeting CCNB2 via miR-582-3p seems to inhibit the proliferation of acute myeloid leukemia [28]. An up-regulated expression of CCNB2 was noted in human Triple-Negative Breast Cancer (TNBC) cells which ultimately contributed to some pathological features in TNBC patients. In addition, CCNB2 increases the proliferation of TNBC cells In Vitro and causes TNBC tumors in mice [29].
Viruses are one of the well-known causes of various malignancies in human [30]. Thus far, seven human on co-viruses have been associated with malignancies. These include high-risk types of Human Papilloma Virus (HPV), Hepatitis B and Hepatitis C Viruses (HBV and HCV), Epstein-Barr Virus (EBV) and Kaposi’s Sarcoma-Associated Herpesvirus (KSHV), Merkel Cell Polyomavirus (MCPyV), and Human T-cell Leukemia Virus I (HTLV-1) [31]. The pathophysiology of this carcinogenic potential in viruses affecting humans is not fully understood. It seems, oncogenic viruses share similar characteristics that enable them to cause cancer [32]. In this regard, our analysis provided 12 up- regulated genes with possible relation to viral carcinogenesis in SARS-CoV-2 blood sample, including: H4C8, H2BC7, CDC20, H2BC5, CDK1, H2BC17, H2BC9, CHEK1, EIF2AK2, CCNA1, H2BC8 and CCNA2. For the most part, these genes contribute to viral replication. However, dysregulation in expression of these genes could disrupt cellular processes such as apoptosis and cell-cycle checkpoints that consequently leads to malignancy [4,5]. Cell division cycle 20 (CDC20) is a regulatory protein that interacts with the cell cycle's anaphase-promoting complex/ cyclosome (APC/C) and plays a crucial role in carcinogenesis and cancer progression [33]. Upregulation of CDC20 has been shown in various malignancies including pancreatic ductal adenocarcinoma [34], oral squamous cell carcinoma [35], gastric cancer [36], cervical cancer [37] and hepatocellular carcinoma [38]. In a previous study, CDC20 was implicated as an oncoprotein promoting the proliferation of cancer cells [39]. In addition, targeting CDC20 hinders the mitosis process in cancer cells. This may seem better treatment option than traditional spindle-perturbing medicines for curing cancer [40]. In another study, up-regulation of CDC20 was associated with proliferation of Hepatocellular carcinoma cells and in vitro siRNA-mediated knockdown of CDC20 was shown to restrict HCC progression [41]. Furthermore, the suppression of CDC20 is linked with p21 activation, which in turn impedes the cell cycle through inhibition of G2/M CDKs activity and transcriptional activation of E2F [42,43]. Cellular senescence plays a crucial role in preventing cancer development [44]. Senescence is a protecting factor against cancer development that is induced by mutations in oncogenes or the DNA damage [45,46]. The senescence rate was found to be high in premalignant conditions and low in invasive lesions [47]. Mutations in key oncogenes may lead to senescence which consequently destroys premalignant cells before becoming invasive [48]. Therefore, curbing the process of senescence is a major contributor to invasive cancer development from pre-malignant lesions [49]. It is suggested that the loss of one of the essential senescence effectors such as p53 might be a cause for senescence failure [50]. As a result of this deficiency, the oncogene promotes the cancer growth, inexorably. The immune anti-tumor response elicited by senescent cells is known as "senescence surveillance" [51]. In contrast, in certain instances, stromal cell senescence seems to promote tumor development. This might be due to the proangiogenic effects of particular Senescence-Associated Secretory Phenotype (SASP) components such as Vascular Endothelial Growth Factor (VEGF), or the impact of senescent fibroblasts on the surrounding tumor cells [44]. It is also evident that the "immune senescence" or the aging of the immune system as people become older, may cause the failure of immune surveillance leading to the development of cancer in the elderly. This phenomenon was researched in peripheral blood T cells with telomere shortening and its association with cancer development [52]. There are multiple factors and molecules involved in the senescence signaling. These include various oncogenes and tumor suppressors that may be up or down regulated as part of the carcinogenic process, making the identification of senescence difficult [46]. In SARS-CoV-2 patients, we found 10 up-regulated genes which take part in the senescence which were: CCNB1, FOXM1, CCNB2, CDC25A, CDK1, CHEK1, CCNA1, E2F1, CCNA2 AND MYBL2.
In the aforementioned list, Cell Cycle Checkpoint Kinase 1 (CHEK1) is a conserved protein kinase that acts as a limiting agent in the cell cycle. CHEK1 is generally inactive in the absence of DNA damage, it is mainly activated by ATM in response to double-strand DNA breaks, and its activation involves dimerization and auto phosphorylation [53]. To sum up, CHEK1 is one of the most important speed limiting factors in the cell cycle and its overexpression may promote the development of human malignant tumors, such as lung, bladder, colon, stomach, ovarian, and cervical cancers [54].
Hitherto, there is no convincing evidence that the SARS-CoV-2 is associated with cancer and the results of preliminary studies are not conclusive. Given the fact that SARS-CoV-2 is a complex disease that affects multiple organ systems with unknown long- term complications, this finding raised the question of whether the SARS-CoV-2 infection increases the risk of cancer. Yet, we provided an analysis that shows the up-regulation of some tumor- related genes in the SARS-CoV-2 patients which can be indicative of carcinogenic potential of SARS-CoV-2.
Not applicable
[Crossref][Google Scholar][PubMed].
Citation: Izad M, Ahmadi E, Changaei M, Teymouri A, Alipour B (2023).Cancer Related-Genes Enriched in Peripheral Blood Mononuclear Cells (PBMCs) of COVID-19 Patients. A Bioinformatics Study. Glob J Lif Sci Biol Res. 9:026.
Received: 18-Feb-2023, Manuscript No. GJLSBR-23-21474; Editor assigned: 21-Feb-2023, Pre QC No. GJLSBR-23-21474 (PQ); Reviewed: 08-Mar-2023, QC No. GJLSBR-23-21474; Revised: 15-Mar-2023, Manuscript No. GJLSBR-23-21474 (R); Published: 22-Mar-2023 , DOI: 10.35248/2456-3102.23.9.026
Copyright: © 2023 Izad M, et al. This is an open-access article distributed under the terms of the Creative Commons Attribution License, which permits unrestricted use, distribution, and reproduction in any medium, provided the original author and source are credited.