Research Article - (2023)Volume 12, Issue 4
Impact of Non-Performing Assets on Profitability: A Panel Regression Analysis of Commercial Banks in Nepal
Pramod Dahal*Abstract
This study investigates the impact of Non-Performing Assets (NPA) on the profitability of Nepalese commercial banks using a panel data approach. This study employs panel data of 21 currently functioning commercial banks from 2017/18 to 2021/22, which totals 105 years of observations, to examine the impact of Non-Performing Assets (NPA) on the profitability of Nepalese commercial banks. To investigate the explanatory power of non-performing assets on banks' profitability, the commercial banks' Return on Equity (ROE) is used as the dependent variable, and Non-Performing Assets (NPA), the Laon Loss Provision (LLP) to loan and advances, Loan and Advance to Total Deposit Ratio (LTDR), Return on Investment (ROI), and Capital Adequacy Ratio (CAR) are used as the controlled variables. Results from panel regression, correlation analysis, data stationary, and descriptive statistics are also reported. As suggested by the Hausman test, the Fixed Effect (FE) regression model has been selected as the suitable model. The findings show a significant negative link between non-performing assets and bank profitability. The operational and policy considerations are significantly affected by this conclusion. In order to lessen the negative effects of an increase in non-performing loans and increases in the profitability of commercial banks in Nepal, it emphasises the use of thorough creditworthiness assessments, ongoing credit monitoring, and the establishment of appropriate loan policies in compliance with regulatory requirements.
Keywords
Non-performing assets; Loan loss provision; Loan to deposit; Return on investment; Capital adequacy ratio; Return on equity
Introduction
Banking Sectors are the backbone of a country's economy. Motto of the commercial banks is to mobilize the resources by investing the same in a profitable manner [1]. The financial institutions are supposed to have contribution for overall economic reforms in the country. Though their activities are guided by some social obligations but some profits are always been desirable for maintaining existence [2]. Loans that are not being repaid by borrowers are classified as Non-Performing Assets (NPAs). They can significantly affect a bank's profitability because they lower interest income, raise provisioning costs, and deplete capital. The role of financial institutions is significant for the economic development of a country as they facilitate the smooth flow of credit, enabling investment in productive sectors. As a result, ensuring the stability of the banking sector is important for maintaining a stable financial system. The consistent and efficient functioning of banks is a key factor in securing the financial stability of a nation, as stated by Gnawali [3]. The impact of NPA on financial institutions is significant, as it renders investments worthless and affects profitability due to the need for risk mitigation provisions. This can even jeopardize the existence of a bank. Therefore, timely recovery of both interest and principal is crucial. In India, the concept of “bail-in” during times of banking instability has been widely discussed since the financial resolution and deposit insurance bill was introduced. The government and Reserve Bank of India have regulatory authority to quickly address the large non-performing loans of public sector banks and maintain public confidence in the soundness of commercial banks. Non-Performing Loans (NPLs) can serve as an early warning sign of an impending banking crisis, as they can have adverse effects on a nation’s economic strength by reducing credit growth [4]. A low NPL level indicates a healthy financial system, whereas a high level can suggest a vulnerable financial system. Initially, a high NPL level may affect individual commercial banks, but in the long run, it can damage the entire financial system and the nation’s economy. An increasing trend of NPLs can significantly hamper the efficiency of the banking system, introducing the risk of a banking crisis. This is because NPLs can block interest revenues, reduce investment opportunities, and create liquidity crises in the financial system, leading to bankruptcy and worsening economic activities. Therefore, it is crucial to identify the factors that contribute to NPLs to reduce their level and promote a stable financial system and economy [5]. Commercial banks worldwide are facing a significant problem in recent times, which is the escalating number of Non-Performing Assets (NPAs). These assets are negatively impacting the banks' viability and solvency. Additionally, NPAs are disrupting the lending activity of banks as the failure to recover loan payments and interest undermines the effectiveness of the credit process. Moreover, the banks' profitability is also affected by the non-recovery of loans. Furthermore, banks with a high level of NPAs are required to increase their own funds, such as capital, and establish reserves and provisions to cushion the loan losses. Thus, NPAs have a two-fold impact on the commercial banks' bottom lines. Firstly, the interest applied to such assets is not considered until its actual realization. Secondly, banks must allocate funds from the income earned on performing assets to make provisions for NPAs. Persistently high levels of NPAs can render banks and financial institutions vulnerable, ultimately leading to their failure. This, in turn, undermines the confidence of both domestic and global investors in the banking system [6]. Banking sector reforms in India brought about significant changes to the structure and operations of the industry. While these reforms have been beneficial for the growth of the banking sector, they have also resulted in the emergence of a major issue of Non-Performing Assets (NPAs). NPAs are commonly believed to have a negative impact on banks' profitability, but this notion needs to be statistically tested. This research aims to compare the impact of NPAs on profitability across different types of banks. To achieve this objective, data on various profitability and NPA parameters have been collected over a 20-year period from 1997-98 to 2016-17 and analysed using statistical methods [7]. Non-Performing Assets pose the greatest challenge in the Banking Industry, having negative impacts such as decreased profitability, reduced funds for investment, and decline in other financial indicators. The magnitude of NPAs serves as a key indicator of a bank's health and performance in the equity market. The COVID-19 pandemic has further aggravated the problem of NPAs in the banking industry. The purpose of this paper is to review over 100 studies to understand the difficulties that small and marginal farmers encounter in repaying their loans, specifically those in the agricultural sector. The focus of this research is on the latest scholarly articles published to establish an understanding of the topic and to identify potential areas for future research [8]. Non-Performing Loans, Loan to Deposit Ratio, and education diversity collectively have a significant impact on Return on Assets. Partially, Non-Performing Loans have a substantial negative impact on Return on Assets, while Loan to Deposit Ratio has a considerable positive effect on Return on Assets. The study also reveals that Return on Assets and the impact of loans differ based on geographical variations [9].
Literature Review
Theories related to non-performing assets and profitability
The amount of non-performing assets that banks and other financial institutions hold may have a major impact on their profitability and overall financial performance, according to theories about non-performing assets and profitability. Here are a few theories that may be used to define and support the research's framework.
Credit risk theory
Economist Robert Merton first proposed the Credit Threat Proposition, commonly referred to as the Structural Credit Risk Model, in 1974. During his time at MIT, Merton—a Nobel laureate in economics-developed this approach. The argument makes the case that banks should use prudence when providing credit to borrowers who are likely to default on their loans since doing so increases the credit danger to the bank and could result in a rise in Non-Performing Assets (NPAs). The study emphasises the necessity to safeguard net earnings by providing for NPAs by highlighting the negative impact that NPAs have on the profitability of commercial banks. The investigation also shows that public and private sector banks have different views on the effects of NPAs on profitability, with public sector banks passing more pronounced negative goods. According to the study, private sector banks may be better than average at handling credit risk, which would benefit their profitability.
Real bills doctrine
The Real Bills Doctrine, put forth by British economist Walter Bagehot in the middle of the nineteenth century, calls for the introduction of short-term credit instruments, or "real bills," to stabilise thriftiness by providing a flexible supply of credit supported by tangible products. This philosophy encourages banks to extend credit based on obligations that are likely to be fully repaid, which supports responsible lending practises and tone-regulation. Still, critics claim that the emphasis on short-term loans risks overlooking long-term lucrative aspects and encouraging excessive lending. However, the proposal emphasises the value of cautious lending and preserving reserves to reduce future losses caused by NPAs, supporting responsible lending practises.
Shiftability theory
Henry C. Simons, an economist, created the Shiftability Theory in the 1930s to examine how interest rate changes and NPAs affect bank profitability. It accepts that because businesses are concerned about rising delinquency risks and increasing NPAs, banks may be hesitant to adjust interest rates on existing loans. The proposal emphasises the need for banks to strike a balance between avoiding the hazards of predatory lending practises and maintaining conforming rates in order to stay competitive. Effective threat management encompasses actions like loan restructuring and write-offs, loan portfolio diversification, and credit threat coverage. This idea emphasises how important it is for banks to adapt to shifting request conditions while avoiding NPA-related problems.
Hawley's risk theory of profit
The foundation of Ralph Hawley's threat thesis of profit is the idea that profit is the cost of presuming threat. Ralph Hawley is an American economist. This idea holds that companies can generate greater benefits by taking on more risk. It makes a distinction between financial danger and business threat while highlighting the importance of diversification, research and development, and various funding sources for effective threat management. Fiscal institutions can lessen the negative effects of NPAs on profitability by minimising NPA exposure through efficient threat operation, highlighting the critical role of threat operation in profit maximisation.
Invisible hand theory
The unnoticeable Hand Theory, introduced by Adam Smith, posits that requests operate efficiently and effectively when left to tone- regulate, without inordinate government intervention. It highlights the significance of request effectiveness and how inordinate government hindrance, frequently urged by high NPAs, can hamper banks' effective functioning. The proposition emphasizes the impact of force, demand, interest rates, competition, and the overall state of the frugality on bank profitability. High situations of NPAs can lead to loan write-offs and increased charges, affecting profitability. Competition, still, can drive banks to efficiently manage their loan portfolios, reduce NPAs, and enhance profitability, aligning with the principles of the unnoticeable Hand Theory.
Modern portfolio theory
The Modern Portfolio Theory (MPT), developed by Harry Markowitz in the 1950s, revolutionized portfolio construction and optimization. MPT advocates diversifying portfolios to spread threat across colourful means, allowing for the creation of portfolios that maximize anticipated returns for a given position of threat. By limiting exposure to pitfalls like NPAs and diversifying portfolios, MPT can help alleviate the impact of NPAs, reduce fiscal pitfalls, maximize profitability, and strike a balance between threat and return for both investors and fiscal institutions. It provides a precious frame for enhancing profitability and minimizing NPA exposure.
Empirical review
Numerous studies have been conducted on the effects of Non- Performing Loans (NPLs) on bank profitability, with an emphasis on the banking sectors in Europe, the United Kingdom, the United States, China, and Indonesia. According to NPLs have a major detrimental impact on the profitability of European banks, with lower banks suffering more severely. Additionally, Kvlcm et al. [10] published comparable results for European banks, highlighting the pernicious impact of NPLs on profitability, particularly for smaller banks. According to Lin and Batten [11], who expanded this observation to the US and the UK, NPLs have a detrimental impact on bank profitability in both nations. In the context of China, Jiang and Wang [12], reiterated these findings, highlighting the detrimental effect of NPLs on bank profitability. Wibowo and Haryanto's [13], research in Indonesia supported this idea by demonstrating how NPLs severely reduce bank profitability. Additionally, Yan and Rahman [14], studied UK banks and came to the conclusion that NPLs hurt profitability. Adhikari et al [15], focusing on the Nepalese banking landscape, agreed with the general consensus that NPLs had a negative influence on bank profitability. Panta [16], provided more insight into the causes of NPLs in Nepal, citing Return on Equity and bank size as key influences on NPLs. The study emphasised that while an improved Return on Equity helps appreciably, an increase in NPLs erodes interest income and profitability. In his study of the macroeconomic and bank-specific factors affecting non-performing loans in Nepalese banks, Bhattarai [17], found that macroeconomic variables, such as the real effective exchange rate, had a significant impact on non-performing loans. Increased NPLs were also linked to rising real interest rates Koirala [18], underlined the negative impact of NPLs on the profitability of Nepalese marketable banks over a ten-time period, prompting banks to enhance credit threat operation practices and loan recovery mechanisms to alleviate NPL-related challenges.
Methodology
The research employs correlation and causal comparative research designs to investigate the impact of the Non-Performing Assets (NPA) on Return on Equity, while Loan Loss Provision (LLP), Loan and Advance to Total Deposit (LTDR), Return On Investment (ROI), and Capital Adequacy Ratio (CAR) serve as controlled variables to account for their potential influence on the relationship between profitability and non-performing assets. The study employs panel data encompassing a span of five years for each of the collected samples specifically from 2017/18 to 2021/22, resulting in a total of 105 observations [19].
The data stationary has been tested to each of the variables under the interest using Augmented Dickey-Fuller (ADF) test to avoided the spurious regression results and unreliable statistical inference. Correlation analysis had been adopted to identify the relationship of the return an asset with each of the independent variables consider in the model. The Hausman test has been employed to select the appropriate mode; by comparing the efficiency of the estimators under the assumptions of each two methods: Random Effects and Fixed Method while carrying out the panel regression model. The research results have been generated by using EViews 10 as the econometric analytical tools.
Research framework and functional relationship
The Figure 1, show the method for studying the connection between Non-Performing Assets (NPA) and Return on Equity (ROE) in Nepalese commercial banks is shown in Figure 1. ROE is the dependent variable, and NPA is the independent variable in this framework. To account for their potential impact on the ROE- NPA relationship, many controlled variables are also included, such as the Loan Loss Provision (LLP), Loan and Advances to Total Deposit (LATD), Return on Investment (ROI), and Capital Adequacy Ratio (CAR). Contrary to the study's hypothesis, non- performing assets and Return on Equity are significantly correlated in the context of Nepalese commercial banks [20].

Figure 1: Research framework on independent and dependent variables
Review of available literature suggests the profitability is the function of several of components: NPA, LLP, LTDR, ROI and CAR
Review of available literature suggests the profitability is the function of several of components: NPA, LLP, LTDR, ROI and CARReview of available literature suggests the profitability is the function of several of components: NPA, LLP, LTDR, ROI and CAR
ROE = f (NPA, LLP, LTDR, ROI, CAR)------(1)
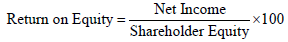
Return on Equity (ROE): A financial statistic called Return on Equity (ROE) measures how effectively profits are generated in comparison to shareholders' equity to determine a company's profitability. ROE is commonly stated as a percentage and is determined by dividing a company's net income by its shareholders' equity. This statistic is important to investors and analysts because it defines the company's profitability and its capacity to maximise shareholder profits [21]. A higher ROE is typically seen favourably since it shows that the business is making more money for every dollar invested by shareholders. It can be formulated as a mathematical expression, represented by the following equation
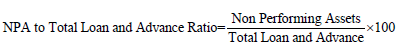
Non-Performing Assets (NPA): The proportion of Non-Performing Assets (NPAs) in a bank's overall loan and advance portfolio acts as a key indicator of the asset quality of that institution. An advanced NPA indicates that a sizable portion of the bank's loans and advances are of poor quality, casting doubt on the bank's financial stability and profitability. As a result, the preferred script is a lower NPA-to-total loan and advance rate, indicating a high-quality and less risky loan portfolio. This rate is calculated by dividing the total amount of non-performing assets by the total amount of loans and advances that the bank currently holds. To evaluate the condition of the bank's loan portfolio and prevent implicit dangers, careful monitoring of the NPA rate is deciding [22]. The calculation of this ratio involves the following formula
Hypothesis (H1): There is a negative and significant relationship between the NPA to loan and advance ratio and return on equity of Nepalese commercial banks.
Loan Loss Provision (LLP) to loan and advance ratio: The ratio showing the relationship between the total loans and advances and the Loan Loss Provision (LLP) denotes the quality of the available resources in the form of loans and advances. The NRB has given marketable banks instructions to organise their loans into separate groups and prepare provisions for potential losses as a result. The loan loss provision protects against unforeseen events resulting from borrower defaults and maintains the institutions' ongoing viability. The addition of non-performing loans to the total loans and advances is indicated by an advanced provision for loan loss [23]. The lower rate, on the other hand, shows effective operation of loans and advances and sweats to handle with implicit loan losses, indicating good quality means in the amount of loans and advances. An advanced rate implies an advanced proportion of Non-Performing Loans (NPL) in the total loan portfolio. The calculation for this ratio is given below

Hypothesis (H2): There is a negative and significant relationship between loan loss provision to loan and advance ratio and return on equity of Nepalese commercial banks.
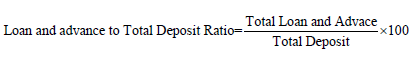
Loan and advance to Total Deposit Ratio (LTDR): Loan and advance to total deposit ratio are a financial ratio that is used to determine how effectively a bank is using its deposits to generate profit through loans and advances. It is calculated by dividing the total amount of loans and advances given out by the bank by the total amount of deposits it holds. The higher the ratio, the more efficiently the bank is using its deposits to earn profits through loans and advances [24]. However, a high ratio can also Tio indicate that the bank may face liquidity issues if many customers request to withdraw their deposits at the same time. Therefore, banks need to strike a balance between profitability and liquidity while maintaining a healthy loan and advance to total deposit ratio. The formula used to determine this ratio is expressed as:
Hypothesis (H3): There is a positive and significant relationship between total loan and advance to total deposit ratio and return on equity of Nepalese commercial banks.
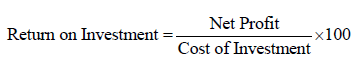
Return on Investment (ROI): The primary financial indicator used to evaluate the viability and effectiveness of an investment or company initiative is the Return on Investment (ROI). It calculates the gain or loss based on the investment's cost and expresses it as a percentage. ROI is a significant tool for financial analysts, firms, and investors since it offers insightful data about the efficiency and profitability of a project or investment. ROI is one of the controlled variables in this research framework, which means that its possible impact on the relationship between Non-Performing Assets (NPA) and Return on Equity (ROE) in Nepalese commercial banks is being considered [25]. The study tries to isolate and examine the specific impact of NPAs on ROE while taking into account other factors that can affect the relationship by using ROI as a controlled variable. The ROI formula is relatively straightforward and is calculated as follows:
Hypothesis (H4): There is a positive and significant relationship between return on investment and return on equity of Nepalese commercial banks.
Capital Adequacy Ratio (CAR): The Capital Adequacy Ratio (CAR) is a measure of a bank's capital in relation to its risk-weighted assets. It is used to assess a bank's ability to absorb potential losses. The CAR is expressed as a percentage of a bank's risk-weighted assets, and is used to determine if a bank has sufficient capital to withstand unexpected losses. It is an important metric used by regulators to monitor the safety and soundness of banks. Banks are required to maintain a minimum CAR as specified by the regulatory authority in their authority. A higher capital adequacy ratio indicates that a bank has a greater cushion to absorb losses, while a lower ratio indicates a higher risk of insolvency [26]. The formula for calculating the Capital Adequacy Ratio (CAR) is:
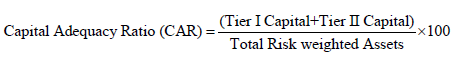
Where,
Tier I Capital=Tier I Capital includes equity, disclosed reserves, and other instruments that cannot be redeemed at the option of the holder.
Tier II Capital=Tier II Capital includes undisclosed reserves, revaluation reserves, general provisions, hybrid debt capital instruments, and subordinated debt.
Total risk weighted assets=Total assets weighted by their respective risk categories.
Hypothesis (H5): There is a positive and significant relationship between capital adequacy ratio and return on equity of Nepalese commercial banks.
Descriptive statistics
The Table 1, presents the summary statistics of six variables observed in the research study conducted on commercial banks operating in Nepal. These variables include Return on Equity (ROE), Non-Performing Assets (NPA), Loan Loss Provision (LLP), Loan and Advances to Total Deposit Ratio (LTDR), Return on Investment (ROI), and Capital Adequacy Ratio (CAR). Each variable's statistical summary is based on 105 data observations.
| Variables | Observations | Mean | Median | Maximum | Minimum | Std. Dev. |
|---|---|---|---|---|---|---|
| ROE | 105 | 13.08 | 12.78 | 23.38 | 6.26 | 3.73 |
| NPA | 105 | 1.41 | 1.11 | 4.75 | 0.03 | 1.07 |
| LLP | 105 | 2.12 | 1.92 | 4.96 | 0.19 | 0.96 |
| LTDR | 105 | 85.87 | 87.53 | 107.01 | 57.45 | 7.53 |
| ROI | 105 | 2.14 | 2.05 | 4.91 | 0.95 | 0.75 |
| CAR | 105 | 14.38 | 13.38 | 27.09 | 11.14 | 3.02 |
Note: ROE- Return on Equity, NPA- Non-Performing Assets, LLP- Laon Loss Provision, LTDR- Loan and Advance to Total Deposit Ratio, ROI- Return on Investment, CAR- Capital Adequacy Ratio
Table 1: Descriptive statistics on central tendency, dispersion, and range of six variables.
Considering Return on Equity (ROE) as a starting point, the mean value is calculated at 13.08, showing an average profitability of the banks' primary lending and investing activities. The median value of 12.78 indicates a little skew towards lower return in the distribution [27]. The ROE varies across banks, from a minimum of 6.26 to a maximum of 23.38, demonstrating variation in profitability. The ROE values' scattering around the mean can be seen by looking at the standard deviation, which is 3.73. When it comes to Non-Performing Assets (NPA), the mean NPA is 1.41, which is the average percentage of loans that have ceased to earn. The distribution is positively biased, as indicated by the median value of 1.11, with numerous banks having comparatively smaller NPAs. The NPA ranges from 0.03 at the lowest end to 4.75 at the highest, representing different levels of credit risk in the bank portfolios. The spread of NPA values from the mean is shown by the standard deviation of 1.07 values.
The average value of Loan Loss Provision (LLP), which represents the sum set aside by banks to cover potential losses from non- performing loans, is 2.12. The median figure of 1.92 indicates that most banks have lower-than-average provisions. The LLP ranges from 0.19 to 4.96, showing variances in the risk-mitigation tactics used by the banks. The degree of dispersion in LLP values is indicated by the standard deviation of 0.96.
As an average value of 85.87, the Loan and Advances to Total Deposit Ratio (LTDR) indicates that banks lend out around 86% of their total deposits. The distribution is slightly favourably skewed, as shown by the median value of 87.53. The LTDR varies between 57.45 and 107.01, demonstrating variations in the volume of lending activity among banks. The spread of LTDR values from the mean can be seen in the standard deviation of 7.53.
ROI, which measures the percentage return earned by investments compared to their cost, has an average value of 2.14. The distribution of ROI values appears to be slightly positively skewed, according to the median value of 2.05. The ROI varies from 0.95 and 4.91, showing that different banks have different levels of investment profitability. The level of dispersion in ROI data is indicated by the standard deviation of 0.75.
The Capital Adequacy Ratio (CAR), which measures the banks' capital in relation to their risk-weighted assets, has an average value of 14.38. According to the median value of 13.38, some institutions continue to maintain a lower CAR. The CAR, which displays variations in banks' levels of capital adequacy, varies from 11.14 to 27.09. The range of CAR values from the mean is shown by the standard deviation of 3.02 values.
These summary statistics give researchers a thorough knowledge of the properties and distribution of data by offering insightful information on the central tendency, dispersion, and range of each variable. The analysis of the connections between these variables and the development of insightful conclusions from the study framework depend heavily on this information.
Data stationary
The Augmented Dickey-Fuller (ADF) test findings for six variables are shown in the Table 2. Return on Equity (ROE), Non-Performing Assets (NPA), Loan Loss Provision (LLP), Loan and Advances to Total Deposit Ratio (LTDR), Return on Investment (ROI), and Capital Adequacy Ratio (CAR). In time series analysis, it is crucial to know if a time series is stationary or not, and the ADF test is frequently employed to make this determination.
| Variables | ADF t-statistic | P-Value | Order of Integration |
|---|---|---|---|
| ROE | -6.3445 | 0.0000* | I (0) |
| NPA | -4.6828 | 0.0002* | I (0) |
| LLP | -5.1835 | 0.0000* | I (0) |
| LTDR | -5.4187 | 0.0001* | I (0) |
| ROI | -6.2408 | 0.0000* | I (0) |
| CAR | -4.2384 | 0.0009* | I (0) |
Critical values for 1%, 5% and 10% are -3.495021, -2.889757 and -2.581890, respectively.
Note: * indicates significant at 1 percent level; ROE- Return on Equity, NPA- Non-Performing Assets, LLP- Laon Loss Provision, LTDR- Loan and Advance to Total Deposit Ratio, ROI- Return on Investment, CAR- Capital Adequacy Ratio
Table 2: The summary result unit root test.
The ADF t-statistic evaluates the strength of the evidence opposing the non-stationarity null hypothesis. We reject the null hypothesis and come to the conclusion that the series is stationary (I(0)) if the t-statistic is more negative than the critical values at the given confidence level. The series is non-stationary and needs differencing to become stationary (I(1) or higher order), but if the t-statistic is less negative than the crucial values, we are unable to reject the null hypothesis[28].
Based to the findings of the ADF test, all six variables-ROE, NPA, LLP, LTDR, ROI, and CAR—are determined to be stationary. This means that these variables can be used directly in their original form for additional research and modelling without the need for differencing to make them acceptable for time series analysis
Correlation coefficients
Table 3 report that the correlation matrix reveals the relationships between six variable: Return on Equity (ROE), Non-Performing Assets (NPA), Loan Loss Provision (LLP), Loan and Advances to Total Deposit Ratio (LTDR), Return on Investment (ROI), and Capital Adequacy Ratio (CAR). Overall, the findings suggest various degrees of associations among the variables. Notably, ROE demonstrates a moderate positive correlation with ROI, indicating that higher returns on investments may be associated with higher Return on Equity’s. Additionally, NPA exhibits a weak negative correlation with ROE, implying that higher non-performing assets might be related to slightly lower Return on Equity’s. Furthermore, there is a strong positive correlation between NPA and LLP, indicating a close relationship between non-performing assets and loan loss provisions. These insights from the correlation matrix offer valuable information for researchers to better understand the potential interdependencies and trends among the variables in the research context of commercial banks operating in Nepal [29].
| Variables | ROE | NPA | LLP | LTDR | ROI | CAR |
|---|---|---|---|---|---|---|
| ROE | 1.0000 | |||||
| ----- | ||||||
| NPA | -0.1649 | 1.0000 | ||||
| 0.0009* | ----- | |||||
| LLP | -0.1445 | 0.7628 | 1.0000 | |||
| 0.0144** | 0* | ----- | ||||
| LTDR | 0.2475 | 0.3103 | 0.3143 | 1.0000 | ||
| 0.0109** | 0.0013* | 0.0011* | ----- | |||
| ROI | 0.4509 | 0.0581 | 0.0484 | -0.3246 | 1.0000 | |
| 0.0000* | 0.0453* | 0.0238** | 0.0007* | ----- | ||
| CAR | 0.2193 | -0.1486 | -0.0487 | -0.0807 | 0.2420 | 1.0000 |
| 0.0246** | 0.0004* | 0.0019* | 0.0429** | 0.0129* | ----- |
Note:(**)indicates signification at 5% level, (*)indicates signification at 1% level; ROE- Return on Equity, NPA- Non-Performing Assets, LLP- Laon Loss Provision, LTDR- Loan and Advance to Total Deposit Ratio, ROI- Return on Investment, CAR- Capital Adequacy Ratio
Table 3: Correlation Coefficients of six variable matrixes.
Panel regression model selection
Table 4 report that correlated random effects-Hausman test was conducted to compare the fixed effects and random effects models in panel data analysis. The test yielded a significant result with a Chi-Square statistic of 11.368315 and a p-value of 0.0445, indicating that the random effects assumption is not valid for the entire model. The subsequent comparison of individual variables revealed that NPA and ROE had significant differences between the fixed effects and random effects models, suggesting that random effects may be appropriate for these variables. However, LLP, LTDR, and CAR did not exhibit significant differences, implying that fixed effects models is suitable for these variables. It should consider using the fixed effects model for NPA and ROE to obtain more robust estimates, while random effects can’t be used for this panel data analysis.
| Variable | Fixed | Random | Var(Diff.) | Prob. |
|---|---|---|---|---|
| NPA | -0.378551 | -0.509662 | 0.034987 | 0.0014* |
| LLP | -0.585673 | -0.1555143 | 0.034462 | 0.0204** |
| LTDR | 0.054263 | -0.062109 | 0.000432 | 0.7058*** |
| ROI | 4.020258 | 3.431665 | 0.032730 | 0.0011* |
| CAR | 0.024843 | 0.036577 | 0.009329 | 0.0033* |
X2 (5) Statistics=11.368315
X (Prob)=0.0445**
Note:*indicates signification at 1 percent level, ** indicates signification at 5 percent level, ***indicates signification at 10 percent level;
Table 4: Hausman test for model selection
Fixed Effects (FE) model specification
In this Fixed effects Model, the individual-specific effects have been absorbed in the intercept term. This means that the model controls for any time-invariant factors that may affect the return on equity for each entity, allowing researchers to focus on the within- entity variation over time and estimate the dynamic relationships between the independent variables (NPA, LLP, LTDR, ROI, and CAR) and the dependent variable (ROE) while accounting for individual-specific heterogeneity. By using the Fixed Effects Model, researchers can obtain more reliable and unbiased estimates of the relationships between the variables and draw meaningful conclusions about the impact of the independent variables on the Return on Equity of commercial banks operating in Nepal.

Where,
ROE=Return On Equity, NPA=Non-performing assets defined as ratio of non-performing assets to total loan and advance of banks, LLP=Loan loss provision defined as loan loss provision to total loan and advance of the banks, TLTD=Ratio of total loan and advance to total deposit of banks, ROI=Return On Investment, CAR=Capital Adequacy Ratio defined as capital fund to risk weighted assets of banks and Eit=Error.
Analysis of non-performing assets on bank’s profitability
The results of a panel data analysis using the Panel Least Squares (PLS) approach are shown in Table 5. In this analysis, the dependent variable, Return on Equity (ROE), was compared to a number of independent variables, including the NPA (Non-Performing Assets Ratio), LLP (Loan Loss Provision Ratio), LTDR (Loan-to-Deposit Ratio), ROI (Return on Investment), and CAR (Capital Adequacy Ratio). The dataset used in this research included information from 21 different cross-sectional units and included 105 observations over a period of five. Numerous significant elements are described in Table 5. ROE's role as the response variable in the regression analysis is confirmed by the "Dependent Variable: ROE" column. Given the panel data structure with observations across time for various cross-sectional units, "Method: Panel Least Squares" denotes that PLS was selected as the suitable approach to estimate the coefficients. The table also includes the analysis date and time, the 105 observations that made up the sample, the five time periods that the data covered, and the 21 cross-sectional units that were used. It should be emphasised that the panel dataset is balanced, meaning that there are an equal number of observations (five in this example) for each cross-sectional unit.
| Variable | Coefficient | Std. Error | t-Statistic | Prob. |
|---|---|---|---|---|
| C (Control variable) | 8.0834 | 5.7515 | 1.4055 | 0.0016* |
| NPA | -0.3786 | 0.4445 | -0.8517 | 0.0040* |
| LLP | -0.5857 | 0.4593 | 1.2752 | 0.0420** |
| LTDR | 0.0543 | 0.0494 | -1.0985 | 0.0327** |
| ROI | 4.0205 | 0.4470 | 8.9948 | 0.0001* |
| CAR | -0.0248 | 0.1631 | 0.1524 | 0.0458** |
ROE= 8.0834-0.3786(NPA)-0.5857(LLP)+0.0543(LTDR)+4.0205(ROI)-0.0248(CAR)+Eit
Note: Number of panel observations=105; R2=77.44% or 0.7744; F- Statistics=10.8523; F- Statistics (Prob)=0.00001*, *indicates signification at 1 percent level, ** indicates signification at 5 percent level; NPA- Non-Performing Assets, LLP- Laon Loss Provision, LTDR- Loan and Advance to Total Deposit Ratio, ROI- Return on Investment, CAR- Capital Adequacy Ratio
Table 5: Fixed effect model
The estimated coefficients, standard errors, t-statistics, and p-values for each independent variable are shown in the table's subsequent section. The estimated effect on ROE for a one-unit change in each relevant independent variable is represented by the coefficients, and the accuracy of these estimations is shown by the standard errors. The t-statistics evaluate each coefficient's statistical significance; larger absolute values denote more statistical significance. The p-values show the likelihood of finding such t-statistics, given that the true coefficient is zero. Results that are statistically significant are implied by lower p-values (which is typically below 0.05). The analysis uses fixed effects (dummy variables) for the cross-sectional units, according to the "Effects Specification" section. Fixed effects take into account particular traits that are particular to each cross- sectional unit and are stable across time. The R-squared value of 0.7744, which is shown in the summary statistics section, shows that around 77.44% of the variance in ROE is explained by the independent variables included in the model. The "Prob (F-statistic)" value of 0.00001 illustrates the extremely low likelihood that such an F-statistic could have been discovered by accident, supporting the regression model's overall statistical significance.
As a result of the panel data analysis, it can be concluded that the NPA and ROI have a statistically significant impact on Return on Equity (ROE). However, there are no statistically significant impacts for the independent variables LLP, LTDR, or CAR. The strong R-squared value and the low F-statistic p-value suggest that the overall model is statistically significant in explaining the variation in ROE.
Results and Discussion
In the context of commercial banks operating in Nepal, the correlation matrix analysis previously presented provides helpful insights into the relationships between six important variables (Return on Equity, Non-Performing Assets, Loan Loss Provision, Loan and Advances to Total Deposit Ratio, Return on Investment, and Capital Adequacy Ratio). Notably, a moderately positive association between Return On Equity (ROE) and Return On Investment (ROI) raises the possibility that stronger investment returns may be linked to higher Return on Equity’s, which would increase profitability as a whole. Additionally, a small negative connection between ROE and NPA suggests that higher non- performing assets may be connected to somewhat lower Return on Equity’s, supporting earlier studies demonstrating the detrimental effect of NPLs on bank profitability. The reveal connection between non-performing assets and the requirement for provisions to cover future losses is further highlighted by the strong positive correlation between NPA and Loan Loss Provision (LLP). Increased NPLs might call for larger loan loss provision allocations, which would have an impact on profitability and financial stability. These results are consistent with the notion that in order to successfully reduce credit risk, elevated NPLs call for increased provisions.
By contrasting the findings with those of earlier studies, the study is further contextualised. In accordance with the results of the correlation analysis between NPA and ROE for Nepalese commercial banks, research by Lin et al [11], Jiang et al [12], Wibowo et al [13], and Yan et al [14], consistently shows that NPLs have a detrimental and statistically significant impact on bank profitability in various countries. Also, Panta's [16], study supports the correlation analysis by showing that NPLs are positively impacted by the Return on Equity while adversely impacted by bank size, and that a rise in NPLs reduces profitability due to a decline in interest income.
These results add to the correlation analysis's findings, which emphasise the weak negative association between ROE and NPA and the somewhat positive correlation between ROE and ROI. A strong positive correlation between NPA and LLP, indicating the relationship between non-performing assets and the requirement for provisions, was also found by Bhattarai's [17], investigation into the macroeconomic and bank-specific factors affecting NPLs in Nepalese commercial banks. The correlation analysis supports the findings of Koirala's [18], study on the effect of NPLs on bank profitability in Nepalese commercial banks, which demonstrate a strong negative impact of NPLs on bank profitability as seen by the negative correlation between NPA and ROE.
These results agree with a number of earlier research. Non- Performing Loans (NPLs) have been found Lin et al [11], Jiang et al [12], Wibowo et al [13], and Yan et al [14], to affect bank profitability negatively and statistically significantly in a number of different nations. Similar findings were made by Adhikari et al. [15], who highlighted the significance of controlling NPLs to preserve financial stability. They found that NPLs have a detrimental impact on bank profitability in Nepal. Likewise Panta [16], discovered that the Return on Equity has a beneficial impact on NPLs, and that a rise in NPLs reduces profitability because interest income is eroded, corroborating the moderately favourable correlation study between ROE and ROI.
Bhattarai [17], further emphasised how macroeconomic conditions and bank-specific factors affect NPLs in Nepalese commercial banks. The results showed that real effective exchange rate, real interest rates charged by banks, and macroeconomic variables had a significant impact on NPLs. The correlation analysis revealed a high positive association between NPA and LLP that is consistent with our study, indicating a connection between non-performing assets and the requirement for provisions. Also supporting the negative correlation between NPA and ROE in the correlation study, Koirala [18], showed a considerable negative impact of NPLs on the profitability of Nepalese commercial banks.
Overall, The panel data study and other studies both show that Non-Performing Loans (NPLs) have a negative influence on bank profitability in Nepalese commercial banks. This emphasises how deciding it is to put in place efficient credit risk management procedures in order to guarantee financial stability and profitability. In the context of Nepal's commercial banks, the correlation matrix analysis offers insightful information about the interconnections between factors, highlighting the relevance of controlling non- performing assets to uphold profitability and financial security. These results can be used by policymakers and bank management to develop strategies for improving the financial performance of Nepalese commercial banks and effectively managing credit risk.
Conclusion
The Hausman test confirmed that it is reasonable to evaluate the association between several financial variables and the profitability of Nepalese commercial banks using a fixed effect approach. The relationship structure analysis of Nepalese commercial banks reveals significant correlations between Return on Equity (ROE), Return on Investment (ROI), and Non-Performing Assets (NPA), which sheds light on the relationships between key variables. These results support earlier studies showing the detrimental effects of Non-Performing Loans (NPLs) on bank profitability by suggesting that higher investment returns may be associated with higher Return on Equity’s, whereas higher non-performing asset levels may result in somewhat lower Return on Equity. Further reinforcing the necessity of making provisions to cover possible losses is the substantial positive link between NPA and Loan Loss Provision (LLP), which highlights this need for good NPL management to reduce credit risk.
Conclusions are given context and support by comparing the results to earlier research, since numerous studies have repeatedly shown that NPLs have a negative influence on bank profitability in a variety of nations. The correlation analysis is further supported by Panta's study, which emphasises the importance of Return on Equity in determining NPLs and their consequent impact on profitability. Bhattarai's research into the macroeconomic and bank-specific factors influencing NPLs is also consistent with the correlation study, highlighting the connection between non-performing assets and the requirement for provisions. The correlation analysis is strengthened by Koirala's study, which demonstrates how negatively NPLs affect bank profitability.
Overall, the results highlight the need of efficient credit risk management procedures for ensuring economic stability and profitability in Nepalese commercial banks. These insights can be used by policymakers and bank management to develop plans for strengthening financial performance and successfully managing credit risk, which would improve the overall stability and success of Nepal's commercial banking industry.
References
- Gauba R. The Indian banking industry: Evolution, transformation and the road ahead. Asia Pacific Bus Rev. 2012;7(25):810-819.
- Puri M. Commercial banks in investment banking conflict of interest or certification Role. J Financ Econ. 1996;40(3):373-401.
- Gnawali, A. Non-performing asset and its effects on profitability of Nepalese commercial banks. J Sci Res.2018;5(9):39-47.
- Smaoui H, Salah IB. Profitability of Islamic banks in the GCC region. J Financ Econ. 2012;5(1):85-102.
- Singh SK, Basuki B, Setiawan R. The effect of non-performing loan on profitability: Empirical evidence from Nepalese commercial banks. J Asian Finance Econ Bus. 2021;8(4):709-716.
- Bhatia A , Dahiya J. A comparative analysis of NPA in priority sector of public sector banks and private sector banks in India. J Risk Financial Manag. 2022;6(17):130-135.
- Gulati PR. Comparative analysis of impact of NPA on profitability. Int J Res Anal Rev. 2018;5(2):1763-1770.
- Agrawal RB, Goyal M. Non-performing assets of banks: A literature reviews. PalArch's J Archaeol Egypt/Egyptol. 2021;18(10):330-340.
- Nugraha NM, Yahya A, Nariswari TT, Salsabila F, Octaviantika IY. Impact of non-performing loans, loan to deposit ratio and education diversity on firm performance of Indonesia banking sectors. Rev Int Geogr Educ Online. 2021;11(3):85-96.
- Kıvılcım C, Öztürk H, Güzel N. The impact of non-performing loans on profitability: An empirical study on European union banking sector. J Account Emerg Econ. 2020;6(4):585-605.
- Lin X, Batten JA. The impact of non-performing loans on bank profitability: Comparative evidence from the US and UK. Res Int Bus Finance. 2019;47:410-424.
- Jiang J, Wang Q. The impact of non-performing loans on Chinese bank profitability. J Asia Pac Econ. 2018;2(1): 28-36.
- Wibowo A, Haryanto AT. The impact of non-performing loans on bank profitability: Evidence from Indonesian commercial banks. J Appl Account. 2018;1(1):1-13.
- Yan L, Rahman MA. Non-performing loans and bank profitability: Evidence from UK. J Risk Financ Manag. 2018;11(3):3-7.
- Adhikari S, Rana S. Impact of non-performing loans on profitability of commercial banks in Nepal. J Bus Soc Sci Res. 2018; 3(2): 25-31.
- Panta B. Non-performing loans and bank profitability: Study of joint venture banks in Nepal. J Appl Sci Res. 2018;42(1):151-166.
- Bhattarai S. Determinants of non-performing loan in Nepalese commercial banks. Econ J Dev Issues. 2017;19(1-2):22-38.
- Koirala NK. Impact of non-performing loans on profitability of commercial banks in Nepal. Asian J Econ Modelling. 2018;6(4):333-342.
- Frank JF, Markowitz HM. Modern portfolio theory and investment analysis. Pearson Education. 2016.
- Friedman M, Schwartz AJ. A monetary history of the United States, 1867-1960. Princeton University Press. 1963.
- Grosvenor JR, Bateman TS, Mottola GR. The impact of non-performing loans on bank profitability in Europe. J Appl Account. 2021;10(7):780-791.
- Hawley, Ralph C. The risk theory of profit. QJEcon. 1893;7(4):459–479.
- Markowitz, Harry M. Portfolio selection. J Finance . 1952;7(1):77-91.
- Merton RC. On the pricing of corporate debt: The risk structure of interest rates. J Finance. 1974;29(2):449-470.
- Nepal rastra bank. Directive on loan loss provisioning. Kathmandu: Nepal rastra bank. 2019.
- Paré G, Alavi M. The theoretical review as a research method. MIS Quarterly. 2008;32(2):241-264.
- Selvarajan B, Vadivalagan G. A study on management of non-performing assets in priority sector reference to Indian bank and public sector banks. Glob J Manag Bus Res. 2013;2(1): 31-42.
- Simons HC. Theory of shiftable interest rates. 1930.
- Smith A. The wealth of nations. Modern Library. 2003.
Author Info
Pramod Dahal*Citation: Dahal P (2023) Impact of Non-Performing Assets on Profitability: A Panel Regression Analysis of Commercial Banks in Nepal. Global J Comm Manage Perspect. 12:047.
Received: 13-Oct-2023, Manuscript No. GJCMP-23-27549; Editor assigned: 16-Oct-2023, Pre QC No. GJCMP-23-27549 (PQ); Reviewed: 31-Oct-2023, QC No. GJCMP-23-27549; Revised: 07-Nov-2023, Manuscript No. GJCMP-23-27549 (R); Published: 15-Nov-2023 , DOI: 10.35248/2319-7285.23.12.047
Copyright: © 2023 Dahal P. This is an open-access article distributed under the terms of the Creative Commons Attribution License, which permits unrestricted use, distribution and reproduction in any medium, provided the original author and source are credited.