Annals and Essences of Dentistry
Open Access
ISSN: 0975-8798, 0976-156X
ISSN: 0975-8798, 0976-156X
Research Article - (2018)Volume 10, Issue 1
Introduction: The purpose of this study is to evaluate the effect of three storage temperatures on microhardness of high and low viscosity bulk-fill materials and compare them with conventional resin-based composite materials.
Materials and method: Six composite resin-based materials were used in this study (TN, TNB, TNF, FZ250, FB and FBF) samples were subdivided into three groups based on the pre-curing storage temperature (5°C, 23°C and 37°C). Light polymerization for each material was performed based on the manufacturer’s recommendation using Bluephase G2 curing unit (Ivoclar Vivadent, Schaan, Liechtenstein) in a high-intensity mode with an irradiance of 1200 mW/cm2. Vickers hardness values of top and the bottom surfaces of each sample were evaluated using (NOVA 130 series, Vickers and Knoop hardness testing instrument) under a 200 g load with a dwell time of 10 sec. Also three indentations with the random distance of 1 mm were taken from the top and the bottom surfaces of each sample and a mean Vickers hardness (VHN) value were calculated (n=18 top and n=18 bottom). The mean bottom/top ratio was calculated by dividing VHN of the bottom surface by VHN of the top surface.
Results: When the tested materials were stored at room temperature (23°C) before testing in the present study, they failed to reach the minimum 80% of the mean bottom to top hardness value ratio except for FZ250 and FBF, where they reached 97.8% and 83.2% respectively. Where in samples that were stored refrigerated at 5°C all the materials have reached the minimum 80% of the mean bottom to top hardness value ratio except for FBF (77.3%) and TB (77.2%). On the other hand, the only material that reached the minimum 80% of the mean bottom to top hardness value ratio when the materials were stored at 37°C was FZ250 (93.5%).
Conclusion: Despite the promising results from this preliminary study, regarding improvement of microhardness with refrigerated composite resins, further research has to be conducted. The enhancement of hardness values associated with preheated composites could be beneficial in countries with warm climate such as Saudi Arabia. The association of precooled composite resin and the use of the LED curing units could be recommended to improve resin-based composite hardness. Further research is needed to evaluate the other mechanical properties and whether or not they are influenced by storage temperature.
<Composite resin; Bulk fill; Light cure; Temperature; Vickers microhardness
Resin-based composite materials have been used in dentistry for many years and they are considered a successful replacement of posterior amalgam restorations [1]. Bulk-fill materials have been introduced to the market with an attempt to overcome some of the disadvantages of 2 mm incremental packing by being able to be placed as a bulk of 4 mm thickness. Currently, two classes of bulk-fill materials are available in the market, viscous and flowable [2,3]. Due to the simplified procedure of bulk fill resin materials, more practitioners are interested in using them [4]. The main advantages of bulk fill resin materials are the increased depth of cure that could be related to their high translucency [5], low polymerization shrinkage stress as a result of modifications in the filler content and organic matrix with the help of advanced technology [6].
Hardness as well as flexural strength and modulus of elasticity, are all improved with increased filler volume in resin-based composite materials. Filler size and weight also affect different composite characteristics [7-10]. Several studies reported improvement of mechanical properties of preheated composites as a result of increased rate of cure and a higher degree of conversion, although the effect of preheating could vary according to the brand of material [11,12]. The high viscosity of packable composites would make marginal adaptation a critical issue, especially if heavily filled materials were used [11]. The viscosity of resin-based composites is temperature dependent and directly related to the handling characteristics of the composite [13-15].
Rheology studies indicated that resin composites, being visco-elastic materials by nature, respond to an increase in external temperature according to the Arrhenius equation, which results in the exponential decrease in their viscosity [15-17]. As a result of decreased paste viscosity, free radicals and propagating polymer chains become more mobile and react to a greater extent, resulting in a complete polymerization reaction and greater crosslinking. The increase in polymerization may lead to improved mechanical properties and increased wear resistance [13,18,19]. Also, preheated composites have a better surface hardness and greater depth of cure [20,21]. The recent literature reported that by increasing the temperature of composite resins with high filler loading before polymerization, the flowability of the composite resin would be enhanced. Moreover, as a result of enhanced flowability the placement and adaptation of composites will be facilitated, thus increasing the durability of the restoration [22,23].
Although storing resin-based materials refrigerated is a common practice to increase their shelf life as recommended by the manufacturers, few studies have investigated the effect of cooling of resin-based composites and their results were controversial. Darnoch et al. reported that the degree of conversion is increased at a 60°C and decrease at 3°C [24]. On the other hand Walter and his group reported that the pre-cooling of the composite resin might decrease the shrinkage [12]. Other studies found no adverse effects from using materials directly from refrigerated storage [25,26]. Lack of literature and the fact that manufacturers usually recommend keeping the composite syringes inside the refrigerator justifies the investigation in the present study on the effect of precooling on the microhardness of the tested composite resins. The purpose of this study is to evaluate the effect of three storage temperatures on microhardness of high and low viscosity bulk-fill materials and compare them with conventional resin-based composite materials. To evaluate the curing efficiency of various resin-based composite materials in the present study, Vickers hardness measurements were performed [27].
Four bulk-fill materials with different viscosities (high and flowable) have been tested, while two nanohybrid composites materials served as control. The specimens were subdivided into three subgroups according to the storage temperature before their use, {subgroup 1=storage at room temperature 23°C, subgroup 2=preheating temperature 37°C and subgroup 3=precooling temperature 5°C}. Materials specifications are presented in table (Table 1). Samples were prepared using a custom-made cylindrical mold with 5 mm diameter and 4 mm height for bulk fill materials and 2 mm height for nanohybrid composites. Thick glass slap was used as a base for the mold and composite resins were backed as one increment. To ensure a smooth surface of the samples with no need for finishing and polishing, a myler strip and a glass slide were placed over the composite resins before curing. Light polymerization for each material was performed based on the manufacturer’s recommendation using Bluephase G2 curing unit (Ivoclar Vivadent, Schaan, Liechtenstein) in a high-intensity mode with an irradiance of 1200 mW/cm2. The distance between the light source and the material was constant throughout the experiment process as 1 mm, which represented the thickness of the glass slide. The samples were dry stored in a light-proof container for 24 h. in an incubator at 37°C to complete the polymerization process before testing.
| Material | Resin | Filler | Photoinitiator | Filler % | Curing time | manufacturer |
|---|---|---|---|---|---|---|
| Filtek bulk fill flowable composite (FBF) | BisGMA, BisEMA, Procry-lat, UDMA | Zirconia or silica, ytterbium trifluoride | Camphoroquinone | 64.5 wt% /42.5% vol | 20 sec | 3M ESPE |
| Tetric N-Flow Bulk fill (TBF) |
monomethacrylates and dimethacrylates | barium glass, ytterbium trifluoride, and copolymers | Ivocerin | 68.2 wt% /46.4 vol%. | 10 sec | Ivoclar Vivadent |
| Tetric N-Ceram (TN) |
BisGMA, UDMA, TEGDMA, EthoxylatedBis-EMA | Barium aluminium silicate glass, ytterbium trifluoride, mixed oxide, Prepolymer | Camphoroquinone | 80-81 wt.%/ 55–57 vol.% | 10 sec | Ivoclar Vivadent |
| Tetric N-Ceram Bulk fill (TB) |
dimethacrylates | barium glass, prepolymer, ytterbium trifluoride and mixed oxide | Ivocerin | 75-77% wt. / 53-55% vol | 10 sec | Ivoclar Vivadent |
| Filtek Bulk fill posterior (FB) |
AUDMA, UDMA and 1, 12-dodecane-DMA | Zirconia/silica, ytterbium trifluoride | Camphoroquinone | 76.5% wt /58.4% vol | 20 sec | 3M ESPE |
| Filtek Z250 (FZ250) |
BIS-GMA, UDMA, Bis-EMA | zirconia/silica | Camphoroquinone | 82% wt / 60% vol | 20 sec | 3M ESPE |
Table 1: Materials specifications.
To determine the microhardness of composite resin materials used in this study, Vickers hardness values of top and the bottom surfaces of each sample were evaluated using (NOVA 130 series, Vickers and Knoop hardness testing instrument) under a 200 g. load and a dwell time of 10 sec. Three indentations with the random distance of 1 mm were taken from the top and the bottom surfaces of each sample and a mean Vickers hardness (VHN) value were calculated (n=18 top and n=18 bottom). The microhardness was determined through measuring the diameters of indentation which was produced by the pyramidal square-base diamond indenter. The mean bottom/top ratio was calculated by dividing VHN of the bottom surface by VHN of the top surface.
Statistical analysis
Data were analyzed using SPSS version 21.0 (IBM Inc., Chicago, USA) statistical software. Descriptive statistics (mean and standard deviation) were used to describe the quantitative variable (measurement of the top, bottom and ratio) of microhardness of resin composite materials. Student’s paired t-test was used to compare between the mean values of top and bottom measurements of each of the six materials. One-way analysis of variance was used to compare the mean values in relation to the categorical variables (six types of materials and three levels of storage temperature), followed by Tukey’s multiple comparison test. General linear model was used to identify the effect of type of material and level of temperature on the top, bottom and ratio measurements. A p-value of <0.05 was used to report the statistical significance of results.
The study has evaluated the effect of three levels of storage temperatures on the measurements (top, bottom and its ratio) of microhardness among the six types of materials which consists of high and low viscosity bulkfill materials and conventional resin-based composite materials. For each material 18 samples were prepared. And, these samples were tested at three levels of storage temperatures (23°C, 5°C and 37°C). The comparison between the top and bottom surfaces mean values of measurements in each of the tested materials (TN, TB, TBF, FZ250, FB and FBF) at each of the three levels of storage temperatures (23°C, 5°C and 37°C) shows highly statistically significant difference in the mean values, where the mean values of top surface measurements are statistically significantly higher than the bottom surface measurements in all the six materials and at all the three levels of storage temperature (Table 2). The comparison of the mean ratio of the bottom and top surface measurements among the six study materials (TN, TB, TBF, FZ250, FB and FBF) shows high statistically significant difference (F=67.342; p<0.0001). The pair wise comparison among the six materials shows the mean ratio values of the two materials; FZ250 and FB to be significantly higher than the three materials (TN, TB and TBF), whereas the mean ratio values of the three materials (TN, TB and TBF) are significantly lower than the other four materials. Moreover, there is no significant difference between the mean ratio values of FBF material and the other two materials (FZ250 and FB) (Table 3).
| Type of Material and level of temperature | Side of measurement | Mean difference |
t-value | p-value | 95% CI for difference of mean | |
|---|---|---|---|---|---|---|
| Top | Bottom | |||||
| 23° TN TB TBF FZ250 FB FBF |
50.40(0.20) 56.41(0.19) 42.27(0.21) 90.39(0.20) 60.55(0.19) 30.49(0.32) |
27.48(0.23) 32.59(0.25) 26.33(0.24) 88.46(0.24) 45.42(0.19) 25.37(0.21) |
22.92 23.82 15.96 1.93 15.13 5.12 |
347.09 391.60 197.76 28.54 277.11 48.52 |
<0.0001 <0.0001 <0.0001 <0.0001 <0.0001 <0.0001 |
22.76,23.04 23.69,23.94 15.76,16.10 1.78,2.06 15.01,15.25 4.90,5.34 |
| 5° TN TB TBF FZ250 FB FBF |
46.37(0.22) 48.42(0.22) 33.49(0.20) 91.57(0.19) 63.61(0.21) 30.52(0.24) |
40.38(0.22) 37.38(0.27) 28.40(0.27) 87.59(0.19) 56.31(0.20) 23.61(0.29) |
5.99 11.04 5.09 3.98 7.30 6.91 |
67.53 135.71 72.85 63.99 105.84 100.48 |
<0.0001 <0.0001 <0.0001 <0.0001 <0.0001 <0.0001 |
5.79,6.17 10.87,11.20 4.94,5.22 3.82,4.11 7.16,7.45 6.77,7.05 |
| 37° TN TB TBF FZ250 FB FBF |
40.56(0.23) 45.55(0.21) 38.44(0.26) 92.40(0.19) 65.31(0.15) 32.33(0.18) |
29.38(0.24) 35.33(0.23) 28.51(0.31) 86.42(0.23) 50.44(0.18) 23.55(0.26) |
11.18 10.22 9.93 5.98 14.87 8.78 |
141.60 131.36 94.98 78.14 236.70 104.74 |
<0.0001 <0.0001 <0.0001 <0.0001 <0.0001 <0.0001 |
11.01,11.34 10.05,10.38 9.71,10.15 5.82,6.14 14.74,15.0 8.60,8.96 |
Table 2: Comparison between the mean values of Top and Bottom side measurements among the six study materials at three levels of temperature.
| Levels of temperature | Ratio (Bottom: Top) Mean(Sd.,) |
F-value | p-value |
|---|---|---|---|
| TN TB TBF FZ250 FB FBF |
0.714(0.13)ǂ 0.708(0.09)ǂ 0.737(0.09)ǂ 0.956(0.02)* 0.802(0.06)* 0.778(0.04) |
67.342 | <0.0001 |
*Significantly higher than other materials; ǂSignificantly lower than other materials
Table 3: Comparison of mean values of Ratio of Bottom: Top sides measurements among the six study materials.
The comparison of the mean ratio of the bottom and top surface measurements among the three levels of storage temperature (23°C, 5°C and 37°C) not considering the type of material, shows highly statistically significant difference (F=43.292, p<0.0001). The pair wise comparison among the three levels of temperature indicates that the mean ratio values are different with each other (Table 4). There is no statistically significant difference in the mean values of top side measurements among the three levels of storage temperature (23°C, 5°C and 37°C) not considering the type of material (F=0.654, p=0.521) (Table 5).
| Levels of temperature | Ratio (Bottom: Top) Mean(Sd.,) |
F-value | p-value |
|---|---|---|---|
| 23° 5° 37° |
0.718(0.15)* 0.851(0.06)* 0.779(0.07)* |
43.292 | <0.0001* |
*Significantly different from each other
Table 4: Comparison of mean values of Ratio of Bottom: Top sides measurements across the three temperature levels of observation.
| Levels of temperature | Top measurements Mean(Sd.,) |
F-value | p-value |
|---|---|---|---|
| 23° 5° 37° |
55.08(18.65) 52.33(20.71) 52.43(20.72) |
0.654 | 0.521 |
Table 5: Comparison of mean values of top sides measurements across the three temperature levels of observation.
Generalized linear model
The comparison of the mean values of top, bottom measurements and its ratio, in each of the six materials (TN, TB,TBF, FZ250, FB and FBF ) across the three levels of storage temperatures 23°C, 5°C and 37°C) and also the comparison of the mean values of the top, the bottom measurements and its ratio at each of the three storage temperatures (23°C, 5°C and 37°C) among the six materials (TN, TB, TBF, FZ250, FB and FBF) shows highly statistically significant difference (Table 6) (Figure 1). The model with the top measurement values along with the six materials and three levels of storage temperatures shows high statistically significant difference (F=155222.26; p<0.001) and also the interaction of levels of storage temperature and type of material (F=5044.15; p<0.0001). This indicates that the top side measurement values are significantly changing across the type of material and the level of storage temperature (Figure 2). Similar pattern was observed with the bottom measurement values (F=154196.87, p<0.0001; F=3230.94, p<0.0001) and also with the ratio values (F=4855.118, p<0.0001; F=2233.33, p<0.0001) (Figure 3).
| Type of Material | Levels of temperature | F-value | p-value | ||
|---|---|---|---|---|---|
| 23° | 5° | 37° | |||
| Top measurement TN TB TBF FZ250 FB FBF |
50.38(0.20) 56.41(0.20) 42.26(0.22) 90.38(0.21) 60.55(0.20) 30.48(0.32) |
46.36(0.22) 48.42(0.23) 33.48(0.20) 91.57(0.19) 63.61(0.22) 30.52(0.25) |
40.56(0.23) 45.55(0.22) 38.43(0.27) 92.39(0.19) 65.31(0.15) 32.33(0.18) |
8961.85 12045.07 6440.43 462.57 2791.45 299.96 |
<0.0001 <0.0001 <0.0001 <0.0001 <0.0001 <0.0001 |
| F-value | 138271.20 | 188869.31 | 204764.31 | ||
| p-value | <0.0001 | <0.0001 | <0.0001 | ||
| Bottom measurement TN TB TBF FZ250 FB FBF |
27.48(0.24) 32.59(0.26) 26.33(0.24) 88.46(0.25) 45.42(0.20) 25.36(0.22) |
40.38(0.23) 37.38(0.28) 28.40(0.28) 87.59(0.19) 56.31(0.20) 23.61(0.23) |
29.38(0.25) 35.32(0.24) 28.51(0.32) 86.41(0.23) 50.43(0.18) 23.54(0.26) |
15068.04 1562.68 338.70 366.03 13829.58 329.78 |
<0.0001 <0.0001 <0.0001 <0.0001 <0.0001 <0.0001 |
| F-value | 192140.99 | 172324.67 | 157636.94 | ||
| p-value | <0.0001 | <0.0001 | <0.0001 | ||
| Ratio(Bottom: Top) TN TB TBF FZ250 FB FBF |
0.545(0.004) 0.577(0.004) 0.623(0.007) 0.978(0.003) 0.750(0.003) 0.832(0.013) |
0.870(0.008) 0.772(0.007) 0.848(0.009) 0.956(0.003) 0.885(0.004) 0.773(0.009) |
0.724(0.007) 0.775(0.007) 0.741(0.010) 0.935(0.004) 0.772(0.004) 0.728(0.010) |
9678.36 6061.98 2727.61 774.95 5773.58 378.14 |
<0.0001 <0.0001 <0.0001 <0.0001 <0.0001 <0.0001 |
| F-value | 9644.03 | 1775.27 | 1863.00 | ||
| p-value | <0.0001 | <0.0001 | <0.0001 | ||
Table 6: Comparison of mean values of Top, Bottom, and Ratio of Bottom: Top sides measurements across the three levels of temperature in each of the six study materials.
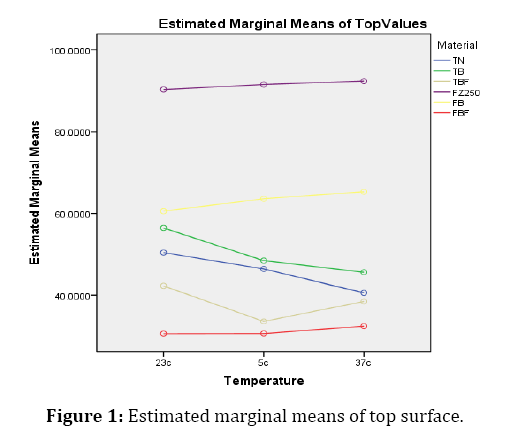
Figure 1: Estimated marginal means of top surface.
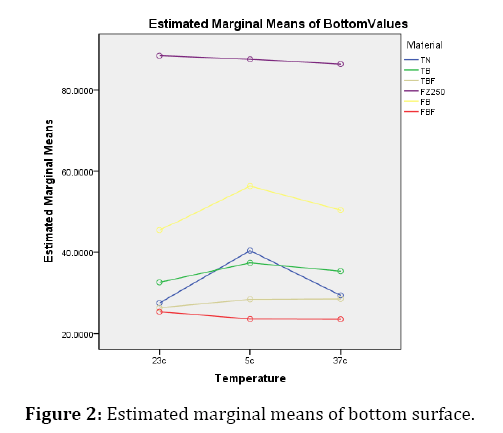
Figure 2: Estimated marginal means of bottom surface.
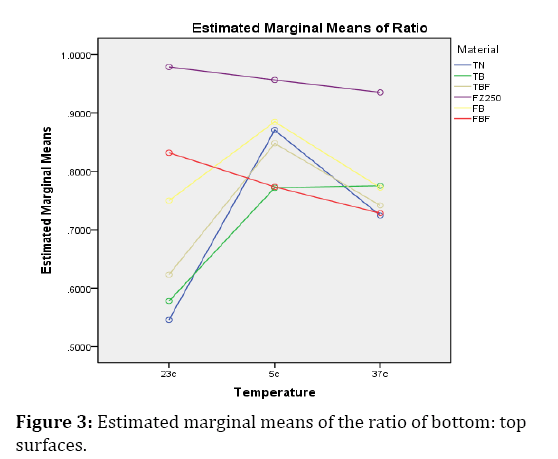
Figure 3: Estimated marginal means of the ratio of bottom: top surfaces.
In the top surface measurement mean values, among the six materials, FZ250 has higher mean values and its value is higher at 37°C when compared with other two levels of storage temperature (Figures 4 and 5). In the bottom surface measurement mean values, FZ250 material has higher mean values and its value is higher at 23°C when compared with other two levels of storage temperature. Moreover, in the ratio measurement mean values, among the six materials, the FZ250 material has higher mean values and its value is higher at 23°C when compared with other two levels of storage temperature. After this material, in the ratio measurement of mean values similar pattern was observed in the FBF and FB materials, but the higher mean ratio values at 5°C with FB material and at 23°C with FBF material. For all other three materials (TN, TB and TBF) the ratio of mean values is higher at 5°C and 37°C storage temperatures when compared with the ratio of mean values at 23°C storage temperature (Figures 6 and 7).
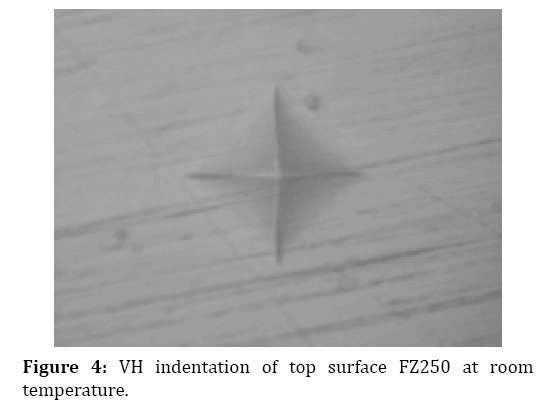
Figure 4: VH indentation of top surface FZ250 at room temperature.
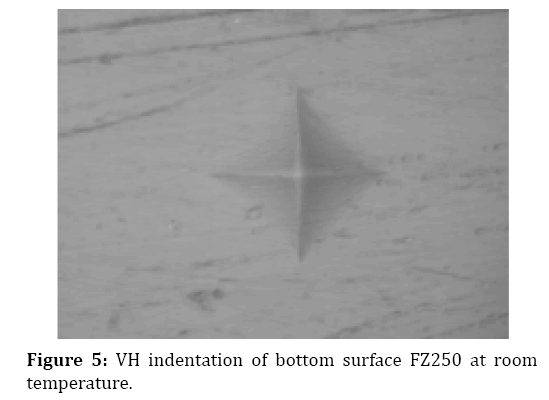
Figure 5: VH indentation of bottom surface FZ250 at room temperature.
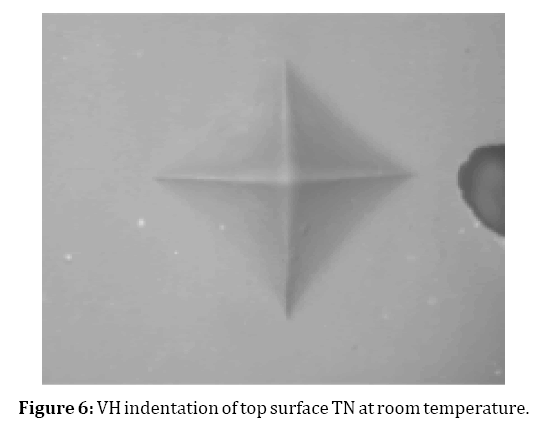
Figure 6: VH indentation of top surface TN at room temperature.
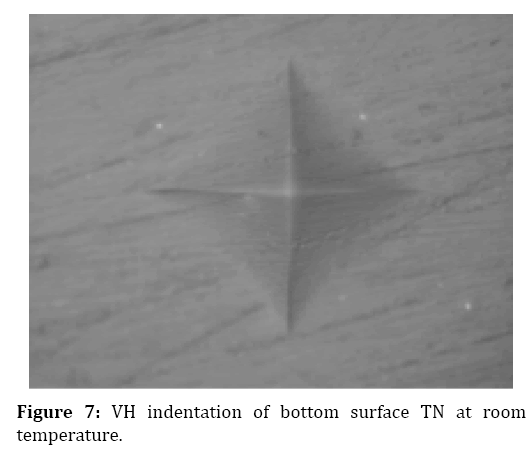
Figure 7: VH indentation of bottom surface TN at room temperature.
Hardness tests are the most frequently used method to evaluate the curing depth and the polymer crosslinking of dental composites [28-33]. As well as the polymer cross-linking of dental composites [34,35]. Additionally, the microhardness data for a specific material provide information on its wear, polishability and abrasive effect on antagonist's teeth [36]. The Vickers microhardness test (VHN) has been commonly used to evaluate the hardness of dental materials, as it is usually used for brittle materials and small film thickness materials. Hardness is often expressed in percentage; the surface hardness is always compared to 100%, which represents the maximum surface hardness. An acceptable curing depth is achieved if bottom hardness corresponds to at least 80% of the top surface hardness [37]. Experience has shown that the simple hardness measures (top and bottom) correspond well to the more thorough hardness profile measurements [38].
When the tested materials were stored at room temperature (23°C), they failed to reach the minimum 80% of the mean bottom to top hardness value ratio except for FZ250 and FBF, where they reached 97.8% and 83.2% respectively. Where in samples that were refrigerated at 5°C all the materials have reached the minimum 80% of the mean bottom to top hardness value ratio except for FBF (77.3%) and TB (77.2%). On the other hand, the only material that reached the minimum 80% of the mean bottom to top hardness value ratio when the materials were stored at 37°C was FZ250 (93.5%). These results are in agreement with a previous study where they showed that at room temperature only 50% to 75% conversion of monomers could be achieved [22,39]. Low monomer conversion rate reduces the mechanical strength of restoration and oxidation of unsaturated monomers may give rise to composite color changes as well as allergic reactions. An increase in the degree of conversion improves surface hardness, flexural strength, modulus, fracture toughness, diametral tensile strength and wear resistance [40].
In the current study, the hardness values of the bottom surface of all tested materials at the different storage temperatures were lower than the hardness values of top surfaces. This can be related to the proximity of top surfaces to the light source and thus receiving higher energy density [41-44]. Another explanation could be due to the insufficiency of curing time that was recommended by the manufacturers and followed in this study. These findings are in agreement with Aldossary et al., results, where the tested samples which were cured for 10 sec, failed to reach the accepted hardness ratio [45]. Others studies had also suggested increasing the polymerization time more than the manufacturers’ recommendation to improve the bulk fill materials performance especially the hardness value [30,46,47]. If we look deeper to the result of the top and bottom hardness values for the materials that failed to reach the 80% hardness ratio at 23°C, we can observe an enhancement in the hardness values at the bottom surfaces of the samples at 5°C and 37°C.
The enhancement in the preheated samples high could be explained by the fact that temperature increase results in increased molecular mobility and thus; the postponement of diffusion, controlled propagation and reaction diffusion controlled termination and auto deceleration, thereby allowing the system to reach higher limiting conversions before verification. Moreover, the temperature increase could result in higher crosslinked polymer network or oligomeric network formation [13,18]. Another explanation could be related to the effect of temperature increase in reducing the rate of the polymerization process before reaching the final degree of conversion; therefore less unreacted residual monomer remains free accordingly it leads better mechanical properties [30,48]. Preheating of resin-based materials prior to their use, will lower their viscosity and help in the handling properties, this will lead to better adaptation to cavity walls [49].
The results of the present study of the mean hardness ratio of bottom and top surface among the three levels of storage temperature (23°C, 5°C and 37°C) not considering the type of material, shows that the best hardness ratio was obtained with the refrigerated samples at 5°C (85.1%), which has a highly statistically significant difference from the other groups (F=43.292, p<0.0001). A possible justification for the improvement of hardness of refrigerated resin composites is that samples were less affected by the heat generated by the curing unit, generating less stress during its polymerization [30]. These results suggest that the refrigeration allowed the composite resin to react similarly to the “soft start polymerization method” because, the low temperature could have proportioned less monomer mobility, decreasing the reaction velocity and providing an extension of the pre-gel phase without decreasing hardness values [50]. Another study demonstrated that cooling before lightcuring did not result in differences in hardness for the composite resins after polymerization. Also, it was observed that the pre-cooling of the composite resin might decrease the shrinkage [12]. It was reported that surface hardness of composite resin material is influenced by resin matrix, filler type and filler loading and degree of conversion [51]. And the results of the current study reflect that where FZ250 has the highest filler content (60% Vol) exhibit the highest mean hardness ratio among all the tested materials at the different storage temperatures.
Within the limitations of this study, the association of pre-cooled composite resin and the use of the LED curing units could be recommended to improve resin-based composite hardness. The enhancement of hardness values associated with preheated composites could be beneficial in countries with warm climate such as Saudi Arabia where this study took place since manufacturers’ recommendations about storing conditions could be less strictly followed.
Preheating and precooling could affect the hardness of the resin composite materials, but it mainly depends on the type of composite resins used. Further research is needed to evaluate the influence of the storage temperature on the other mechanical properties. Despite the promising results from this preliminary study, regarding improvement of microhardness with refrigerated composite resins, further research has to be conducted keeping the molds at 37°C to simulate the intraoral conditions in a better manner.
The author would like to express the deepest appreciation to Professor Nahid Ashri, Department of Periodontics and Community Dentistry, College of Dentistry, King Saud University for her support in executing this study and her advice in writing the manuscript.
Citation: Almozainy M (2018) Influence of storage temperature on vickers microhardness of resin composite, Ann Essence Dent 10:1.
Received: 07-May-2018 Accepted: 25-Jun-2018 Published: 30-Jun-2018 , DOI: 10.24105/aedj.2018.10.1
Copyright: © 2018 Almozainy M. This is an open access article distributed under the terms of the Creative Commons Attribution License, which permits unrestricted use, distribution, and reproduction in any medium, provided the original work is properly cited