Journal of Geology & Geophysics
Open Access
ISSN: 2381-8719
ISSN: 2381-8719
Research Article - (2021)Volume 10, Issue 10
The potential of geophysical methods in the monumental heritage state conservation study is well known. The available geophysical non-destructive techniques can provide important information about the state of preservation of the artefacts without resorting to destructive action. They are extremely useful in identifying unknown or presumed emergencies to better target restoration operations. The advantage of a geophysical survey is that it enables information to be obtained for large volumes of ground that cannot be investigated by direct methods due to cost. Ground-penetrating Radar (GPR) is one of the more used geophysical technique applied in underground exploration. It is a non-destructive methodology that has become a very important tool for the study of the state of degradation of the monumental heritage. GPR is characterised by a wide frequency band ranging from 10 MHz to some GHz and is useful in the localisation of EM discontinuities in the subsurface with high resolution. The paper shows a case history related to the use of the 3D GPR technique to evaluate the state of maintenance of a hypogeum structure located in an urban area. The hypogeum structure was dug in the rock in the medieval period. The structure was used for the transformation of the oil using ancient millstones in stone pushed from mules. It is a structure of great historical value. The hypogeum structure is in danger of falling because of the numerous fractures present in the rock that constitutes the roof of the same structure. The study was made to assist the restoration and valorisation project of the hypogeum. Because of the very narrow thickness of the fractures, special care was needed in the acquisition and processing steps. Although pushed to the limit of the resolution achievable by the available antenna, the study has given quite good results.
GPR; Non-destructive underground exploration; Hypogeum safety
The studied Hypogeum oil mills are located in Torre Santa Susanna (Figure 1) a little village south of Brindisi (south Italy).
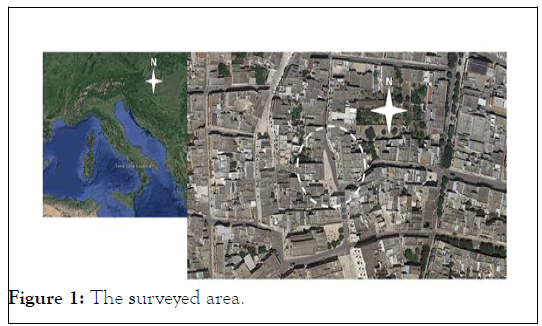
Figure 1: The surveyed area.
It plays an important role in the historical and cultural local architecture, and represents the striking examples of industrial archaeological settlements used for the production of olive oil. It was dug underground and specifically designed to optimize the preservation of olive oil. Its structures are carved into the limestone in the subsoil. From above the mill, the farmer unloaded the olives, which fell into the” trappeto” through a hole located at ground level and into the storeroom (Figure 2).
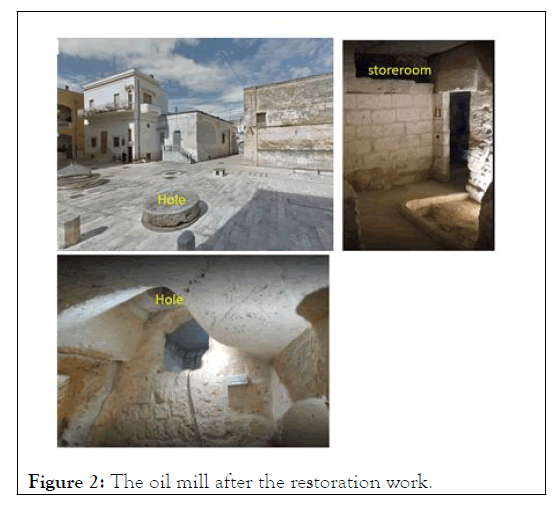
Figure 2: The oil mill after the restoration work.
On either side, there are also, Calabrian and Genoese press and “trappitari” life places (Figure. 3).
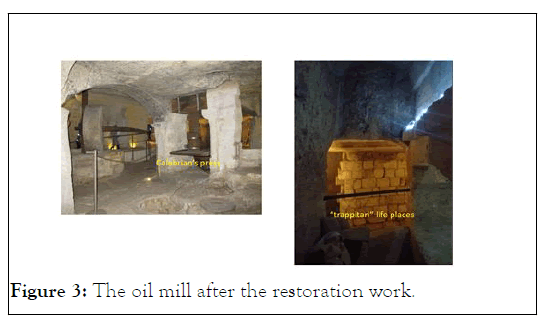
Figure 3: The oil mill after the restoration work.
When the underground oil mill was discovered it was actually in a bad state of conservation (Figure 4). The roof had many fractures and a high degree of humidity which favored the degradation of the rock.
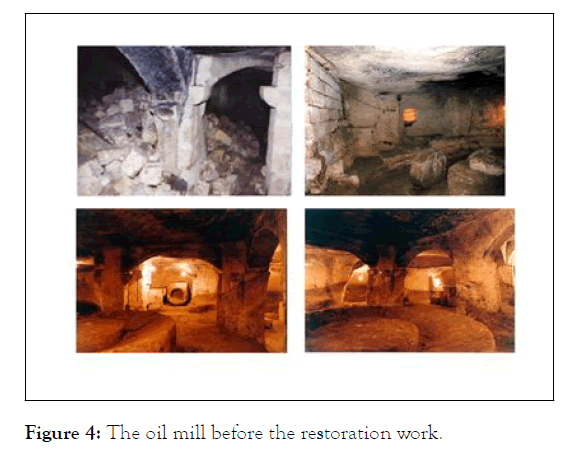
Figure 4: The oil mill before the restoration work.
The restoration was therefore necessary to save this precious testimony of rural life. Starting from these considerations, a preventive diagnosis was necessary to evaluate the state of conservation through the use of non-invasive methodologies.
Since 3D GPR measurements were undertaken. In addition to the diagnostic investigation to identify the state of conservation of the structure, the GPR survey aimed to highlight a possible extension, not yet known, of the underground structure.
3D GPR has emerged as a significant improvement in technology to acquire more efficiently data and provide high resolution for interpretation [1,2,3]. The range of applications, for which 3D GPR data is used, is becoming wide and spans across many domains from utility mapping to evaluate the state of maintenance of building coating and evaluation of karstic cave stability [4]. This paper presents a reel case study of a 3D GPR acquisition in an urban environment to mapping the medieval hypogeum structure and to study the state of maintenance.
GPR profiling is applied to identify the hypogeum structure. Subsequently, the GPR-based radar facies pattern is used to determine the 3D geometry of hypogeum structure. As the last step the electromagnetic (EM) wave velocity was analysed and the dielectric permittivity of rock was esteemed. Using the Topp relationship [5] the volumetric water content was esteemed. Volumetric water content can be used to monitoring the high fracture zones inside the rock that constitute the roof of the hypogeum structure.
GPR data acquisition
GPR survey was carried out with a georadar SIR 3000 and a 270 MHz (centre frequency) antenna, manufactured by Geophysical Survey Systems Inc. (GSSI), with a recording time window of 150 ns. The survey was performed in continuous mode using the following acquisition parameters: i) data word length: 16 bit; ii) samples per scan: 512; iii) gain function: manual. Moreover, to distinguish between reflections from two parallel planes, the planes must be separated by at least one wavelength of the EM energy that is being transmitted through the ground [6]. Taking into account these aspects, we chose a 270 MHz antenna because that gave a good compromise between the best resolution and the best penetration depth required by the survey objectives. We also expected that the depth of the buried features would range from few centimetres to about 3 m.
Due to the presence of the construction site, the investigated area was divided into seven zones labelled A, B,…., G respectively (Figure 5). In the seven zones, data were acquired with parallel profiles spaced 0.25 m.
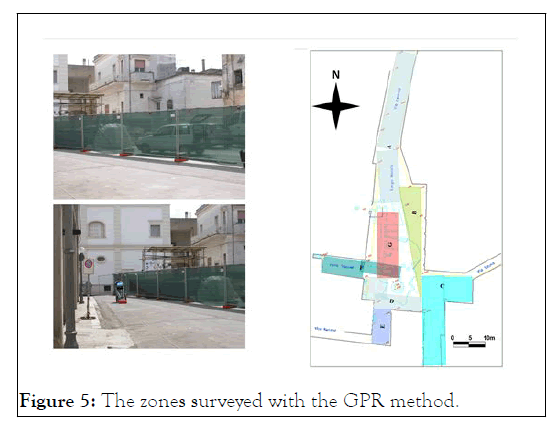
Figure 5: The zones surveyed with the GPR method.
GPR data processing
Despite the GPR acquired raw data are easily viewed in real-time on a computer screen steps of data processing are required for an initial interpretation, with most of the effort directed towards data visualization. On the other hand, depending on the application and target of interest, it may be necessary to perform sophisticated data processing, and many practitioners find that techniques common to seismic reflection, such as migration, can be applied.
The outcome of processing is a cross-section of the subsurface electromagnetic properties, displayed in terms of the TWT. The amount of processing undertaken can range from basic, which allows rapid data output, to the more time-consuming application of algorithms designed for use on a seismic dataset [7], which produce high-quality output [8]. The processing steps usually developed for GPR raw data are done below:
Zero-time adjusts (static shift): During a GPR survey, the first waveform to arrive at the receiver is the airwave. There is a delay in the time of arrival of the first break of the airwave on the radar section due to the length of the cable connecting the antennae and the control unit.
Therefore, one needs to associate zero-time with zero-depth, so any time offset due to instrument recording must be removed before interpretation of the radar image;
Background removal filter BGF (subtract average trace to remove banding): Background noise is a repetitive signal created by slight ringing in the antennae, which produces a coherent banding effect, parallel to the surface wave, across the section. The filter is a simple arithmetic process that sums all the amplitudes of reflections that were recorded at the same time along with a profile and divide by the number of traces. This makes up the resulting composite digital wave, which is an average of all background noise that is then subtracted from the data set;
Gain function: Gain is used to compensating for amplitude variations in the GPR image; early signal arrival times have greater amplitude than later times because these early signals have not travelled as far. The loss of signal amplitude is related to geometric spreading, as well as intrinsic attenuation. Various time-variable gain functions may be applied to equalize the amplitudes of the recorded signals. The most commonly applied is an automatic gain control (AGC) which is a time-varying gain that runs a window of chosen length along each trace, point by point, finding the average amplitude over the length of the window about each point. A gain function is then applied such that the average at each point is made constant along the trace;
Topographic corrections: Surveyed elevation data are used to apply topography to the GPR survey profiles. Firstly, trace windowing is applied to the data to remove all artifacts in the survey that arrived before the time zero arrivals. The actual elevation recorded along the GPR line is then entered into the data-processing package, and the time-zero arrivals are hung from the topographic profile by applying a time shift to each trace;
Frequency filtering: Although GPR data are collected with source and receiver antennae of specified dominant frequency, the recorded signals include a band of frequencies around the dominant frequency component. Frequency filtering is a way of removing unwanted high and/or low frequencies to produce a more interpretable GPR image. High-pass filtering maintains the high frequencies in the signal but removes the low-frequency components. Low-pass filtering does just the opposite, removing high frequencies and retaining the low-frequency components. A combination of these two effects can be achieved with a bandpass filter, where the filter retains all frequencies in the passband but removes the high and low frequencies outside the passband;
Migration: Migration is a processing technique that attempts to correct the fact that energy in the GPR profile image is not necessarily correctly associated with depths below the 2-D survey line. Migration can be seen as an inverse processing step that attempts to correct the geometry of the subsurface in the GPR image concerning the survey geometry. For example, a subsurface scattering point would show up in a GPR image as a hyperbolic-shaped feature. Migration would associate all the energy in the wavelets making up the hyperbolic feature with the point of diffraction, and imaging of the actual earth structure (the heterogeneity represented by the point diffractor) would be recorded more clearly. Migration operators require a good estimate of subsurface electromagnetic- wave velocity to apply the correct adjustments to the GPR image.
GPR data analysis
GPR data analysis could easily scan and map, thus identifying the shape, size, depth, and location of buried anomalies that could be related to the buried features or the conservation degree of monumental heritage. In this way, it is possible to plan an excavation or a restoration intervention. With GPR data acquired using closed spaced profiles, it is possible to map the investigated medium by identifying important reflection events present in 2D data. This could be done by the amplitude slice map analysis that creates maps of differences between reflectedwave amplitudes, both spatially and with depth in a grid.
As is known, the amplitude of the reflected events is directly creatable with the contrast between the dielectric characteristics of the objects present in the investigated medium; therefore, the 3D visualization, by amplitude intervals, of the distribution of the reflected events makes possible the spatial localization of the structures that determine the reflections themselves.
Each time slice corresponds to a layer of the investigated medium, whose depth and thickness depend on the velocity of propagation of the electromagnetic waves in the medium.
An approach for visualizing 3D radar data was proposed by [9] for automatic mine detection. In the first case, after appropriate processing of radar data, a 3D image of the sought diffracting or reflecting object could be easily obtained by i) extraction of a particular complex-signal attribute (trace envelope); ii) thresholding; and iii) 3D contouring using the iso-amplitude surface.
Whereas this was effective in the case of a laboratory experiment, the low signal-noise ratio observed in a real case induced the authors to propose an alternative approach consisting of i) extraction of the most promising complex-signal attributes (trace energy and envelope); ii) three stacks separately performed along each coordinate axis, providing separate 2D results: stacking of the energy along with the depth or z-axis, to obtain a plan view of the high-energy suspected zones; stacking of the trace envelope along x; stacking of the envelope along y; iii) thresholding; iv) 3D rendering of the presumed target by projection in 3D space of the automatically selected thresholded data. As pointed out by the authors, in both cases, threshold calibration is a very delicate task.
Zone A
In this zone data were acquired along 0.25 m-spaced survey lines, using 512 samples per trace, 150ns time range and a manual time-varying gain function. The data were subsequently processed using standard two-dimensional processing techniques using the GPR-Slice Version 7.0 software [9].
The processing flow-chart consists of the following steps: (i) header editing for inserting the geometrical information; (ii) frequency filtering;(iii) manual gain, to adjust the acquisition gain function and enhance the visibility of deeper anomalies; (iv) customized background removal to attenuate the horizontal banding in the deeper part of the sections (ringing); (v) Kirchhoff migration, using a constant average velocity value of 0.07 m/ns.
The GPR profiles that were measured in Zone A (Figure 6) show different reflectors with clear continuity along with the profile. Hyperbolic shaped reflections labelled P at the two-way travel time window between 10 and 15 ns (0.4-0.6 m in-depth) are visible in the radar section.
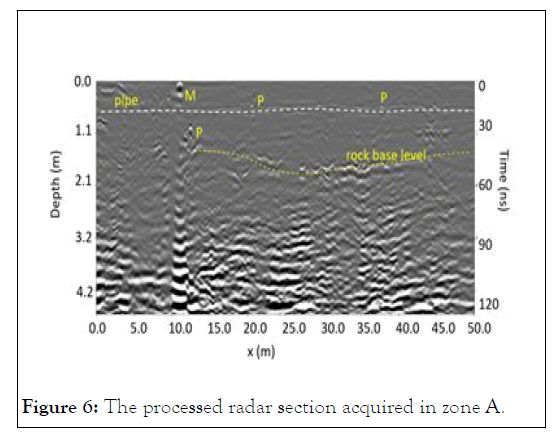
Figure 6: The processed radar section acquired in zone A.
They are interpreted as pipes. The linear horizontal reflection labelled pipe (dashed white line) is the longitudinal pipe. The deeper reflection (dashed yellow line) events due to the rock base. No cavities that could be related to the buried oil mill were detected.
Zone B
Zone B an electromagnetic energy penetration depth of 100–120 ns was found. Figure 7 shows the processed radargram related to one profile acquired in zone B. It shows an interesting hyperbolic reflection event (dashed yellow rectangular) at a twoway travel time window between 50 and 55 ns. Its size is about 9 m and the depth is between 1.8 and 2.0 m. It outlines the cavity [10] related to the oil mill. On each of the GPR records, the (dashed yellow) continuous and slightly undulating reflector appears strong and irregular and reaches a maximum depth below the ground surface ranging from 0.4 to 1.4 m. This is the rock base.
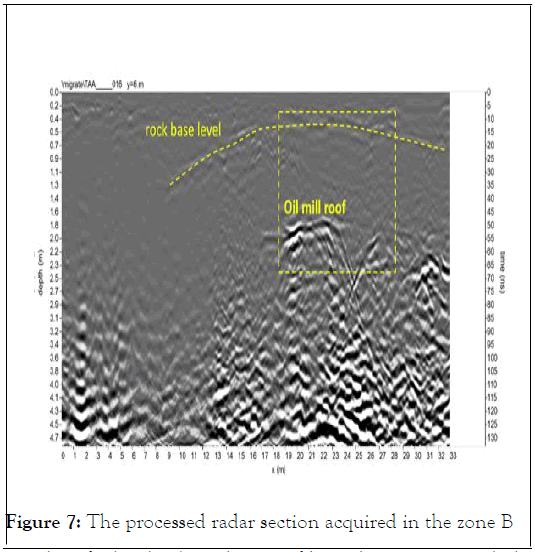
Figure 7: The processed radar section acquired in the zone B
To identify the depth evolution of buried structures, including their size, shape and location, time slices using the overlay analysis [11] were built (Figure 8).
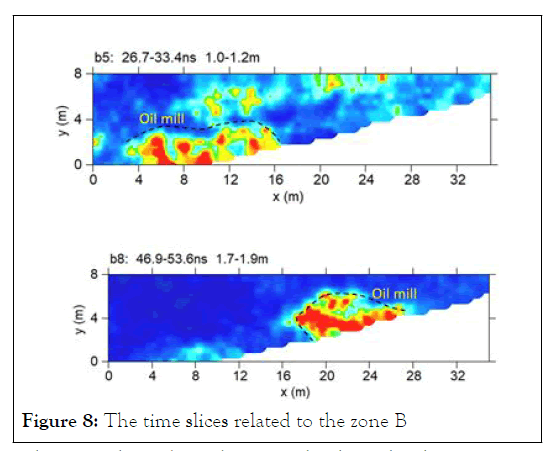
Figure 8: The time slices related to the zone B
The time slices show the normalized amplitude using a range defined by blue as zero and red as 1. In the
slices ranging from 1.0 m to 1.9 m depth, relatively highamplitude alignments (underline by dark dashed line) are visible. These correspond to the oil mill structure.
The spatial relationships between reflections can be visualized in the pseudo-three-dimensional isosurfaces produced from the two-dimensional profiles (Figure. 9). These were produced after Kirchhoff migration and the application of the Hilbert transform, which created a positive-valued envelope of the amplitude of radar reflections. As asserted in [12], the selection of a proper amplitude threshold is crucial in th the iso-surface method because lowering the threshold value increases the visibility of the main anomaly and smaller objects, but also heterogeneity noise. Isosurface renders are displays of surfaces of equal amplitude in a three-dimensional volume. It is possible to display any surface between 0 and 100% of maximum amplitudes in the volume. The 100% surface represents the strongest surface in the volume and 0% isosurface represents the weakest reflector.
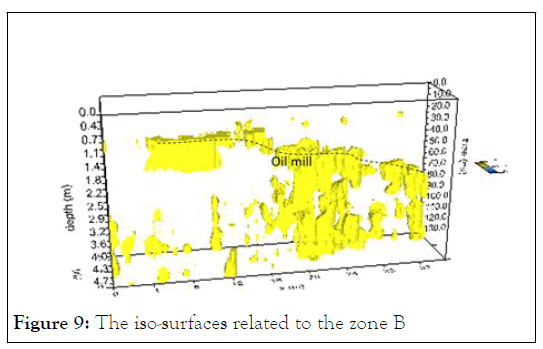
Figure 9: The iso-surfaces related to the zone B
Zone C
In Zone C the GPR data analysis does not highlight particular reflected events that can be brought back to the presence of cavities (Figure 10). It is possible to observe a surface reflex event (P) related to the probable presence of a tube. The deeper reflex event is related to the presence of the bedrock
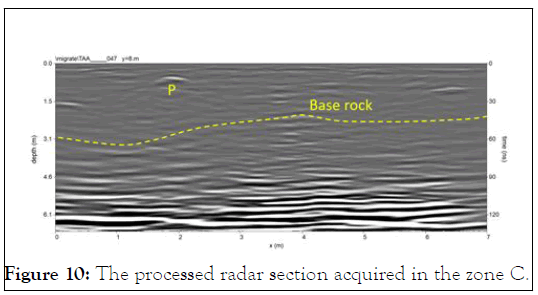
Figure 10: The processed radar section acquired in the zone C.
Zone D
Figure 11 shows the processed radargram related to one profile acquired in zone D. It shows an interesting hyperbolic reflection event (dashed yellow rectangular) at a two-way travel time window between 55 and 70 ns. Its size is about 6 m and the depth is between 1.9 and 2.5 m.
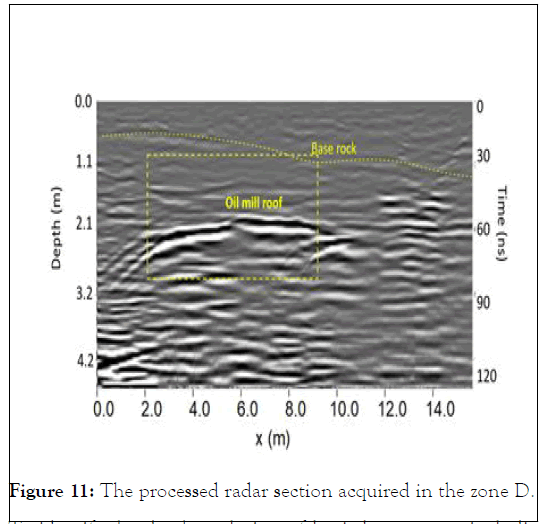
Figure 11: The processed radar section acquired in the zone D.
It outlines the cavity related to the oil mill. On each of the GPR records, the (dashed yellow) continuous and slightly undulating reflector appears strong and irregular and reaches a maximum depth below the ground surface ranging from 0.5 to 1.1 m. This is the rock base.
To identify the depth evolution of buried structures, including their size, shape and location, time slices using the overlay analysis were built (Figure 12).
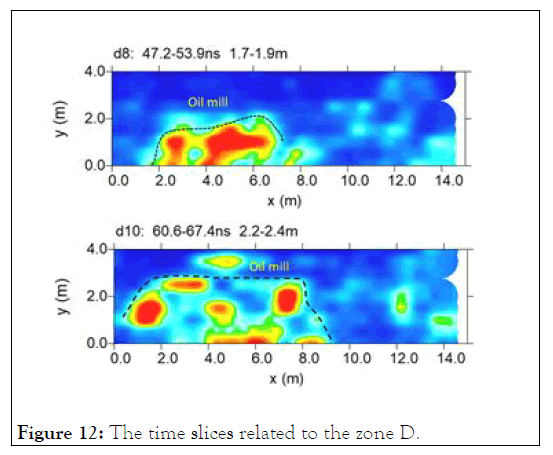
Figure 12: The time slices related to the zone D.
The time slices show the normalized amplitude using a range defined by blue as zero and red as 1. In the slices ranging from 1.7 m to 2.4 m depth, relatively high-amplitude alignments (underline by dark dashed line) are visible. These correspond to the oil mill structure.
The spatial relationships between reflections can be visualized in the pseudo-three-dimensional isosurfaces produced from the two-dimensional profiles (Figure. 13). Figure 13 highlights the shape of the oil mill in zone D.

Figure 13: The iso-surfaces related to the zone D.
Zone E
Figure 14 shows the processed radargram related to one profile acquired in zone E. It shows the reflection event (dashed yellow rectangular) at a two-way travel time window between 25 and 40 ns. Its size is about 8 m and the depth is between 0.7 and 1.0 m. It outlines the cavity related to the oil mill.
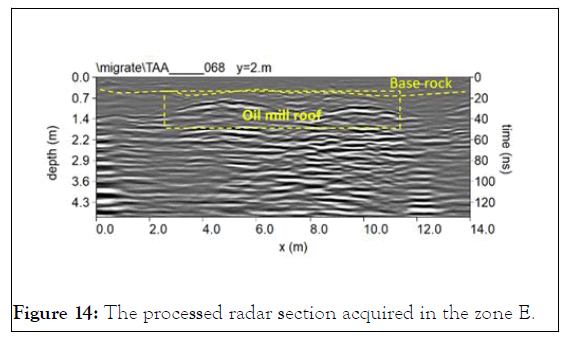
Figure 14: The processed radar section acquired in the zone E.
On each of the GPR records, the (dashed yellow) continuous and slightly undulating reflector appears strong and irregular and reaches a maximum depth below the ground surface ranging from 0.4 to 0.5 m. This is the rock base.
Also in this case time slices using the overlay analysis were built (Figure. 15).
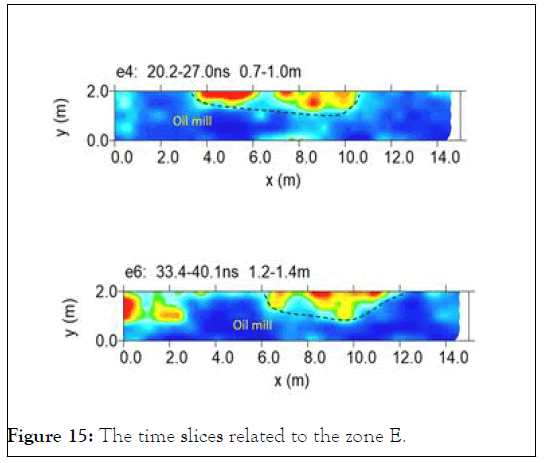
Figure 15: The time slices related to the zone E.
In the slices ranging from 0.7 m to 1.4 m depth, relatively highamplitude alignments (underline by dark dashed line) are visible. These correspond to the oil mill structure.
The spatial relationships between reflections can be visualized in the pseudo-three-dimensional isosurfaces produced from the two-dimensional profiles (Figure. 16). Figure 16 highlights the shape of the oil mill in zone D.
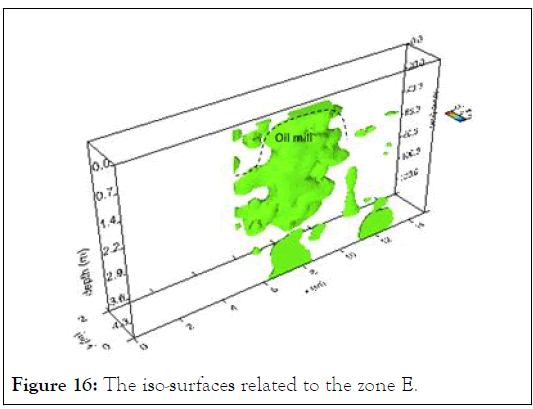
Figure 16: The iso-surfaces related to the zone E.
Zone F
Figure 17 shows the processed radargram related to one profile acquired in zone F. It shows the reflection event (dashed yellow rectangular) at a two-way travel time window between 10 and 50 ns. Its size is about 10 m and the depth is between 0.5 and 1.0 m. It outlines the cavity related to the oil mill. On each of the GPR records, the (dashed yellow) continuous and slightly undulating reflector appears strong and irregular and reaches a maximum depth below the ground surface ranging from 0.4 to 0.5 m. This is the rock base.
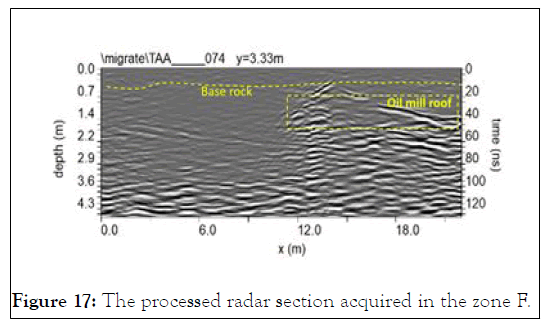
Figure 17: The processed radar section acquired in the zone F.
Also in this case time slices using the overlay analysis were built (Figure 18).
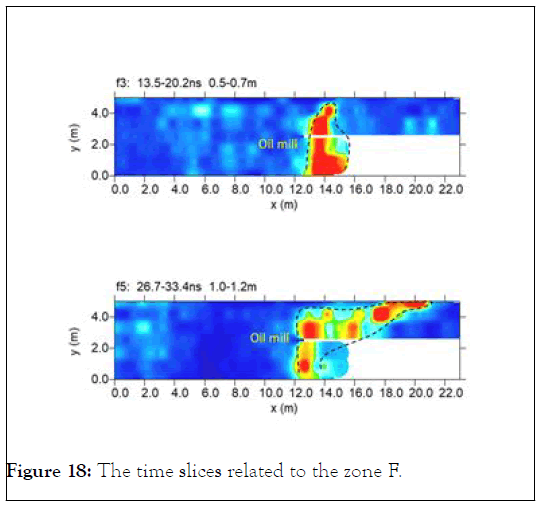
Figure 18: The time slices related to the zone F.
In the slices ranging from 0.5 m to 1.2 m depth, relatively highamplitude alignments (underline by dark dashed line) are visible. These correspond to the oil mill structure.
The spatial relationships between reflections can be visualized in the pseudo-three-dimensional isosurfaces produced from the two-dimensional profiles (Figure 19). Figure 19 highlights the shape of the oil mill in zone F.
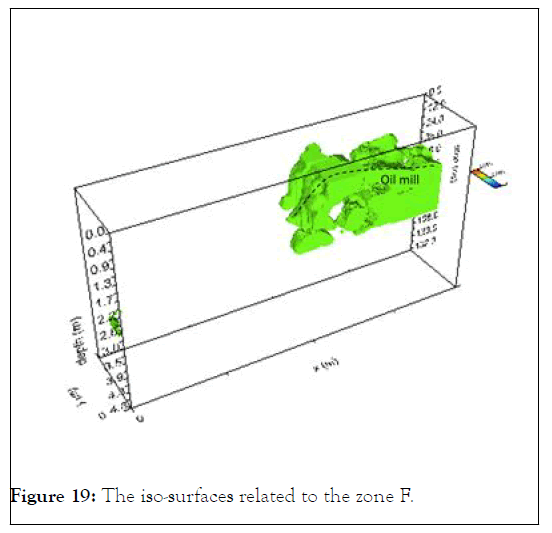
Figure 19: The iso-surfaces related to the zone F.
Zone G
Figure 20 shows the processed radargram related to one profile acquired in zone F. It shows the reflection event (dashed yellow rectangular) at a two-way travel time window between 25 and 50 ns. Its size is about 23 m and the depth is between 0.9 and 1.5 m. It outlines the cavity related to the oil mill. On each of the GPR records, the (dashed yellow) continuous and slightly undulating reflector appears strong and irregular and reaches a maximum depth below the ground surface ranging from 0.4 to 0.5 m. This is the rock base.
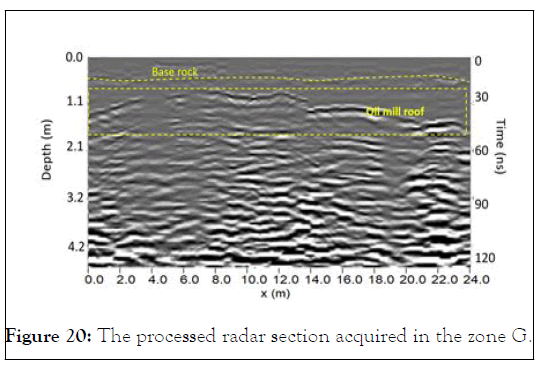
Figure 20: The processed radar section acquired in the zone G.
Also in this case time slices using the overlay analysis were built (Figure 21).
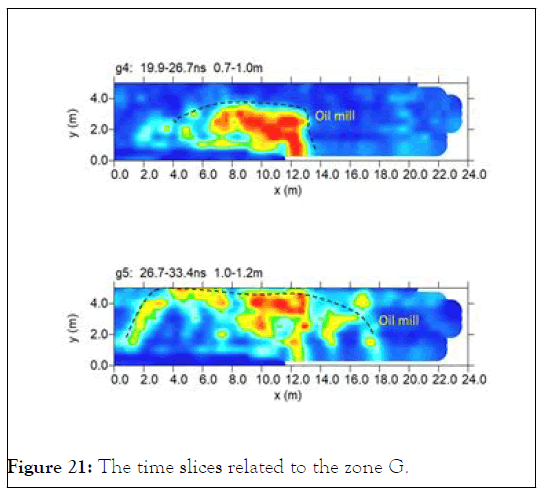
Figure 21: The time slices related to the zone G.
In the slices ranging from 0.7 m to 1.2 m depth, relatively highamplitude alignments (underline by dark dashed line) are visible. These correspond to the oil mill structure.
The spatial relationships between reflections can be visualized in the pseudo-three-dimensional isosurfaces produced from the two-dimensional profiles (Figure. 22). Figure 22 highlights the shape of the oil mill in zone F.
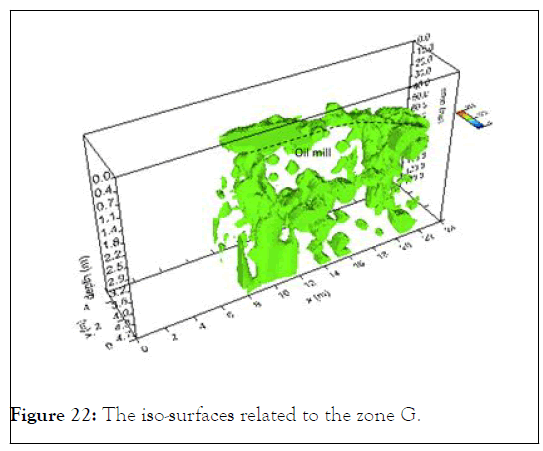
Figure 22: The iso-surfaces related to the zone G.
The fracture degree detection
Fractures can be identified from the properties of their content in terms of nature and size, or quantity of air and water, or other materials, such as clay or terra rossa. This is possible if fractures are sufficiently open and filled with air or water, or with other materials, such as clay or terra rossa, as in the case of karst, allowing for a high amount of radar energy to be backscattered [13] furthermore, radar wave propagation is influenced by both the relative dielectric constant (ε), and the electrical conductivity (σ) of the material through which the radar energy passes (Conyers and Goodman, 1997). Radar signal attenuation is commonly expressed as a function of ε and σ parameters. The simplified relationship taken from [14] provides a rough estimate of the radar signal attenuation in a particular material
The electromagnetic (EM) wave velocity plays an important role in defining the attenuation. For the frequency band of GPR, the velocity of the EM waves propagating in the ground depends on the relative dielectric permittivity of the material by the simplified equation:
Where c is the EM wave velocity in empty space (0.3 m/ns). Hence, ε can be determined directly from EM wave
To evidence, the fracture degree of the rock that constitutes the roof of the oil mill the processing steps was (Leucci and De Giorgi, 2005)
• gain function removal;
• amplitude compensation;
• envelopes.
Due to the amount of diffracted arrivals compared to reflected ones, amplitude envelopes were plotted versus time. To estimate the average radar energy attenuation in the subsoil the relationships (4) and (5) were used. Figure 23 shows the processed data. Where radar energy is diffracted, the fractures are characterised by the presence of small discontinuities, representing karstic voids or recrystallized zones. Therefore, the zones with high back-scattered EM energy (red dashed lines) are related to more fracture carbonatic rock. Furthermore, the processed radar profile (Figure 25) shows that most parts of the fractures have vertical alignment while the other ones have almost horizontal alignment, slightly tilted toward est.
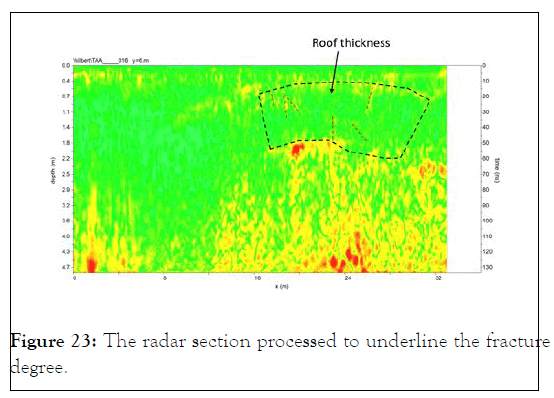
Figure 23:The radar section processed to underline the fracture degree.
The EM-wave velocity plays an important role in defining shallow subsurface water content. Numerous studies have made use of GPR techniques to determine subsurface moisture [15,16,17]. However, since each technique is generally considered individually and is efficient only in a specific context, it is difficult to compare the results because of different field conditions. For the GPR frequency band, the velocity of EM waves propagating in the ground depends on the relative dielectric conductivity of the material; it is given by the simplified equation 5.
Hence,ε can be determined directly from the EM-wave velocity. For pure water,ε is about 80, while for most dry geological material it varies between 4 and 10. If only a small amount of water is contained in the material, the value of ε will increase considerably and, conversely, the EM-wave velocity will decrease significantly. Thus is a good measure of the water content in the ground.
Several formulae have been developed, both theoretically and empirically, to give the dielectric response of heterogeneous mixtures such as water-saturated soils. One such formula is the complex refractive index method (CRIM) equation, which is often used in the interpretation of EM logging data [18]. The major problem with the CRIM formula is that it does not take into account the geometrical information about the internal structure of rocks and the microscopic fluid distribution. This has a significant effect on the dielectric properties of partially saturated rocks [19].
The above restriction may be overcome by using the Hanai– Bruggeman formula [20]. The main problem with the two previous approaches is that it is not possible to derive both the porosity and the water content from the dielectric constant. Therefore, it is not possible to obtain information about the water content without strong a priori assumptions. For this reason, it is preferable to use the wellknown empirical equation, derived by [8]. Relating the dielectric response K of various soil samples (with different degrees of saturation) to their net water-content w. This formula is given by:
w = –5.3×10⁻² + 2.92×11×3.4 + 2) (4-01×5.5 – ) (2-00-6(3)
This equation was found to be nearly independent of soil texture, soil bulk density, temperature and soil salinity [21]. Here, the volumetric water content was determined from the dielectric properties of subsurface material, using the above empirical relationship.
The EM-wave velocity can be estimated from GPR data in several ways [22]; the conventional methods involve common depth-point (CDP) and wide-angle reflection and refraction (WARR) data sets. Both methods require two antennae in separate units and relatively long acquisition times. In the first case, both antennae are simultaneously moved apart on either side of the midpoint of the profile. In the second case, the position of one antenna is fixed while the other is moved along the profile direction.
The EM-wave velocity can be more quickly and easily determined from the reflection profiles acquired in continuous mode, using the characteristic hyperbolic shape of reflection from a point source [23-27].
This is a very common method of velocity estimation and it is based on the phenomenon that a small object reflects EM waves in almost every direction. In the data set, several hyperbolic reflections caused by stones and objects of small dimensions are present, enabling EM wave velocity analysis to be performed. Figure 24 shows an example of velocity analysis performed on the data [28-30].
Figure 24:The EM wave velocity analysis: a) processed radar section; b) 2D EM wave velocity distribution.
Using the Topp equation the volumetric water content in the surveyed area ranging from 16% to 25% (Figure 25).
Figure 25:a) time slice; b) volumetric water content distribution.
GPR technique helped identify the hypogeum structure position in the subsoil. Figure 25a show the extension of the oil mill structure. Is possible to note that the oil mill has an extension greater than that already known. The existence in the radar sections of several hyperbolic anomalies, due to small inhomogeneities, made possible a quick and quite accurate EMwave velocity analysis. This, in turn, made it possible to highlight, in a quantitative way, the water-content variations underground.
The application of this method gives both vertical (in time, hence in depth) and lateral velocity variations from 0.05 m/ns to 0.12 m/ns. An average velocity of 0.085 m/ns is obtained over the survey area. By applying the empirical Topp formula, the average volumetric water content was estimated. Figure 25b shows the plan distribution of the volumetric water content. In this Figure, the volumetric water content is also displayed as a time slice using 0–60 ns time window. The “w” area, which represents lower velocities, probably corresponds to a higher soil water content (about 25%). In these areas is highly probably that the roof of the structure is damaged.
Citation: Leucci G, De Giorgi L, Carrozzo AR (2021) 3D GPR Technique for Assessing Underground Built Heritage Stability. J Geol Geophys. 10:053.
Received: 02-Nov-2021 Accepted: 10-Dec-2021 Published: 22-Dec-2021
Copyright: © 2021 Leucci G, et al. This is an open-access article distributed under the terms of the Creative Commons Attribution License, which permits unrestricted use, distribution, and reproduction in any medium, provided the original author and source are credited.