Journal of Pollution Effects & Control
Open Access
ISSN: 2375-4397
ISSN: 2375-4397
Research Article - (2025)Volume 13, Issue 2
In addressing the challenges of indoor air quality, emphasis has frequently been laid on pollutant gases and air borne particles as compromisers and rarely on the prevalent meteorological conditions, known to cushion invading aerosols and enhance their role as certified indoor health hazards. Using classrooms as proxy for indoor environments, this study compared the seasonal effects of indoor air parameters in urban and rural primary schools. Health and comfort data were collected in rural and urban classrooms during winter and summer seasons. The results showed higher concentrations of gaseous pollutants and particulate matter in winter compared to summer. Comfort parameters showed a marked dissimilarity in both seasons, dew point Temperature (Tdp) recorded 8.51°C in winter compared to 16.1°C in summer in the rural schools. In urban schools Tdp was 9.62°C compared to 13.8°C in summer. Barometric pressure (Bp) was 722 mmHg and 761.1 mmHg for rural and urban schools in winter compared to 718 mmHg and 754.4 mmHg in summer. Relative humidity and carbon dioxide showed similar trends. The study, ceteris paribus deduced, the most stressful times for learners were the winter seasons, when the high levels of comfort parameters (Tdp, Twb, RH and Bp) associate with high concentrations of pollutant gases (CO2 and NO2) and particulate matter (PM2.5, PM5 and PM10) in classrooms.
Comfort parameters; Health parameters; Indoor air quality; Air pollutants; Relative humidity; Nitrogen dioxide
Public attention in the recent past has increasingly focused on indoor air quality in schools because children spend more than 8 hours daily on school premises. These long hours spent in school has come along with a remarkable upsurge in the impact air pollutants have on learner’s health, strikingly higher among children who share analogous environments. The quality of air in school premises, especially in classrooms, is determined by numerous factors including; emissions from indoor sources, the operation of ventilation systems and the penetration of outdoor air pollutants indoors. To these attributes have been added outdoor meteorological conditions known to influence emission, concentration and transportation of pollutants and their eventual penetration indoors [1].
Furthermore, the quality of the micro-climate found in the indoor environment may be technically affected by heating, ventilation and air conditioning equipment, the quality of construction work, the building materials, as well as the operation and maintenance of the building as a unit. Good indoor air quality requires that these aspects are taken into consideration during all the different stages of design; construction and use of the building structure, because some of the problems noted with the quality of indoor air have been traced to the quality of building materials, while some emanate from the actions of occupants and others from the way the buildings are operated and maintained.
These multiple origins of indoor air problems make it important for owners and designers not only to specify the performance of the buildings, but to prove through acceptable procedures that the buildings meet the agreed performance criteria for health [2].
Sampling sites and description
Situated in the Eastern Cape Province of South Africa, the two study sites (East London and Alice) that make up the focus of this study are respectively urban and rural in character. East London is the second largest city of the Province, the city enjoys a coastal location and it is the only city in the country located on a developed river port. The city of East London is highly urbanized and well served with a good network of roads and railway lines crisscrossing the dominantly nucleated settlements that constitute its diverse neighborhoods [3].
Materials and methods of data collection
Data collection was done between the months of August and September in winter and during the months of February to March in summer 2017 and 2018. The sampling periods were during opened weekdays from Monday to Friday. The empty classrooms were sampled either before classes began in the morning or after school when the learners had vacated the classrooms to know the state of the rooms in the absence of learners. A second set of sampling was done during learning sessions while teaching was actively taking place [4]. The instruments emitted very low noise volumes not to disrupt normal classroom functions. Measurements of airborne particulate matter and air quality went on simultaneously because the processes required two instruments that did not interact with one another. Using a portable handheld particle counter for particle sampling required that the instrument be perambulated around each classroom while the indoor air gas monitor for air sampling was fixed at a suspended position in the centre of the classroom. The instrument sucks ambient air into the unit via an internal volume controlled pump at a rate of 1.2 L/min. The gas sampler was placed at desk height of approximately 80 cm above the floor level. The gas sampler is a multi-functional equipment with the capacity to simultaneously report on air flow rates, relative humidity, barometric pressure, diurnal temperatures and pollutant gases in the classroom atmosphere. Samples were grouped into three pools; Comfort parameters (temperature, relative humidity, barometric pressure, air flow rates, oxygen and carbon dioxide), Pollutant gases (Nitrogen dioxide, carbon monoxide, hydrogen sulphate and formaldehyde) and particulate matter [5].
Statistical analysis
Analyses of data was carried out using graphpad instat (version 3.05 for windows 95, graph pad software, San Diego California, USA). ANOVA followed by Tukey’s test for multiple comparisons was performed to determine differences in air quality parameters between urban and rural classrooms and between winter and summer values. A p<0.05 was considered significant. Results were expressed as the mean ± SEM [6].
Comparing oxygen levels in urban and rural classrooms with and without learners in winter and summer
Figure 1 shows that the lowest concentration of oxygen in in rural and urban classrooms with and without learners was 20.5%. The concentration of oxygen was lower in both urban and rural classrooms in both seasons when learners were in class compared to when they were absent. The percentages of O2 was lower in classrooms when learners were in, in winter compared to summer (p<0.001) However, in comparing both seasons, it is evident that the levels of O2 in summer were higher in the urban school classrooms when the learners were both in and out of class compared to the O2 levels in winter in the classrooms [7].
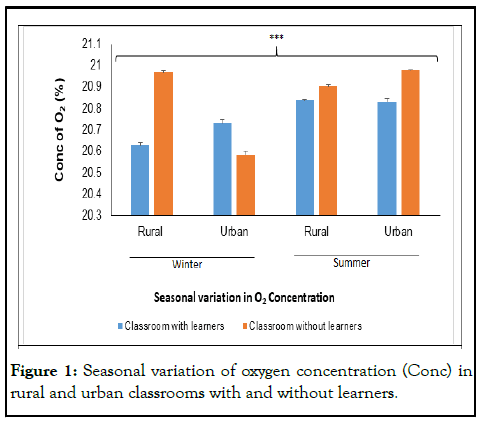
Figure 1: Seasonal variation of oxygen concentration (Conc) in rural and urban classrooms with and without learners.
Comparing urban and rural classroom carbon dioxide levels with and without learners in winter and summer
The CO2 concentrations in the classrooms in summer and winter showed that there was a statistically significant (p<0.001) difference in the rural and urban levels in both winter and summer seasons (Figure 2). Both rural and urban classrooms recorded very high levels of CO2 in winter compared to summer both when learners were in classrooms and when they were not in classrooms. Rural classrooms had the lowest concentrations of CO2 compared to winter and in urban classrooms during the two seasons [8].
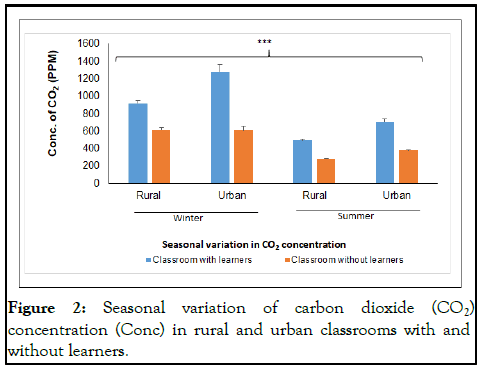
Figure 2: Seasonal variation of carbon dioxide (CO2) concentration (Conc) in rural and urban classrooms with and without learners.
Seasonal variation of nitric oxide concentration in urban and rural classrooms
Nitrogen dioxide was detectable in urban classrooms in both winter and summer though it was not detectable in rural classrooms only in winter. There was no clear NO2 pattern in classrooms. The concentration of NO2 was higher in rural classrooms when learners were absent from classrooms but lower in urban classrooms when learners were present. In summer however, NO2 was detectable when learners were in classroom but not when they were absent (Figure 3).
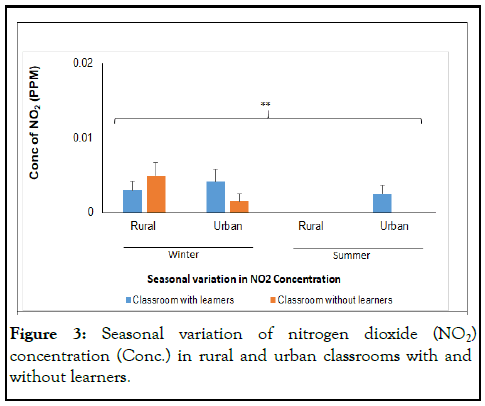
Figure 3: Seasonal variation of nitrogen dioxide (NO2) concentration (Conc.) in rural and urban classrooms with and without learners.
Airflow levels in winter and summer in urban and rural school classrooms
Figure 4 showed that average airflow in the classrooms was relatively stable in both localities during the summer and winter. In summer however, airflow rate was relatively low in urban classrooms when learners were absent [9].
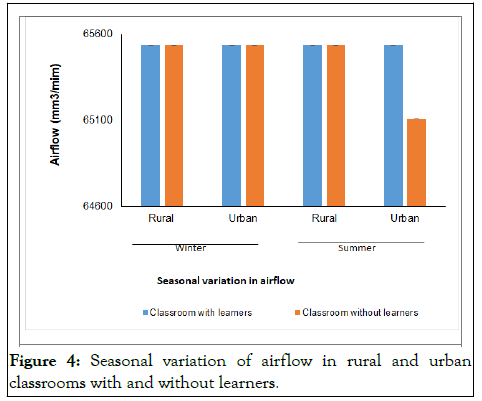
Figure 4: Seasonal variation of airflow in rural and urban classrooms with and without learners.
Seasonal variation in barometric pressure in urban and rural classrooms
Barometric pressure showed seasonal differences between the urban and rural classrooms. In either season, barometric pressure was higher in the urban classrooms compared to the rural classrooms when learners were present and absent from classrooms (Figure 5). This variation were statistically significant p<0.001. In the winter the average barometric pressure was higher in the urban classrooms compared to the rural classrooms. When the learners were in class, the pressure was 753.9 mmHg for urban school classrooms compared to 721.9 mmHg for rural classrooms. When the classrooms were without learners, the barometric average for urban classrooms was 761.1 mmHg compared to 723.6 mmHg for rural school classrooms.
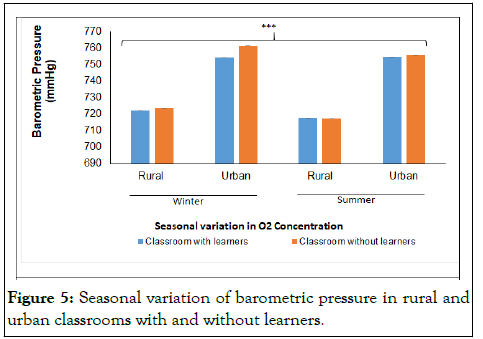
Figure 5: Seasonal variation of barometric pressure in rural and urban classrooms with and without learners.
Relative humidity in urban and rural classroom in winter and summer
The relative humidity in the urban and rural classrooms when learners were in the classrooms and when they were not is depicted in Figure 6. In both winter and summer RH was higher in the rural school classrooms compared to the urban school classrooms.
When the classrooms were with learners, RH was 58.8% which was greater than the average concentration (56.6%) recorded in urban classrooms when the learners were in class. When the classrooms were sampled without learners, RH was still higher (56.6%) in rural classrooms compared to urban classrooms (54.7%). In winter the RH is comparatively higher in the rural classrooms (51.9%) compared to the urban classrooms (48.5%) when the learners are within [10]. When the classrooms are without learners, RH still records higher values in the rural classrooms (52.4%) compared to the urban classrooms where average RH is 43.5%. These difference statistically significant at p<0.001.
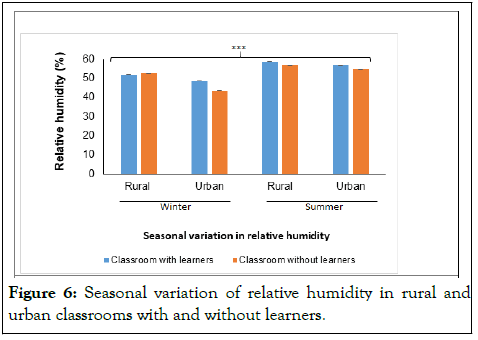
Figure 6: Seasonal variation of relative humidity in rural and urban classrooms with and without learners.
Dew point temperature compared seasonally in urban and rural classrooms
Figure 6 depicts the average dew point temperatures in the classrooms when the learners were in classrooms compared to when they were out of classrooms. In winter Tdp was significantly lower in both rural and urban school classrooms when learners were in and out of classrooms compared to Tdp in summer. Tdp when learners were in classrooms was consistently higher compared to when learners were out of classrooms. The differences were significant with p<0.001 (Figure 7).
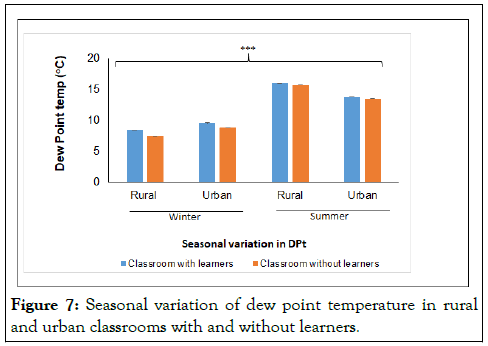
Figure 7: Seasonal variation of dew point temperature in rural and urban classrooms with and without learners.
Wet bulb temperature in urban and rural school classrooms in winter and summer
Figure 8 compares the average wet bulb Temperatures (Twb) in all the classrooms in rural school localities, to the average Twb in all the classrooms in the urban localities. The average Twb for the classes in rural classrooms was 19.1°C, this level was higher than that of the classrooms in the urban areas recorded at 17.4°C when the learners were in class [11]. There was no relative change when the learners were out of class in summer because Twb recorded an average of approximately 19°C in the rural school classrooms compared to 17.2°C in the urban school classrooms without learners in the same season. These percentages completely differed from the percentages of the classrooms with and without learners in winter which were 13°C for Classrooms in rural classrooms compared to 14.5°C in urban classrooms.
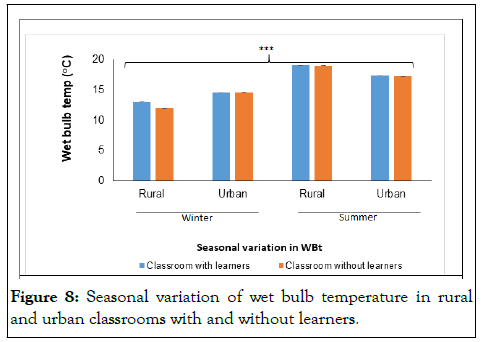
Figure 8: Seasonal variation of wet bulb temperature in rural and urban classrooms with and without learners.
This study compared state of indoor air quality parameters in rural and urban schools in winter and summer. The study revealed that for both comfort and health parameters measured in the rural and urban school environments, an identical trend was exemplified when learners were present and when they were absent from classrooms during winter and summer seasons [12].
The average concentration of oxygen in classrooms as expected, was higher when the learners were out of class compared to when they were in classrooms in both the urban and rural school premises. This could be explained by the fact that, the consumption of clean air increases when demand is high, hence, lowering the quantity available in a defined space when learners are present. Compared to when the classrooms have no learners to exert any demand on available oxygen through the process of respiration. This resulted to a high concentration of O2 in classrooms when learners were absent. The concentration of oxygen in closed environments generally depends on the availability of consuming elements and the greater the number of consuming elements, the faster the depletion. The concentration of carbon dioxide was higher in classrooms when the learners were present compared to when learners were absent in both urban and rural classrooms in the two seasons.
However, there was an inverse relationship between concentrations of oxygen and carbon dioxide. The presence of learners in urban classrooms in winter showed low oxygen concentrations and high carbon dioxide concentration. In summer however, oxygen concentration was higher in summer while carbon dioxide concentrations were lower both when the learners were in classrooms and when they were absent. These results were in agreement with published data showing that a high oxygen concentration in indoor air is accompanied by a low concentration of carbon dioxide and vice-versa. The concentration of carbon dioxide was largely lower in classrooms in summer compared to winter. This was possibly due to the fact that ventilation of classrooms is implemented in summer thus providing an inflow if fresh air rich in oxygen while in winter, the focus is more often on heat conservations which is accompanied by closure of windows and doors resulting in a build-up of the carbon dioxide in classrooms when learners are present. The concentration of carbon dioxide was generally lower in classrooms in summer compared to winter.
This was possibly because the ventilation openings of the classrooms could be made use of in summer, thus providing an inflow of fresh air rich in oxygen. While in winter, the focus is more often on heat conservations which is accompanied by closure of windows and doors resulting in a build-up of carbon dioxide in classrooms when learners were present. The fact that the concentration of carbon dioxide was still high in classrooms when learners were absent can be explained by the fact that classrooms were shut-up and not ventilated in winter even after learners have left the classrooms. The difference may be further explained by the effects of temporality in measurement periods as it is a known fact that gases in mixture in the environment do not maintain a constant pressure [13].
In conclusion, the study revealed that indoor air quality may vary due to temperature changes and the presence or learners in classrooms. The impact was evidently higher in the schools located in the rural areas compared to those in the urban areas. Temperature and relative humidity generally rose and fell with changes in seasons, a warm outdoor invariably would imply a warm indoor. Some of the sun's energy in rural areas is used in the process of photosynthesis, such that, solar energy absorbed over a larger spatial area in rural regions generate greater levels of evapotranspiration responsible for the high humidity levels recorded in school classrooms in these locations. These combined with the wind speed to produce mild temperatures in rural areas compared to urban.
[Crossref] [Google Scholar] [PubMed]
[Crossref] [Google Scholar] [PubMed]
[Crossref] [Google Scholar] [PubMed]
[Crossref] [Google Scholar] [PubMed]
[Crossref] [Google Scholar] [PubMed]
[Crossref] [Google Scholar] [PubMed]
[Crossref] [Google Scholar] [PubMed]
[Crossref] [Google Scholar] [PubMed]
Citation: Chungag A, Nel W, Sewani-Rusike CR, Nkeh-Chungag BN (2024) A Comparison of the Seasonal Variations of Indoor Air Quality in Urban and Rural Primary School Classrooms in the Eastern Cape. J Pollut Eff Cont. 12:405.
Received: 12-Feb-2020, Manuscript No. JPE-24-3355; Editor assigned: 17-Feb-2020, Pre QC No. JPE-24-3355 (PQ); Reviewed: 02-Mar-2020, QC No. JPE-24-3355; Revised: 15-May-2024, Manuscript No. JPE-24-3355 (R); Published: 12-Jun-2024 , DOI: 10.35248/2375-4397.25.13.427
Copyright: © 2024 Chungag A, et al. This is an open-access article distributed under the terms of the Creative Commons Attribution License, which permits unrestricted use, distribution, and reproduction in any medium, provided the original author and source are credited.