Journal of Clinical and Experimental Ophthalmology
Open Access
ISSN: 2155-9570
ISSN: 2155-9570
Research Article - (2023)Volume 14, Issue 5
Purpose: The purpose of this study was to improve a time-saving, cost-effective, and labor-saving method to distinguish the retinal structural vessels, Neovascularization (NV), and Non-Perfusion (NP) areas in Oxygen-Induced Retinopathy (OIR) mice.
Methods: C57BL/6J mice were exposed to hyperoxic conditions (75% ± 2% O2) from Postnatal day 7 (P7) to P12 and then returned to room air to cause maximal retinal Neovascularization (NV). After Retinas were isolated at P17, the retinal whole mounts were successively stained with Griffonia Simplicifolia Lectin (GSL) IB4-594 and GSL IB4-FITC using time- and concentration-controlling staining methods. This improved method only used two staining mediums and no other blocking mediums were required. The images were acquired by fluorescence microscopy and merged by Adobe Photoshop. Retinal neovascularization area and non-perfusion area were measured by Image-Pro Plus.
Results: Staining with the concentration of GSL IB4-594 at 1:100 for 45 minutes could almost completely stain all the neovascular tufts, which could assess the reliable and consistent status of retinal neovascularization. Meanwhile, the OIR retinal whole mounts were stained with the concentration of GSL IB4-FITC at 1:100 overnight followed by GSL IB4-594 staining allowed easy identification and quantification of retinal non-perfusion areas, structural vessels and neovascular tufts in the OIR mice.
Conclusion: The use of a reproducible and quantifiable retinal dual-staining to assess the NV and NP in the OIR model demonstrates the importance of an appropriate staining method that can easily calculate the ratio of NV and NP. Other results such as evaluating the anti-angiogenesis efficacy of bi-specific peptides for anti-angiogenesis obtained using this method suggest enhanced clinical and scientific research value that the ratio of NV and NP can be easily identified by using retinal dual-staining.
Dual-staining; Neovascularization; Non-perfusion; Retinopathy
Retinal Neovascularization (NV) occurs as a complication of ischemic retinopathies, a group of diseases in which retinal vessels are damaged, causing them to close and resulting in retinal ischemia. The most prevalent member of the group is Retinopathy of Prematurity (ROP), diabetic retinopathy and retinal vein occlusions, which are the major causes of vision loss. The pathogenesis and treatments of these diseases are the focus of current research aimed at creating novel treatments that will help reduce pathologic ocular neovascularization [1].
The mouse model of Oxygen-Induced Retinopathy (OIR) as described by Smith, et al. [2]. has long been regarded as the most reproducible and commonly used model for studying retinal NV associated with OIR. Compared to the normal course of superficial vessels forming vascular plexuses towards deeper layers, the degenerative changes of vascular networks exposed to hyperoxic conditions occur [3]. These changes observed in this model are highly consistent with human vascular changes, therefore, has recently been extended to the study of the pathogenesis and the effects of many innovative therapeutic agents on ischemic retinopathies.
The mice with OIR were characterized by the appearance of distinctly avascular perfusion-free areas in the central region of the retina, with branch vessel occlusion and obvious neovascular clusters under a high power microscope, and loss of normal structural vascular network structure [4]. Traditionally GSL IB4-594 immunostaining or Dextran-FITC perfusion are widely used, but the normal retinal vasculature is generally stained along with NV, an observer has to subjectively distinguish NV from structural vessels and manually stroke the NV for measurement. The accurate area measurements of the NV and NP depend solely on the observer’s experience. So, it is a matter of the utmost urgency to establish a modified approach in which observers including the inexperienced can easily detect the differences between the NV, NP and retinal structural vessels. In this study, we present a dual-staining method that allows the differences between new vessels and structural vessels can be measured by image-analysis software directly. GSL IB4-594 and GSL IB4-FITC dual-staining, fluorescence microscopy, and computer image analysis programs can be used to measure the ratio of retinal neovascularization efficiently in whole mount retinal preparations from mice with OIR. Distinguishing the new vessels, structural vessels, and the non-perfusion area is key to investigating the mechanisms of neo-vascular growth and evaluating the feasibility of bi-specific peptide inhibiting more Vascular Endothelial Growth Factor (VEGF) receptors for anti-angiogenesis.
Animals
All C57BL/6J pregnant mice were obtained from the Animal Laboratory of Shanghai Sixth People's Hospital Affiliated to Shanghai Jiao Tong University School of Medicine (Shanghai, China). The Animal Ethics Committee of Shanghai Sixth People's Hospital Affiliated to Shanghai Jiao Tong University School of Medicine approved all experimental protocols. This study adhered to the guidelines of the Animal Care and Use Committee of the National Institutes of Health. All animals were provided food and water ad libitum and lived at room temperature (18°C-25°C) with 50%-60% humidity, noise below 85 decibels, ventilation 8-12 times/hour, and a 12-hour light-dark schedule.
Oxygen-induced retinal neovascularization model
The OIR model was induced as previously reported by Smith, et al. [2]. Briefly, C57BL/6J litters with their nursing mothers were exposed to hyperoxic conditions (75% ± 2% O2) in an oxygen chamber with an oxygen-regulating instrument (BioSpherix Ltd., New York, NY). The mice were exposed for 5 days and then returned to room air for 5 days. The oxygen content was checked twice a day. The mice were euthanized by cervical dislocation at P17, but the pups under 6 g at P17 were not included in the following experiments [5].
Retinal whole mount preparation and immunohistochemistry
The eyes were enucleated quickly, transferred to the 4% phosphate-buffered formalin, and fixed for 2 h at room temperature. Then the retinas were isolated under an operating microscope and then added into 500 µL lectin solution GSL IB4-DyLight 594 (Vector Laboratories, DL-1207-5) with different concentrations. The plate containing the retinas was covered with aluminum foil to protect them from light at different times. The dual-staining method used GSL IB4-DyLight 594 (Vector Laboratories, DL-1207-5) with a concentration of 1:100 for 45 minutes, and then used GSL IB4-Fluorescein (Vector Laboratories, FL-1201-5) with a concentration of 1:100 overnight. Stain retinas in the lectin solution by rocking every 3 minutes at room temperature. Wash the retinas 3 times for 15 minutes, and make 4 incisions to divide every piece of the retina into four equal-sized quadrants.
Imaging and quantification
Images were obtained using the fluorescence microscope (DS-Ri2, Nikon, Tokyo, Japan) and set at magnification × 4 with 15% overlap. Adobe Photoshop was used to produce a merged image of the entire retina separately for further analysis, whose process was File-Auto-Photo merge-Browse-Confirm. The NV area measurement was used Image-Pro Plus 6.0. All data were presented as the mean ± Standard Deviation (SD). Statistical analyses were performed using GraphPad Prism 9.5.0 (GraphPad Software, Boston, MA). Numerical data are presented as the mean and standard deviation. Paired t-tests were used to compare the differences among different stain times within the same group. A p-value of less than 0.05 was considered statistically significant.
Distinction of retinal vessels and neovascularization areas in rough time point
The OIR retinal wholemounts were stained with GSL IB4-594 for 0.5 h, 1 h, 2 h, 4 h and 6 h respectively. A small amount of neovascularization could be observed after 0.5 hours of staining as shown in Figure 1A. After 1 hour of staining, neovascularization areas increased, and retinal structure vessels were faintly visible as shown in Figure 1B. After 2 h to 6 h of staining, neovascularization areas no longer increased, but more and more retinal structural vessels were counted as neovascular tufts by Image-Pro Plus as shown in Figures 1C-1E. Our results showed the density of NV area between 0.5 h and 1 h increased significantly (P<0.0001). Meanwhile, the NV area from 1 h, 2 h, and 4 h to 6 h no longer increased (P>0.05, P1 h-P2 h=0.3144, P2 h-P4 h=0.3624, P4 h-P6 h=0.2765), which revealed the accuracy of NV areas was influenced by structural vessels stained at longer time point. As the staining time increased, the fluorescent signal could increase as well up to a certain length of staining time point, which may be probably between 0.5 h and 1 h as shown in Figure1F. This is because the area of neovascularization can be measured more accurately during this time period to exclude statistical errors due to interference from structural vessels (Figures 1A-1F).
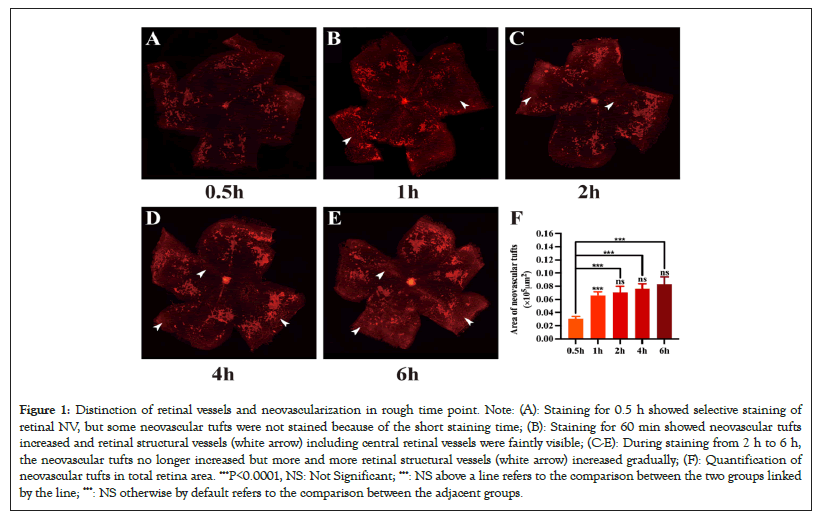
Figure 1: Distinction of retinal vessels and neovascularization in rough time point. Note: (A): Staining for 0.5 h showed selective staining of retinal NV, but some neovascular tufts were not stained because of the short staining time; (B): Staining for 60 min showed neovascular tufts increased and retinal structural vessels (white arrow) including central retinal vessels were faintly visible; (C-E): During staining from 2 h to 6 h, the neovascular tufts no longer increased but more and more retinal structural vessels (white arrow) increased gradually; (F): Quantification of neovascular tufts in total retina area. ***P<0.0001, NS: Not Significant; ***: NS above a line refers to the comparison between the two groups linked by the line; ***: NS otherwise by default refers to the comparison between the adjacent groups.
C57BL/6J mice were subjected to a 75% hyperoxia condition before being brought back to room air. At P17, the eyeballs were immersed in 4% phosphate-buffered formalin for 2 hours. Retinas were incubated with GSL IB4-594 with the same concentration for 0.5 h, 1 h, 2 h, 4 h and 6 h. Retinas were flat-mounted and examined by fluorescence microscopy.
Identification of the optimal staining time of NV
The above results indicated the optimal staining time point of NV was between 30 min and 60 min, so we chose 5 time points within 30 min-60 min as shown in Figures 2A-2E. As shown in Figure 2F, the NV area of staining for 30 min, 40 min and 45 min increased statistically (P<0.05, P30 min-P40 min=0.0051, P40 min-P45 min=0.0011). Our results also showed there was no statistical difference in neovascular tufts density among 45 min, 50 min, and 60 min (P>0.05, P45 min-P50 min=0.7699, P50 min-P60 min=0.2579), which revealed that the neovascular clusters had all been stained with GSL IB4-594 after 45 min. Considering the time saving, 45 min was selected as the staining time for the following experiments (Figures 2A-2F).
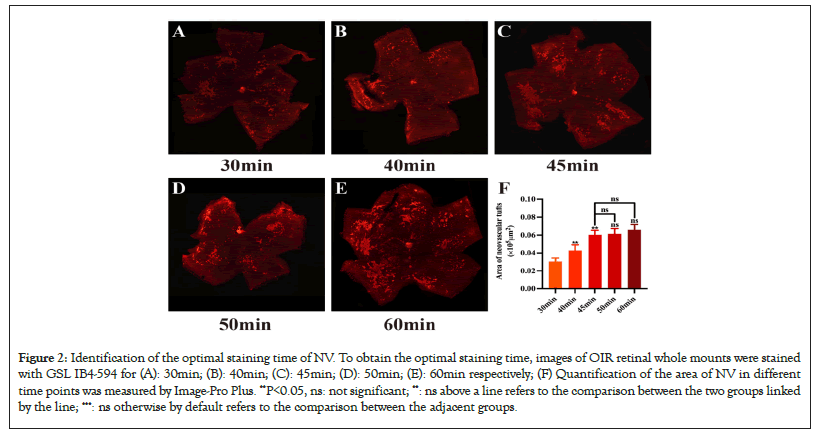
Figure 2: Identification of the optimal staining time of NV. To obtain the optimal staining time, images of OIR retinal whole mounts were stained with GSL IB4-594 for (A): 30min; (B): 40min; (C): 45min; (D): 50min; (E): 60min respectively; (F) Quantification of the area of NV in different time points was measured by Image-Pro Plus. **P<0.05, ns: not significant; **: ns above a line refers to the comparison between the two groups linked by the line; ***: ns otherwise by default refers to the comparison between the adjacent groups.
To obtain the optimal staining time, images of OIR retinal wholemounts were stained with GSL IB4-594 for 30 min, 40 min, 45 min, 50 min and 60 min respectively. Quantification of the area of NV in different time points was measured by Image-Pro Plus. Ordinary one-way ANOVA followed by the t-test was performed. Data are presented as mean ± Standard Error of the Mean (SEM) (number of mice, n=5) (Figure 3A-3C).
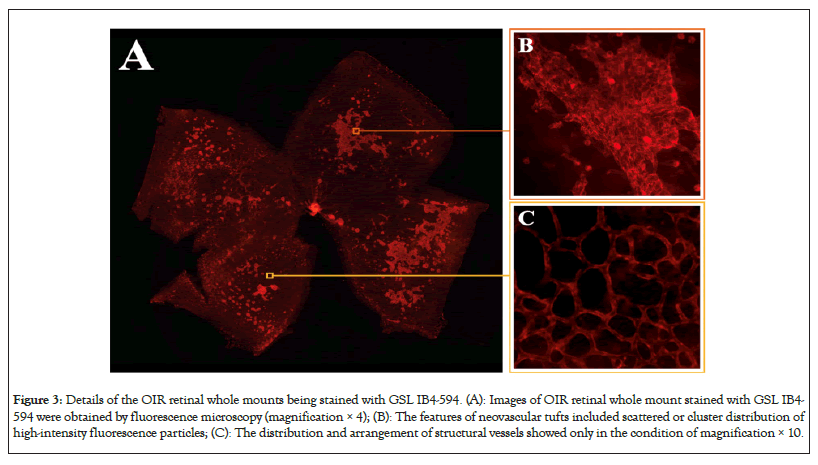
Figure 3: Details of the OIR retinal whole mounts being stained with GSL IB4-594. (A): Images of OIR retinal whole mount stained with GSL IB4- 594 were obtained by fluorescence microscopy (magnification × 4); (B): The features of neovascular tufts included scattered or cluster distribution of high-intensity fluorescence particles; (C): The distribution and arrangement of structural vessels showed only in the condition of magnification × 10.
Identification of the optimal staining concentration of NV
The OIR retinal wholemounts were stained with GSL IB4-594 at different concentrations of 1:50, 1:80, 1:100, and 1:200 for 45 minutes. These retinas were then stained with GSL IB4-FITC at different concentrations of 1:50, 1:80, 1:100, and 1:200 overnight in order to make all the structural vessels marked. Our results showed that concentrations of 1:50 as shown in Figures 4A and 4B and 1:80 as shown in Figures 4D and 4E for 45 minutes made the structural vessels and neovascular tufts stained. But the fluorescence intensity of structural vessels was faint with a concentration of 1:200 as shown in Figures 4J and 4K for 45 minutes. So, staining with the concentration of GSL IB4-594 at 1:100 for 45 minutes and GSL IB4-FITC at 1:100 overnight could distinguish NV and NP from structural vessels (Figures 4A-4L).
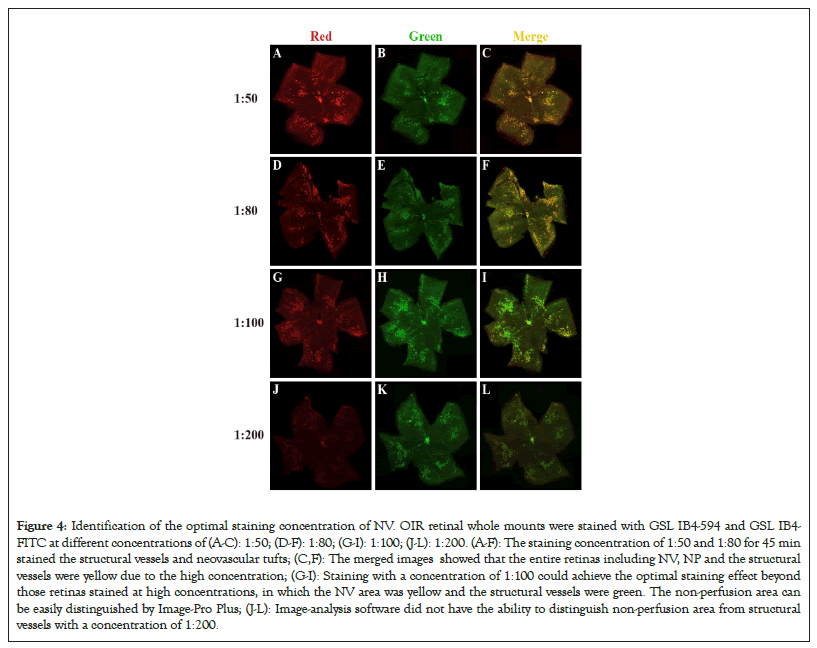
Figure 4: Identification of the optimal staining concentration of NV. OIR retinal whole mounts were stained with GSL IB4-594 and GSL IB4- FITC at different concentrations of (A-C): 1:50; (D-F): 1:80; (G-I): 1:100; (J-L): 1:200. (A-F): The staining concentration of 1:50 and 1:80 for 45 min stained the structural vessels and neovascular tufts; (C,F): The merged images showed that the entire retinas including NV, NP and the structural vessels were yellow due to the high concentration; (G-I): Staining with a concentration of 1:100 could achieve the optimal staining effect beyond those retinas stained at high concentrations, in which the NV area was yellow and the structural vessels were green. The non-perfusion area can be easily distinguished by Image-Pro Plus; (J-L): Image-analysis software did not have the ability to distinguish non-perfusion area from structural vessels with a concentration of 1:200.
To simultaneously display retinal vascular nonperfusion areas, structural vessels, and neovascular tufts, we used a modified dual-staining method that combined with the above-explored staining time and concentration. Firstly, the OIR retinal whole mounts were stained with GSL IB4-594 at a concentration of 1:100 for 45 minutes, then stained with GSL IB4-FITC at a concentration of 1:100 overnight. Our results showed that the NP, NV, and structural vessels could be seen in retinal whole mounts stained with GSL IB4-FITC overnight, but Image-Pro Plus could not distinguish between neovascular tufts and the structural vessels as shown in Figure 4H. Compared with Figure 4G and Figure 4I, staining with GSL IB4-594 at a concentration of 1:100 for 45 minutes could almost completely stain all the neovascular tufts. As a result, the combination of the Green as shown in Figure 4G and Red as shown in Figure 4H draws on the respective advantages of GSL IB4-594 and GSL IB4-FITC staining, such as the green retinal structural vessels and the red neovascular tufts as shown in Figure 4I.
Quantification of the retinal structural vessels, neovascularization and non-perfusion areas
After determining the most suitable time and concentration-controlling dual-staining method, we used Image-Pro Plus to quantify the areas of the NP and NV. The non-perfusion area can be assessed by comparing the areas of neovascular tufts (yellow lines) and the optic disc located in the center of the retina as shown in Figures 5D, 5H and 5J. Compared to the dual-staining image, the other two traditional staining methods showed larger ranges of the NP and NV, which made the Image-Pro Plus measure the higher density of the neovascular tufts and nonperfusion area as shown in Figures 5D and 5G. Compared to the dual-staining image, the other two traditional staining methods demonstrated macroscopic errors. Subsequently, the Image-Pro Plus measurements of these two areas also appeared relatively obvious errors as shown in Figures 6D and 6G. Stained with GSL IB4-594 revealed the most optimal areas of the neovascularization, while stained with GSL IB4-FITC showed the most optimal range of retinal structural vessels and the nonperfusion area as shown in Figures 6C and 6H. Dual-staining method had the same accuracy as GSL IB4-FITC on staining the NV as shown in Figure 6C. Image-pro plus measurements of the NV area marked by GSL IB4-FITC appeared relatively obvious errors as shown in Figure 6D. In summary, the dual-staining method took advantage of these two traditional staining methods to show the best view of retinal structure whole mounts belonging to the OIR mice. Figure 6F shows these processes were largely symmetrical, particularly for the area of NP and NV, as indicated by linear regression parameters. Each point represents a pair of retinas (left eye versus right eye) from a single P17 mouse (Figures 5A-5K and Figures 6A-6H).
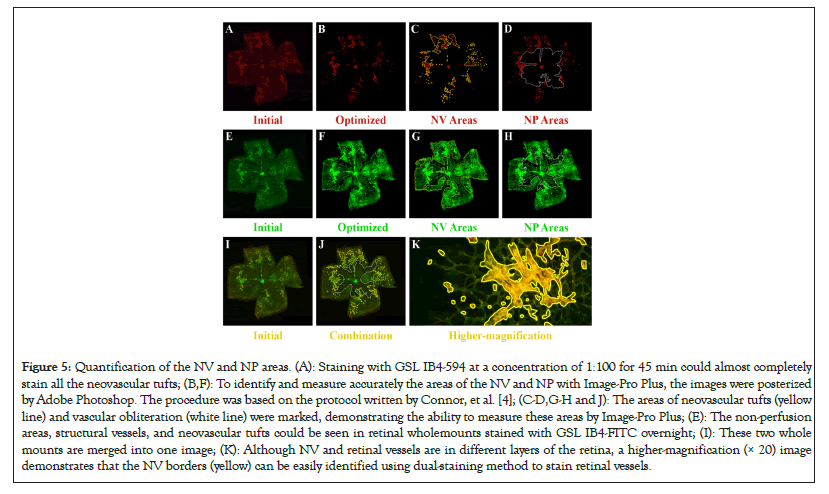
Figure 5: Quantification of the NV and NP areas. (A): Staining with GSL IB4-594 at a concentration of 1:100 for 45 min could almost completely stain all the neovascular tufts; (B,F): To identify and measure accurately the areas of the NV and NP with Image-Pro Plus, the images were posterized by Adobe Photoshop. The procedure was based on the protocol written by Connor, et al. [4]; (C-D,G-H and J): The areas of neovascular tufts (yellow line) and vascular obliteration (white line) were marked, demonstrating the ability to measure these areas by Image-Pro Plus; (E): The non-perfusion areas, structural vessels, and neovascular tufts could be seen in retinal wholemounts stained with GSL IB4-FITC overnight; (I): These two whole mounts are merged into one image; (K): Although NV and retinal vessels are in different layers of the retina, a higher-magnification (× 20) image demonstrates that the NV borders (yellow) can be easily identified using dual-staining method to stain retinal vessels.
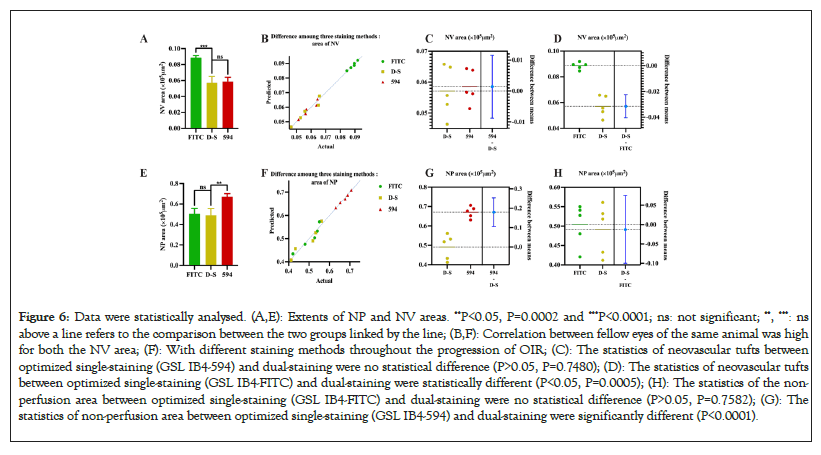
Figure 6: Data were statistically analysed. (A,E): Extents of NP and NV areas. **P<0.05, P=0.0002 and ***P<0.0001; ns: not significant; **, ***: ns above a line refers to the comparison between the two groups linked by the line; (B,F): Correlation between fellow eyes of the same animal was high for both the NV area; (F): With different staining methods throughout the progression of OIR; (C): The statistics of neovascular tufts between optimized single-staining (GSL IB4-594) and dual-staining were no statistical difference (P>0.05, P=0.7480); (D): The statistics of neovascular tufts between optimized single-staining (GSL IB4-FITC) and dual-staining were statistically different (P<0.05, P=0.0005); (H): The statistics of the non- perfusion area between optimized single-staining (GSL IB4-FITC) and dual-staining were no statistical difference (P>0.05, P=0.7582); (G): The statistics of non-perfusion area between optimized single-staining (GSL IB4-594) and dual-staining were significantly different (P<0.0001).
The animal model of OIR has been widely used in the study of the mechanism and intervention of retinal neovascularization, and the detection methods of retinal neovascularization are constantly optimized. Normally, there are no vessels above the Inner Limiting Membrane (ILM) of the retina, so any vessel invading beyond the ILM is NV that grows later. Using this principle, previous studies used Hematoxylin-Eosin (HE) to stain retinal sections and count the number of vascular endothelial cell nuclei in front of the retinal ILM to evaluate the proliferation of local retinal NV, but this method cannot reflect the distribution of NV in the entire retina, let alone display the non-perfusion areas of the retina. The Fluorescein Isothiocyanate (FITC) dextran perfusion method was introduced into the study of OIR neovascularization by D'Amato, et al. [6]. Since the large molecular weight of FITC-dextran wouldn’t leak out of vessels, it can display the shape of retinal vasculature and vas-obliteration areas. However, this method cannot display the NV without blood perfusion. In 2006, Banin, et al. [3] first reported the method of GSL IB4 staining to study retinal NV and non-perfusion areas in OIR mice. GSL IB4 can specifically bind to vascular endothelial cells, thereby marking the area where the vascular endothelium is located and indirectly displaying retinal vasculature. However, none of the above methods can distinguish neovascularization from structural vessels.
Recently, some researchers have devoted themselves to studying how to selectively stain NV. Shen, et al. [7] used unlabeled primary antibody which is less sensitive to recognize NV from preexistent vessels. Retinas from eyes injected with unlabeled anti-PECAM1 antibody and then incubated with labeled secondary antibody showed selective staining of retinal NV with little or no background, greatly facilitating identification and quantification of the NV by the image analysis software. This method is specific and intuitive for displaying pre-ILM NV of the entire retina, but its significant defect is that it cannot evaluate retinal non-perfusion areas. Our modified dual-staining method achieves the goal of staining only the pre-ILM NV in OIR mice. Meanwhile, dual-staining can help to find the ratio of NV and NP. Using this modified method, we were able to assess reliably and consistently both vascular obliteration and pre-retinal neovascular tufts formation in the same specimen [8,9].
In conclusion, this approach greatly facilitates identification and quantification of the NV by image analysis software so far as to deep learning neural networks, providing a time-saving, sensitive and accurate method for retinal neovascularization study for either molecular mechanisms or intervention therapy. The results demonstrated that the combination of two staining methods (GSL IB4-594 and GSL IB4-FITC) enabled the measurement of critical parameters. This method allows the reliable and consistent assessment of retinal neovascularization and non-perfusion areas in OIR model.
This work was supported by the National Natural Science Foundation of China (81973910).
[Crossref] [Google Scholar] [PubMed]
[Google Scholar] [PubMed]
[Crossref] [Google Scholar] [PubMed]
[Crossref] [Google Scholar] [PubMed]
[Crossref] [Google Scholar] [PubMed]
[Crossref] [Google Scholar] [PubMed]
[Crossref] [Google Scholar] [PubMed]
[Crossref] [Google Scholar] [PubMed]
[Crossref] [Google Scholar] [PubMed]
Citation: Xu L, Hu P, Zhang Y, Long J, Wu X, Ye Y, et al. (2023) A Dual-Staining Method to Distinguish Retinal Vessels in Oxygen-induced Retinopathy (OIR) Model. J Clin Exp Ophthalmol. 14:957.
Received: 01-Sep-2023, Manuscript No. JCEO-23-25918; Editor assigned: 04-Sep-2023, Pre QC No. JCEO-23-25918 (PQ); Reviewed: 18-Sep-2023, QC No. JCEO-23-25918; Revised: 25-Sep-2023, Manuscript No. JCEO-23-25918 (R); Published: 02-Oct-2023 , DOI: 10.35248/2155-9570.23.14.957
Copyright: © 2023 Xu L, et al. This is an open-access article distributed under the terms of the Creative Commons Attribution License, which permits unrestricted use, distribution, and reproduction in any medium, provided the original author and source are credited.