Journal of Depression and Anxiety
Open Access
ISSN: 2167-1044
ISSN: 2167-1044
Research Article - (2022)Volume 11, Issue 9
Public Speaking Anxiety (PSA) is characterised by physiological arousal and fear of being negatively evaluated by an audience. There are several research-based interventions for PSA, including cognitive behavioural therapy, exposure therapy, and mindfulness practice; however, there is limited research on using Heart Rate Variability Biofeedback (HRVB) for treating PSA. The current study explored a method of research and intervention that has yet to be investigated in existing literature: combining Heart-Math mindfulness techniques with HRVB for the purpose of treating PSA within an educational setting. An auto-ethnographic approach was used to understand the subjective experience of a single participant attending graduate level classes at a university in Nova Scotia, Canada. Reflective writing and heart rate variability data were systematically collected and analysed throughout the 12-week study period. The observed effectiveness of the intervention provides preliminary support for the usefulness of this intervention with PSA and offers direction for future expanded studies.
Public speaking anxiety; Heart-math; Mindfulness; Heart rate variability biofeedback; Breathing
Public speaking anxiety
Public Speaking Anxiety (PSA) is a mental health condition, which is sometimes referred to as glossophobia in the medical field. It is estimated that 77% of the population worldwide experiences fear of public speaking [1]. Due to its prevalence across all demographics, treatment interventions for PSA have been a key area of research in mental health. At a diagnostic level, someone who has a fear of public speaking may meet the criteria for Social Anxiety Disorder (SAD) under the Diagnostic and Statistical Manual of Mental Disorders (DSM-5) when their experience is marked with significant fear, distress, anxiety, or avoidance in public speaking or performing situations [2]. SAD afflicts approximately 7% of the population in the United States, and with PSA being one of the most common types of social anxiety, afflicting 40% of all those who suffer from SAD [3] there is no shortage of research literature demonstrating helpful interventions.
Interventions for public speaking anxiety
Several studies report that Cognitive Behavioural Therapy (CBT), such as mindfulness-based therapy [4] and cognitive bias modification [1], may significantly alleviate discomfort in individuals during public speaking situations. Another commonly used CBT intervention is exposure therapy [5], and more recently developed virtual reality exposure therapy, which have proven to have comparable results in significantly improving PSA symptoms [3]. CBT has been found helpful in treating PSA because individuals who are socially anxious overestimate the threat of public criticism, scrutiny, or embarrassment and often have negative and distorted thoughts of how others view them [3]. Therefore, through cognitive-based interventions, a shift can be facilitated in one’s interpretations through reframing thoughts and images to a more neutral and rational point of view, which in turn decreases the individual's PSA. Although CBT has a history of being the most widely used treatment for PSA, there has been growing interest in looking at physiological regulation through behavioural therapy as treatment for PSA, and performance anxiety in general. Heart Rate Variability Biofeedback (HRVB) is one such intervention that has been used to treat the physiological effects of various conditions such as anxiety, depression, fibromyalgia, post-traumatic stress disorder, insomnia, performance, etc. [6].
Heart-math mindfulness-based techniques
As mentioned previously, mindfulness-based therapies are a common intervention for PSA, and over the last decade, there has been increasing focus on integrating mindfulness-based techniques with CBT and behavioural therapy intervention models to enhance treatment of various anxiety disorders [7]. The Heart-Math Institute (HMI) has formulated several mindfulnessbased techniques that focus primarily on intentional breathing, regulating emotions and shifting into a positive mindset. These techniques have been supported in having a positive, measurable impact on the physiological experience of stress and anxiety [8]. Furthermore, several studies reveal positive outcomes in using HM interventions and HRVB to reduce test anxiety [9-11]. There are a variety of HM techniques that can be used to manage stress and anxiety, which involve one or more of the following: relaxed and rhythmic breathing, letting go of stressful thoughts and feelings, focusing on sustained neutral or positive emotions, and reframing one’s perception of unpleasant experiences [12]. HM training also commonly uses HRVB to gain insight on a person’s internal experience, the effectiveness of various techniques, and on managing symptoms of stress.
Heart Rate Variability Biofeedback (HRVB)
HRVB is a tool and therapeutic intervention that provides realtime feedback of heart rhythm patterns so that different cognitive, emotional, and physiological states can be better understood and responded to. The process consists of collecting Heart Rate Variability (HRV) data from a participant and as the participant is viewing the results of their heart rhythm patterns, they can adjust their breath pace to reach higher levels of HRV. This is called resonance frequency breathing [13]. HRV results are relevant to understanding a person's level of stress and anxiety because it is reflective of one’s physiological state and responses to different stimuli. Having high HRV is usually reflective of one’s ability to adapt well to changes and external stressors, while having low HRV is a sign that one is less resilient and adaptable to change.
The primary physiological systems that manage these responses are the Sympathetic Nervous System (SNS) and the Parasympathetic Nervous System (PSNS). The SNS is responsible for the fight/flight/ freeze response in reaction to environmental stressors or perceived threats, while the PSNS is responsible for the restoration of the nervous system when a threat or distressing trigger is not present or activating. When a person is adjusting well to external and internal conditions of stress, the SNS and PSNS act in concert (along with mechanical, hormonal, and other physiological mechanisms) to maintain cardiovascular parameters in their optimal ranges [14]. The cardiovascular activity of the nervous system can be collected through a pulse sensor and represented on an HRV signal graph. When the nervous system is regulated, the signal graph depicts smooth, sine-wave-like patterns; when the nervous system is dysregulated, the HRV graph creates jagged, unorganised patterns [15]. In a systematic review on using biofeedback to treat psychiatric disorders by [16], it was found that biofeedback-based interventions were most used in treating anxiety disorders, as compared to other psychiatric conditions. Furthermore, in a meta-analysis conducted by Goessl VC [17], it was found that using HRVB interventions, specifically, were associated with a large reduction in self-reported stress and anxiety.
Study overview
The purpose of conducting this research was to explore the potential impacts of using HM mindfulness techniques and HRVB as a combined intervention on my experience with PSA within an academic setting. Engaging in this domain of research was not only out of personal curiosity, but to explore interventions that might be useful in relieving others of the discomforts and challenges that arise from public speaking. Although there is a significant body of literature that affirms the benefits of biofeedback on various manifestations of performance anxiety, such as sports [9] music [18], and tests [19] there are limited literature on using biofeedback to help PSA. Furthermore, there are several studies that demonstrate the effectiveness of cognitive and mindfulness-based therapies in improving the symptoms of PSA; however, the use of HM techniques and HRVB has yet to be explored as interventions for PSA, and more specifically within academic settings. The present case study employs an auto-ethnographic approach to research, which seeks to describe and systematically analyse my personal experience to gain a deeper understanding of PSA and interventions that might be useful in treating it. A mixed methods design was used to better understand the effects of the study’s chosen intervention through various viewpoints and research lenses.
Positionality
As this is an auto-ethnographic case study, it is important to disclose relevant, personal details about my position as both the researcher and participant. I chose myself as the primary participant of this study because I am a person who experiences PSA. The academic setting is of particular interest to me because (a) my PSA has been most debilitating within academic settings and (b) coming from a professional background in education, I wish to support students who also experience PSA. Also, for the purpose of this study, my experience with PSA will be understood as performance-only SAD, as my level of anxiety in public speaking situations meets this criterion under the DSM-5; however, I have yet to be formally assessed by a professional for this disorder.
I am a white, cisgender female of 36 years from Nova Scotia, Canada. I come from a low-income upbringing and experienced complex and stressful social events throughout most of my childhood, which are developmental factors that have been linked to increased anxiety and other negative emotional states [20,21]. Nevertheless, I persisted through, and sometimes avoided, public speaking situations throughout my years of public schooling and made it through postsecondary education to become a teacher. Upon assuming the role of teacher, I discovered that my fear of public speaking was limited to presenting in front of academic peers and perceived intellectual superiors.
My personal journey has taken me all over the world on a mission to re-discover myself and to figure out how to best navigate the inescapable struggles of life. I discovered yoga, breath-work, and meditation as essential tools for creating calmness, freedom, and flexibility within the body and mind. I became a certified yoga instructor and alternative healthcare provider (which includes being a trained HM Trauma-Sensitive Certified Practitioner) and now have over 900 hours of formal training and 2000 hours of professional experience. Supporting and treating others with holistic therapies has become my greatest passion in life. A passion that also led me to the academic undertaking from which the research of this study was administered, a Master of Education in Counselling at Acadia University, Nova Scotia, Canada.
Although my years of training and practice in mindfulness and yoga have significantly changed the way that my nervous system and mind responds to stressful situations, my experience with PSA remains. Before starting the MEd in Counselling program, July of 2021, my last panic attack was during my second undergraduate degree 11 years ago. The reminder of this debilitating condition remained mostly below the surface until entering graduate studies, where I attended regularly scheduled face-to-face classes as a fulltime student. The classes in this program were highly interactive and involved regular class participation and presentations in front of 18 peers and one of four instructors at a time. From the beginning of this program until the end of the present study, December of 2021, I was faced with regularly occurring symptoms of PSA and experienced three panic attacks. Although personal relevance has fueled my desire to explore interventions for PSA, it is my passion towards supporting others in their personal struggles that motivated me to pursue this research.
Hypotheses
Hypothesis 1: The HM and HRVB intervention will be successful at increasing my HRV during public speaking situations (as measured by the emWave Pro software and quantified as a Coherence Score (CS)).
Hypothesis 2: Using the HM and HRVB intervention over the span of 12 weeks will be successful at increasing my HRV baseline (as measured by the emWave Pro Plus diagnostic assessments that will be used at the beginning and end of the intervention period).
Hypothesis 3: The HM and HRVB intervention will be successful at improving my speech and performance during public speaking situations (as measured through subjective analysis using postintervention reflective writing).
Hypothesis 4: The HM and HRVB intervention will be successful at reducing my PSA associated symptoms (as measured through subjective analysis using post-intervention reflective writing).
Procedure
The intervention period of this case study was conducted over 12 weeks. The context of data collection was during in-person graduate level classes at Acadia University; however, three of the HRV recordings and reflections were done during live online classes due to weather conditions and to make up for classes scheduled during statutory holidays. A mixed methods approach was used to collect data that included experimental and phenomenological exploration. Both quantitative and qualitative data were collected during each class whether there was an opportunity for public speaking or not, as the anticipation of public speaking happened in each class as did symptoms of PSA. The designated data collection hour chosen for each class was either during the first hour of a threehour class (due to the expected interaction and public speaking that would occur at this time), or it was during higher stake public speaking situations, such as summative class presentations or group demonstrations. Following the one-hour public speaking situation with HRV recording, both quantitative and qualitative data was stored.
The 12-week intervention period was broken down into intervals where there were two weeks of no intervention, followed by two weeks of applied intervention. The study phases are illustrated in Figure 1. This method of intervention and data collection was consistently used, interchanging between non-intervention and intervention phases every two weeks, until the 12-week HRV data collection period was complete. To assess my physiological baseline prior to applying the study’s interventions, an HRV diagnostic assessment was done at the beginning of the 12-week study period and a second baseline assessment was done four weeks following the intervention period of the study. The purpose of this data was to explore if there would be a lasting change in my HRV baseline following the study’s interventions. For both baseline data collection periods, two standardised diagnostic assessments were administered: (1) 5 min resting assessment and (2) 1 min deep breathing assessment. After all data was collected, the impact of the intervention was explored through analyzing the results of the Coherence Scores (CS), HRV baseline assessments, and reflective writing manuscripts (Figure 1).
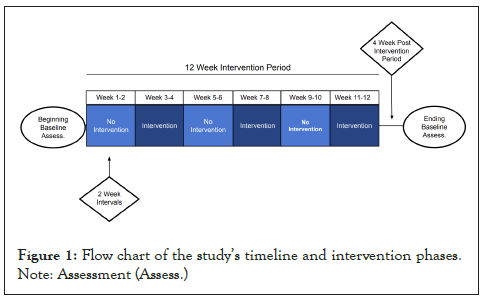
Figure 1: Flow chart of the study’s timeline and intervention phases.
Note: Assessment (Assess.)
Data collection materials
The quantitative data, which is in the form of HRV baseline measurements and CS (see the Quantitative Measures section for explanation), was collected using two pieces of HM technology: (1) the emWave Pro program (used for collecting the CS during the intervention phases) and (2) the emWave Pro Plus software and diagnostic program (used for collecting the beginning and ending baseline HRV readings). To obtain the HRV results, the emWave Pro was connected to a Photo-Plethysmo Graphy (PPG) earlobe pulse sensor, which tracks the beat-to-beat change in pulse, and time between subsequent pulses, thus generating a signal representative of HRV [22]. PPG technology is considered a reliable and valid method of collecting and quantifying HRV [23]. The qualitative data was collected using five brief reflective questions (see Qualitative Measures section) to capture the depth of my experience as the primary participant. Reflective writing was done within 30 minutes of each one-hour HRV recording throughout the 12-week study period.
Quantitative measures
HRV baseline diagnostic assessment: The HRV baseline measurements conducted in this study were performed according to the guidelines and recommendations of the Task Force of the European Society of Cardiology and the North American Society of Pacing and Electrophysiology [24], HRV results, measured through heart rhythm patterns using the PPG ear sensor, were quantified using the emWave Pro Plus software into HRV indices and organized into a numerical table. The table identifies the different indices measured (time domain measurements and frequency domain measurements), their value, the units of measurement, and a reporting log. A change in these indices determines whether HRV is higher or lower from the initial baseline recording to when the second and final baseline was recorded. When the numerical value of these indices increases, excluding the Heart Rate (HR) indices, it is reflective of the HRV level also increasing. If the numerical value of these indices decreases, again excluding the HR indices, it is reflective of the HRV decreasing. When HR increases, there is less time between heartbeats for variability to occur, which means HRV decreases. A decrease in HR, therefore, is an indicator of HRV increasing. High HRV is the desired outcome for this study as it is indicative of self-regulation, emotional stability, a reduction in stress and negative emotions, promotion of sustained positive emotions [25], physical health, better performance, and improved cognitive acuity, memory, and focus.
Coherence score
The HRV data collected over the 12-week intervention period was quantified using an HRV scoring algorithm on the emWave Pro program called the Coherence Score (CS). The CS is a measure of the degree of coherence in heart rhythm patterns. The more stable and regular the heart rhythm frequency, the higher the CS [26]. This program takes the HRV indices collected through a PPG sensor and translates the data into a single decimal number that reflects the measurement of HRV. Scores range from 0-16 (>0.5 = basic/beginner level, 1.0= good, 2.0=very good, and 3.0+=excellent) [27]. There is also an option to choose a challenge level (low, medium, high or very high), which changes the threshold of any given CS. The challenge level on the emWave Pro program was kept at low for the duration of the study. A high CS correlates with increased synchronisation between the SNS and the PSNS, decreased SNS activation and increased PSNS activity, increased synchronisation between the brainwaves and the heartbeat, and oscillatory entrainment between the different physiological systems. The scoring algorithm of the emWave Pro continuously monitors the most current heart rhythm data and updates the score every five seconds.
Qualitative measures
The purpose of this measure is to allow for an in-depth and holistic examination of the perceptions I had on my performance, emotions, and physiological symptoms in the context of public speaking situations.
Heart-Math mindfulness-based intervention: Three HM mindfulness-based techniques were used during each intervention phase of the study. The techniques used were (1) Heart Focused Breathing (slow rhythmic breathing while focusing on the heart), (2) The Quick Coherence Technique (heart-focused breathing and focusing on regenerative emotions), and (3) The Freeze Frame Technique (identifying negative thoughts and shifting into a more positive frame of mind). Additionally, the Freeze Frame Technique was used as a morning practice before going to school on intervention days. While implementing each of the HM techniques there was a focus on the area of the heart and activating a positive emotion, such as love, compassion, or appreciation. These practices are said to create a rapid shift of increased HRV, which in turn, makes it easier to sustain positive, regenerative emotions and perceptions. It is suggested that through implementing these techniques, a person can better manage their reaction to stressful situations by gaining new feelings and insights about how to best approach stressful situations even as they are occurring [8].Therefore, it is assumed that these approaches could be helpful in relieving the cognitive, emotional, and physiological symptoms of distress associated with PSA.
Heart rate variability biofeedback intervention: HRVB was used at the same time as the HM mindfulness-based intervention during in-class data collection. HRVB was done by learning to breathe at a frequency (breaths per minute) that was optimal for producing high HRV results. The breathing frequency that was used during each HM & biofeedback intervention was approximately 6 breaths per minute, which was timed at 10 second breath cycles. This optimal frequency of breath was programmed into the emWave Pro’s built-in breath pacer, which helped to guide consistent breathing patterns. While practicing resonance frequency breathing and the HM mindfulness-based interventions, the emWave Pro displayed a coherence ratio of low, medium, and high, which signifies the changing levels of HRV throughout a recording session. In monitoring the coherence ratio throughout an intervention session, I was able to see when my coherence was dropping and apply more focused intervention to raise my coherence when needed.
Data analysis
To explore the results of the HRV data from the present study, both CS and beginning and ending baseline diagnostic data sets were analysed. A CS was generated after each 1-hour recording session, and a mean was calculated based on the 3 recording sessions administered each week. The mean CS from each week was plotted on a line graph, comparing the intervention and nonintervention phases over the 12-week period. The beginning and ending baseline data was analysed through comparing the HRV index results from the intervention and non-intervention phases. The indices were separated into the categories of time domain and frequency domain indices and were analysed independently. To explore the results of the reflective writing data, thematic and descriptive analysis was employed to compare the intervention and non-intervention phases. The various sub-themes, which are explored in the Reflective Writing Results section, were identified under three major themes relating to PSA: (1) autonomic symptoms, (2) performance, and (3) emotions. Thematic analysis was utilised to categorise and compare the various sub-themes that arose under the three major themes, while examining the calculated differences between the intervention and non-invention phases.
HRV results
Coherence score results: In total, there were 36 in-class recordings done over the 12-week period (18 recordings done with intervention and 18 recordings done without intervention). The CS measure was used to assess the following research question: Will implementing HM techniques and HRVB influence my HRV in public speaking situations and, if so, to what degree? The CS mean data points are plotted in Figure 2 to show the difference between phases of intervention and non-intervention. As represented in Figure 2, during the weeks of non-intervention, the CS mean was between basic/beginner (0.5) and good (1.0). During weeks of applied intervention, all CS means were between good (1.0) and very good (2.0). Based on these observations of the results, higher CS is consistently evident when intervention is being used at any given point during the 12-week study period (Figure 2).
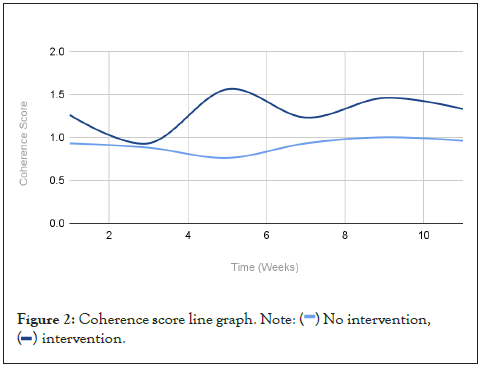
Figure 2: Coherence score line graph.

Upon reviewing the sign-wave power spectrum data, there is evidence of a consistent correlation between intervention phases and waveforms that are indicative of high-level HRV. Furthermore, during live biofeedback observations of the power spectrum graph, it was observed that applying HM techniques and HRVB training created a positive shift in the sign wave patterns during moments of elevated PSA. During phases of non-intervention, there is no evidence of smooth, regulated sine wave patterns, but instead there is consistent evidence of waveforms that are indicative of lower HRV. Examples of intervention and non-intervention spectral analysis can be seen in respectively Figures 3 and 4.
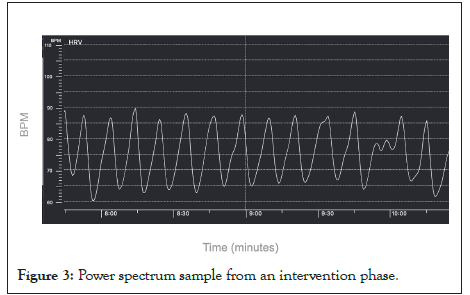
Figure 3: Power spectrum sample from an intervention phase.
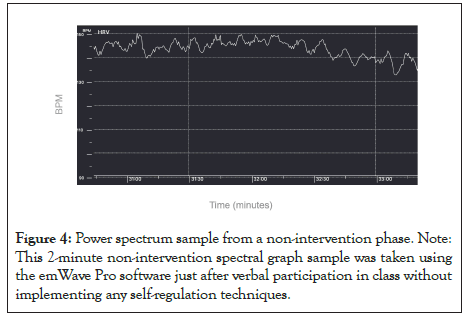
Figure 4: Power spectrum sample from a non-intervention phase. Note: This 2-minute non-intervention spectral graph sample was taken using the emWave Pro software just after verbal participation in class without implementing any self-regulation techniques.
In Figures 3 and 4, the minimum and maximum Beats Per Minute (BPM), along the vertical axis of the spectral graph, do not align numerically because the axis shifts depending on higher or lower HRV readings.
Beginning and ending diagnostic assessment results: The beginning and ending HRV baseline measurements were administered to answer the second quantitative research question: Will my HRV baseline change after implementing 12 weeks of HM and HRVB training? For both beginning and ending baseline data collection periods, two standardised diagnostic assessments were administered: (1) 1 min deep breathing assessment, which is representative of HRV baseline shifts over time and (2) 5 min resting assessment, which is representative of one's ability to regulate in the moment. Both the length of the recording time and the context of recording significantly affect the HRV results, and therefore each diagnostic assessment will be considered separately.
Frequency domain results: Frequency domain values calculate the absolute or relative amount of signal energy present in a specific data set [28].Frequency domains are best understood through collecting data at a resting state and over a longer intake period (x ≥ 3 minutes), therefore, the 1-minute deep breathing diagnostic assessment does not include frequency domain indices. The beginning and ending baseline frequency results for the 5-minute diagnostic assessment are represented in Table 1. The specific frequency domain measures collected from the 5-minute resting assessment were Very Low Frequency (VLF), Low Frequency (LF), High Frequency (HF) Total Power (TP), Low Frequency/High Frequency ratio (LF/HF) and Normal Coherence (NC). HF reflects parasympathetic (vagal) nervous system output and is the most reported measure of HRV in anxiety literature [29], which makes it the most notable frequency domain index for this study.
| Frequency domain indices | ||||||
|---|---|---|---|---|---|---|
| VLF | LF | HF | TP | LF/HF | NC | |
| Beginning base line | 3.51 | 6.69 | 4.86 | 6.86 | 1.81 | 3.95 |
| Ending base line | 5.34 | 7.08 | 5.69 | 7.43 | 1.38 | 4.12 |
Note: The natural logarithm was calculated for all raw HRV data in this table.
Very Low Frequency (VLF); Low Frequency (LF); High Frequency (HF); Total Power (TP); Low/High Frequency ratio (LF/HF); Normal Coherence (NC).
The comparison of frequency domain indices represented in Table 1 indicates a positive shift in HRV from beginning to ending baseline assessments. Five out of the six frequency domain indices increased (VLF, LF, HF, TP, and NC), which represents the balance between the SNS and PSNS, while one out of the six indices decreased (LF/HF). It is debatable whether the LF/HF index should be interpreted in HRV data as it is impossible to delineate its physiological basis with any degree of certainty [30]. Therefore, no interpretation will be made of the decrease of LF/HF from this data set (Table 1).
Time domain results
Time domain indices quantify the amount of HRV observed during monitoring periods through determining the heart rate at any point in time or the intervals between successive normal complexes [24]. The specific time domain measures collected from the 1-minute deep breathing assessment and 5-minute resting assessment were Mean Heart Rate (MHR), Standard Deviation of NN intervals (SDNN), and Root Mean Square of Successive Differences (RMSSD) between normal heartbeats. A fourth commonly reported time domain index for the 1-minute deep breathing assessment only is Mean Heart Rate Range (MHRR), which is the difference between the maximum and minimum heart rate during each breathing cycle. RMSSD is most widely used in interpreting changes in HRV from the time domain indices as it closely represents parasympathetic activity and highly correlates with the HF component from frequency domain data [29].
Tables 2 and 3 provide a comparison of the time domain spectral analysis data. The MHRR and MHR indices decreased from the beginning to ending baselines, which correlates with an increase in HRV over time and increased ability to regulate in the moment, respectively. The SDNN and RMSSD indices also increased which represents the balance between the SNS and PSNS and correlates with higher HRV. Overall, a positive shift in HRV was observed when comparing the time domain indices from the beginning and ending baseline diagnostic results.
| Time domain indices | ||||
|---|---|---|---|---|
| Measure | MHRR | MHR | SDNN | RMSDD |
| Beginning base line | 35.65 | 92.34 | 81.5 | 4.07 |
| Ending base line | 28.04 | 78.16 | 106.42 | 4.27 |
Note: The natural logarithm was calculated for the RMSSD index; all other indices are raw data.
Mean Inter-Beat Interval (IBI) and Normalized Coherence (NC) have been omitted to highlight significant indices.
Mean Heart Rate Range (MHRR); Mean Heart Rate (MHR); Standard Deviation of the NN intervals (SDNN); Root Mean Square of Successive Differences (RMSSD).
Table 2: 1-Minute baseline deep breathing assessment for time domain indices.
| Time domain indices | |||
|---|---|---|---|
| Measure | MHR | SDNN | RMSDD |
| Beginning base line | 92.09 | 58.3 | 3.68 |
| Ending base line | 73.53 | 94.13 | 4.4 |
Note: The natural logarithm was calculated for the RMSSD index; all other indices are raw data.
Mean Inter-Beat Interval (IBI) and Normalized Coherence (NC) have been omitted to highlight significant indices.
Mean Heart Rate (MHR); Standard Deviation of the NN intervals (SDNN); Root Mean Square of Successive Differences (RMSSD).
Table 3: 5-Minute resting baseline assessment for time domain indices.
Reflective writing results
Speech and performance: Speech and performance were major themes subjectively observed and reflected on throughout the 12- week intervention period. This theme addresses the third research question: What, if any, impact will HM techniques and HRVB have on my speech and performance during public speaking situations? The sub-themes that arose under this category were (1) public speaking avoidance, (2) rushing speech (including suspension of speech prematurely), (3) unclear speech (including speech that was perceived as confusing or not understood by the recipient), and (4) speech was clear and/or well-articulated. Figure 5 shows how these results compare during intervention and non-intervention phases. The sub themes were analyzed based on the frequency they were observed and reported on in the reflective writing data. A slight positive shift was observed in two of the sub-themes, rushing speech and speech was unclear, while there was no difference in the frequency of public speaking avoidance during intervention and non-intervention phases. The fourth sub theme, speech was clear and/or well-articulated, was observed at a much higher frequency during intervention phases as compared to non-intervention phases. Language such as “I spoke clearly and confidently,” “It was a valuable and well-spoken response,” and “(my contributions were) thoughtful, meaningful, and well-articulated” were consistent throughout intervention phases. However, during non-intervention phases, self-doubting perceptions such as “I could barely get a sentence out,” “I am not feeling good about the phrasing of my speech,” and “I felt that it didn't make any sense” were more frequently and intensely expressed.
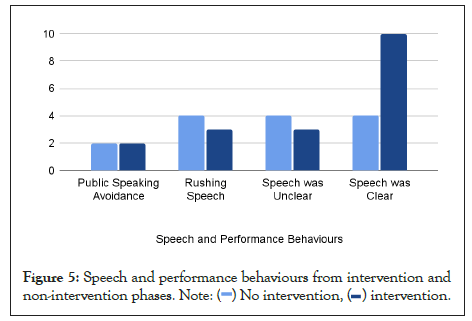
Figure 5: Speech and performance behaviours from intervention and
non-intervention phases.
Autonomic symptoms of PSA
My experience with autonomic symptoms of PSA was a second major theme that provides feedback to the fourth research question: What, if any, impactwill HM techniques and HRVB have on my PSA and associated symptoms? Seven reoccurring PSA symptoms were observed throughout the 12-week intervention period: (1) shakiness (including voice and involuntary body shaking), (2) chest tightness (including throat tightness and inability to take deep breaths), (3) brain fog (including memory loss and trouble organising thoughts), (4) heart pounding, (5) dry mouth, (6) stomach fluttering (including nausea), and (7) crying. Figure 6 offers a comparison of these symptoms using bar graph analysis representing the number of occurrences of each symptom during intervention and non-intervention phases. As depicted in Figure 6, each symptom was observed at least once during both intervention and non-invention phases. The results demonstrate an overall decrease in PSA symptoms observed during intervention phases, with six of the seven recorded symptoms showing a 50% decrease or more. Additional symptoms that were reflected on, but did not regularly appear in the written reflections, were muscle tension (two times during non-invention phases) and numbness (once during an intervention phase).
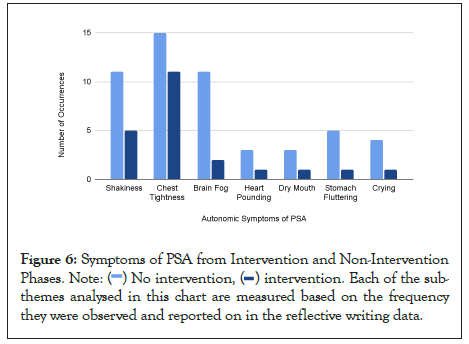
Figure 6: Symptoms of PSA from Intervention and Non-Intervention
Phases. Each of the subthemes
analysed in this chart are measured based on the frequency
they were observed and reported on in the reflective writing data.
Another secondary theme that arose from the reflective writing data was in-the-moment relief from PSA symptoms of distress. During a recording session when I was giving a summative presentation in front of my peers and instructor, I had reported that I was feeling “extremely anxious” and was experiencing my “heart beating faster, some shaking, and an overly dry mouth.” It was also reported in this reflective piece that heart-focused breathing was used to selfregulate and that it helped to, “…feel more at ease.” Furthermore, following the presentation “my body did not feel depleted like (a prior presentation).” Another anecdotal piece that is relevant to this section of analysis is that over the course of the 12-week study period I had three panic attacks, which were all during high stake presentations on non-intervention days. No panic attacks were had during the high-stake presentations when I was applying intervention. The results from this portion of the qualitative data analysis demonstrate that the intervention did provide some in-themoment relief from PSA symptoms.
Emotions
Sustained regenerative emotions have an energising, uplifting, and/or calming effect that activates the body’s natural resonant frequencies and increases physiological coherence [18]. Some examples of regenerative emotions extracted from the qualitative data are confidence, calm, joy, determination, contentment, excitement, and appreciation. Depleting emotions, on the other hand, have an adverse effect. They tend to drain energy, lower physiological coherence, and have the potential to impair bodily systems through release of stress hormones. Some examples of depleting emotions extracted from the qualitative data are anxiousness, self-doubt, sadness/despair, fear, overwhelm, embarrassment and frustration. In relation to HRV, spontaneously occurring or intentional shifts to a sustainable positive emotional state such as appreciation and compassion can naturally increase HRV [31,32].
My observed emotional state during public speaking situations is the last major theme that was analysed from the reflective writing data. There were 26 different emotions mentioned throughout the 12- week period. To compare the identified emotions in the context of intervention and non-intervention phases, each emotion observed was placed into one of two categories: regenerative emotions or depleting emotions. The results are shown in Table 4 and the percentile calculations were integrated into a pie chart as seen in Figures 7 and 8. Figure 7 represents the frequency of regenerative emotions during intervention and non-invention phases, while Figure 8 represents the frequency of depleting emotions during said phases. These figures demonstrate that regenerative emotions were observed more often during intervention phases, and depleting emotions were observed more often during phases of non-intervention [33-35].
| Regenerative emotions total | Depletion emotions total | ||
|---|---|---|---|
| Intervention | Non-intervention | Intervention | Non-intervention |
| 30 | 8 | 22 | 43 |
Note: Regenerative emotions have an energising, uplifting, and/or calming effect, while depleting emotions tend to drain energy, lower physiological coherence, and have the potential to impair bodily systems.
Table 4 : Regenerative and depleting emotions observed.
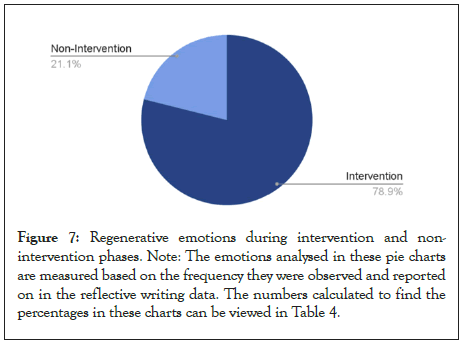
Figure 7: Regenerative emotions during intervention and nonintervention phases. Note: The emotions analysed in these pie charts are measured based on the frequency they were observed and reported on in the reflective writing data. The numbers calculated to find the percentages in these charts can be viewed in Table 4.
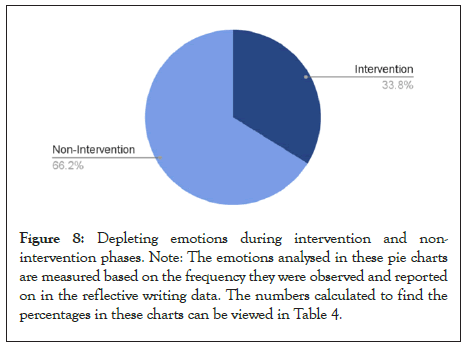
Figure 8: Depleting emotions during intervention and nonintervention phases. Note: The emotions analysed in these pie charts are measured based on the frequency they were observed and reported on in the reflective writing data. The numbers calculated to find the percentages in these charts can be viewed in Table 4.
Overall, the data results provide support in favour of the study’s hypotheses. The chosen intervention had a positive effect on my HRV and on my subjective experience with PSA. With consistent practice, I learned how to shift my emotional and physiological state at will and became more confident in my ability to manage the distress that came with public speaking situations. Furthermore, at times when I did not use the chosen intervention, nor any other self-regulating practice, I did experience an increase in physiological, emotional, and psychological distress. With that said, the chosen interventions did not eliminate my PSA. During each recording session of the 12-week period, symptoms of PSA were still observed. Although the results of this study support the effectiveness of using HM techniques and HRVB as an intervention for my own PSA, to determine a true correlation or causation, more rigorous clinical trials are needed.
Benefits and future directions
In assessing the potential impacts of the study’s intervention on myself, I have gained a deeper understanding of the limits and benefits of the chosen methods for this study, which will be helpful in informing my decision-making around introducing these interventions to a wider scope of participants. Furthermore, the process and results of this study have provided me with further understanding about the impact of PSA on HRV, as well as how the chosen intervention impacts symptoms of anxiety. On a professional-academic level, the research process has provided me with an opportunity to develop skills and experiment with different methods that can be used in a future expanded study. To claim significance or a level of confidence in the methods used, however, a future expanded study is needed with a sufficient sample population consisting of a control group and experimental group with valid, reliable instrumentation and measures.
It must be clearly noted that the results of this study are not representative of any given population. This study is solely exploratory and is an assessment of my own personal experience. With that said, the effectiveness of the intervention is not expected to transcend the limits of this study in potential future applications. Further studies are required to confirm the possibility of a causal relationship between the intervention used and its effects on PSA. Therefore, the first identified limitation of this study is the insufficient sample size and inadequate data for statistical analysis. Secondly, research bias is an inevitable result of being the primary researcher and participant of this case study. It is understood that a desire to meet the study’s hypotheses could impact the results through increased efforts in reaching higher HRV levels. Throughout the course of the study, I was cognisant of the possible impacts of my dual role, and it was my intention to not let the hypotheses interfere with the exploratory nature of this study. Also, my prior experience and confidence in mindfulness and breathing techniques may have had a positive impact on the study’s results through belief in the effectiveness of these modalities. Furthermore, I chose the method of two-week intervention and non-intervention intervals because the expectations of public speaking in the MEd in Counselling program was expected to develop into higher stake summative presentation assessments as the academic semester progressed. Therefore, it was assumed that collecting data in this way would yield the most reliable results for this study, compared to collecting data, for example, with six weeks of non-intervention followed by six weeks of applied intervention. The limitation of this method, however, is that using interventions more consistently for an extended period might increase the effectiveness of the interventions .Furthermore, having a participant phasing in and out of intervention at two-week intervals may increase the participant’s natural and involuntary ability to self-regulate during non-intervention phases. Lastly, for the duration of the study, I received free counselling services provided by Acadia University as part of the MEd in Counselling program. Although PSA was not the primary focus of the therapy I received, some studies show a positive correlation between counselling and an increase in one’s HRV baseline.
I would like to give special mention and acknowledgment to the people who supported my learning and growth throughout this study. This includes my teachers at Acadia University; Professor Ying Zhang, PhD and Gregory MacKinnon, PhD, representatives from Acadia’s Division of Research & Graduate Studies; Stephen Maitzen, PhD, chair of the research ethics board at Acadia; Birdie Benson, PhD, my internal reader; Carolyn McLeod, MEd, fellow researcher, educator and HeartMath enthusiast; and Julia Wassif, MEd, my counsellor. I would also like to express particular appreciation to the following individuals whom I’ve relied on greatly and owe for their contributions to my success: Tanya Surette, PhD, my supervisor, teacher and primary internal reader for this research project; Jackie Waterman, Medical Technologist at the HeartMath Research Center who has supported me in navigating the Heart- Math technology and HRV measurements; and my sister, Angela Dorey, MEd, who has supported me throughout my graduate studies and who has always been a guiding light in my life.
[Crossref][Google Scholar][PubMed].
[Crossref][Google Scholar][PubMed].
[Crossref][Google Scholar][PubMed].
[Crossref][Google Scholar][PubMed].
[Crossref][Google Scholar][PubMed].
[Crossref][Google Scholar][PubMed].
[Crossref][Google Scholar][PubMed].
[Crossref][Google Scholar][PubMed].
[Crossref][Google Scholar][PubMed].
[Crossref][Google Scholar][PubMed].
[Crossref][Google Scholar][PubMed].
[Crossref][Google Scholar][PubMed].
[Crossref][Google Scholar][PubMed].
[Crossref][Google Scholar][PubMed].
[Crossref][Google Scholar][PubMed].
[Google Scholar][PubMed].
[Crossref][Google Scholar][PubMed].
[Crossref][Google Scholar][PubMed].
Citation: Morrissey NL (2022) A Heart-Focused Intervention: The Influence of Heart-Math Mindfulness Techniques and Heart Rate Variability Biofeedback on Public Speaking Anxiety. J Dep Anxiety. 11:481.
Received: 14-Sep-2022, Manuscript No. JDA-22-19213; Editor assigned: 16-Sep-2022, Pre QC No. JDA-22-19213 (PQ); Reviewed: 30-Sep-2022, QC No. JDA-22-19213; Revised: 07-Oct-2022, Manuscript No. JDA-22-19213 (R); Published: 14-Oct-2022 , DOI: 10.35248/2167-1044.22.11.481
Copyright: © 2022 Morrissey NL. This is an open access article distributed under the terms of the Creative Commons Attribution License, which permits unrestricted use, distribution, and reproduction in any medium, provided the original author and source are credited.