Drug Designing: Open Access
Open Access
ISSN: 2169-0138
ISSN: 2169-0138
Research Article - (2016) Volume 5, Issue 1
Background: Phase III trials can fail, leading to termination of drug development. This can result from heterogeneous subpopulations such as a drug-sensitive and a drug-insensitive subpopulation of patients or biological subtypes.
Methods: Traditional phase II methods do not detect heterogeneity of subpopulations. We proposed a new adaptive design for phase II trials, adapted from Simon’s “Minimax” design, where heterogeneity between two subpopulations could be highlighted.
Results: Drug inefficacy in one or two subpopulations could be determined at stage one and two and drug efficacy at stage two. Single Simon design and two independent Simon designs were compared to the adaptive design using calculated type I and II errors, expected and maximum sample size, and the probability of detecting drug-insensitive subpopulations. For the adaptive design, the type I and II errors calculated were similar to those of a single Simon design, sample size was smaller than with the two independent Simon designs (between 25 and 40% fewer patients) and the probability of detecting drug-insensitive subpopulations remained at 40%. An example with real data is presented.
Conclusion: In the event of different subpopulations of patients or biological subtypes, our adaptive design can help select the drug sensitive subpopulation in one single trial.
<Keywords: Clinical trials; Phase II trials; Simon's two-stage design; Target subpopulation
In phase II clinical trials in oncology, determining inclusion criteria of a potentially sensitive population is a critical issue in drug development. Firstly, investigators must define the patient-related criteria: performance status, an independent risk factor for increased toxicity and reduced efficacy of treatment [1] and the age limit permitted, since it has been shown that some drugs induce severe side effects more frequently in elderly than in younger subjects [2]. The second consideration is the tumor-related criteria. It is common practice to include tumors with an identical primary site, such as breast or lung, and with identical histology. These criteria are chosen after examination of the pre-clinical data on drug efficacy [3]. However, this approach has been shown to have a low positive predictive value and a low negative predictive value of drug efficacy in humans [4].
Despite the extensive patient-related and tumor-related data available, population selection for phase II trials remains challenging and these trials frequently fail to demonstrate efficacy. This can be due to the heterogeneity of two subpopulations included in the same phase II trial. The drug may show efficacy in only one subpopulation: for instance, overexpression of c-erbB2 (but not lack of expression) is predictive of a response to trastuzumab [5], the cytotoxic agent vinflunine has been shown to be active in patients with good performance status but not in those with poor performance status [6] and KRAS mutation is predictive of a response to cetuximab in colon cancer [7] but not in lung cancer [8].
Studying efficacy in heterogeneous subpopulations may therefore prove extremely useful to limit the risk of failure.
From a methodological standpoint, the evaluation of two potentially different subpopulations could be undertaken by conducting two separate phase II clinical trials. However, this approach increases costs and time before a conclusion can be reached. Another approach is to perform an adaptive phase II clinical trial including two subpopulations, with a design that allows detection of heterogeneity. The results demonstrate efficacy or inefficacy in one or the two subpopulations.
The two-stage Simon design (1989) allows early termination of a trial in the event of inefficacy of the drug, and in the case of non- efficacy, minimises the expected sample size under the null hypothesis (Optimal method), or minimises the maximum number of subjects to be included (Minimax method) [9]. It is a well-established and widely-used approach that has been cited over 700 times since it was published in 1989, 50 times in 2001 and over 100 times in 2005 [10]. Its widespread use is a result of its easy implementation and the associated paradigm: early cessation is only possible in cases of clear inefficacy, otherwise the trial continues.
A few adaptive designs are available, based on Fleming’s design [11] and Simon’s design [12]. The adaptive Simon’s design developed by Jones and Holmgren is built why two hierarchical subpopulations. In this design, in case of reject of a subpopulation for drug inefficacy, it is hypothesized that a pre-selected subpopulation should be systematically preferred. We present a design without such hypothesis: the two subpopulations are considered equally.
The aim of this article was to describe an adaptive design based on Simon’s “Minimax” design, whereby any potential heterogeneity of the subpopulations could be detected at the end of each stage of the trial. At the end of the first stage, drug inefficacy might become apparent in one or two subpopulations, and if this is the case in the two subpopulations, the trial stopped. Otherwise, the trial continued through the second stage in one or two subpopulations. Again, at the end of the second stage, conclusions regarding efficacy or inefficacy could be drawn on one or two subpopulations.
We described the design, the results of calculations, and comparisons against the sample size and probability to demonstrate heterogeneity using two independent Simon designs, each enrolling a subpopulation. Lastly, an example with real data was presented.
Assumptions and notations
We considered two subpopulations i, and two stages s (i = 1; 2 and s = 1; 2)
nis: the number of subjects for subpopulation i at stage s.
n•s: the total number of subjects added at stage s.
Nis : the cumulative number of subjects for subpopulation i at stage s.
N.s: the cumulative number of subjects at stage s.
Ris: the number of responses for subpopulation i at stage s.
Ri•: the cumulative number of responses for subpopulation i.
and R•s: the cumulative number of responses at stages.
We assumed that the ratio w between the two subpopulations in our sample could be different from 1 but was constant between the two stages and was a priori defined. This ratio w was not necessarily related to the true ratio between the two subpopulations. In our design, it was possible to determine the value of w arbitrarily.
n2s = w × n1s (1)
For each subpopulation, we defined a minimum π0i efficacy and a particularly relevant efficacy π1i: this enabled calculation of Δi
Δi = π1i – π0i
Th e true response rates for subpopulations 1 and 2 were recorded as p1 and p2.
The null and alternative hypotheses could be expressed as follows:
H0: the two subpopulations were drug insensitive with a response rate of 
H1: at least one subpopulation was drug sensitive (p1 > π01 ∪ p2 > π02)
To calculate the number of subjects to conclude, we proposed a particular alternative hypothesis: the two subpopulations were drug sensitive with a response rate of π1.
With the concept of heterogeneity of subpopulations, we defined four situations of interest:
Null hypothesis: H00: p1 = π01 ∩ p2 = π02
Particular hypothesis under H1: H11: p1 = π11 ∩ p2 = π12
The symmetrical hypothesis of the previous: H10: p1 = π11 ∩ p2 = π02
α is the risk to conclude that at least one subpopulation is drug sensitive whereas the two subpopulations are drug non-sensitive.
β is the risk to conclude that one (or two) subpopulation(s) is (are) drug non-sensitive whereas it (they) is (are) drug sensitive.
General principles of the stratified adaptive Simon’s Minimax design
Determination of the adaptive design parameters from a conventional Simon Minimax design
From formulae (1), we calculated: 
A Simon Minimax design was then constructed, with π0 and π1 leading to the calculation of (n•1, a1, n•2, a2), where a1 and a2 were stopping rules for stage 1 and stage 2.
From formulae (1), we calculated also:
n•s = n1s + n2s = n1s × (1 + w)
As numbers of expected responses, the following [n1s × (1 + w)],  must all be integers and were rounded if they were not.
According to the conventional Simon Minimax design, rules for discontinuation were as follows:
- at the first stage
i) if the cumulative number of responses (R•1 among N•1) was less than or equal to a1, then the trial was stopped for drug inefficacy for the two subpopulations.
ii) if the cumulative number of responses was greater than a1, then the trial continued with the two subpopulations.
- at the second stage
i) if the cumulative number of responses (R•2 among N•2 ) was less than a2, then the trial was stopped for drug inefficacy for the two subpopulations.
ii) if the cumulative number of responses was greater than a2, then the trial was stopped for drug efficacy for the two subpopulations.
Heterogeneity
Our adaptive method was designed to detect heterogeneity of subpopulation. When the number of responses was low, detecting heterogeneity allowed us to conserve one subpopulation rather than stopping the two subpopulations.
To do so, we proposed to modify the discontinuation rules of Simon’s Minimx design at stage 1 and 2.
For example, in stage 1, if the cumulative number of responses of the two subpopulations was too low (R11+R21≤ a1), heterogeneity test was performed. If the cumulative number of responses of the two subpopulations was high (R11+R21 > a1), heterogeneity test was not performed.
To perform this test, and as reported by Tournoux-Facon [11], we introduced a heterogeneity factor Ψs at each stage If [d1s > 0 and d2s < 0] and [|d1s| + |d2s| ≥ δs], Ψs = 1
If [d1s < 0 and d2s > 0] and [|d1s| + |d2s| ≥ δs], Ψs = 2
Otherwise Ψs = 0
where dis = (Ris/nis) – π0i and δs was a threshold associated with a new shrinkage parameter

(d was a dummy variate and δswas the minimum argument)
(γ was a shrinkage parameter associated with a risk of error due to the introduction of heterogeneity. In stage 1, it was a risk to conserve a subpopulation whereas this subpopulation was drug non-sensitive and stage 2, it was a risk not to conserve a subpopulation whereas this subpopulation was drug sensitive).
We concluded for heterogeneity if Ψs ≠ 0.
Finally, for each stage, decisions rules according to Ψs and the values of Ris, and dis were summarized in Tables 1 and 2.
| Heterogeneity test | ψ1 | Decision for subpopulation 1 | Decision for subpopulation 2 |
|---|---|---|---|
 |
0 | Drug non-sensitive | Drug non-sensitive |
 |
0 | Drug non-sensitive | Drug non-sensitive |
 |
1 | Conserved in stage 2 | Drug non-sensitive |
 |
2 | Drug non-sensitive | Conserved in stage 2 |
 |
0 | Conserved in stage 2 | Conserved in stage 2 |
R11 (R21): number of responses for subpopulation 1 (respectively subpopulation 2) at stage 1
d11 (d12): difference between observed rate of responses and expected rate of responses for subpopulation 1 (respectively subpopulation 2) at stage 1
δ1: threshold associated with a new risk to conclude for heterogeneity
ψ1: heterogeneity factor for stage 1
a1: stopping rules (minimum number of successes) for stage 1
Table 1: Decisions rules for stage 1.
| Heterogeneity test | ψ2 | Decision for subpopulation 1 | Decision for subpopulation 2 |
|---|---|---|---|
| If the two subpopulations are conserved | |||
 |
0 | Drug non-sensitive | Drug non-sensitive |
 |
0 | Drug sensitive | Drug sensitive |
 |
0 | Drug sensitive | Drug sensitive |
 |
1 | Drug sensitive | Drug non-sensitive |
 |
2 | Drug non-sensitive | Drug sensitive |
| If one subpopulation is conserved | |||
 |
0 | Drug non-sensitive | Not in stage 2 |
 |
1 | Drug sensitive | Not in stage 2 |
 |
0 | Not in stage 2 | Drug non-sensitive |
 |
2 | Not in stage 2 | Drug sensitive |
R.1 (R.2): cumulative number of responses for subpopulation 1 (respectively for subpopulation 2) at stage 2
d21 (d22): difference between observed rate of responses and expected rate of responses for subpopulation 1 (respectively subpopulation 2) at stage 2
a2: stopping rules (minimum number of successes) for stage 2
δ2: threshold associated with a new risk to conclude for heterogeneity
ψ2 is the heterogeneity factor for stage 2
a12 (a22): stopping rules (minimum number of successes) for subpopulation 1 (respectively subpopulation 2) for stage 2
Table 2: Decisions rules for stage 2.
Construction of Simon’s design of second stage in case of one remaining subpopulation after the first stage.
In case of heterogeneity in stage 1, we needed to recalculate a2, and devise a new Simon Minimax design for the remaining subpopulation, with the following constraints: the size of the first stage was already determined: ni1, the α and β risks were the same and π0= π0i and π1= π1i. In the end, we obtained: (ni1, ai1, n’i2, ai2).
Operating characteristics
Comparison was based on the maximum number of subjects necessary to reach a conclusion (maximum sample size), on the mean number of subjects necessary to reach a conclusion (expected sample size) and on the calculated type I and type II errors. Additionally, based on several hypotheses, we calculated the probability of reaching a conclusion (true final conclusion rate), the probability of detecting the drug non-sensitive subpopulation at the first stage and the probability of detecting the drug non-sensitive subpopulation at the second stage.
We presented several situations of the true efficacy rate in the two subpopulations (true success rate from 0.1 to 0.6, by 0.1 increments).
Type I and type II errors were selected: α = β = 10% and γ = 30%.
Two values of the ratio w between the two subpopulations were chosen: 1 and 2.
Finally, these results were compared with those of one single Simon design, on the two subpopulations, and with no possibility of highlighting subpopulation heterogeneity. Comparison was also performed with two independent Simon designs: two separate studies, one for each different subpopulation.
Example
The previously published REMAGUS 02 phase II clinical trial included two subpopulations of patients with breast cancer [13]. Approval was granted from the local ethics committee (Comités de Consultation pour la Protection des Personnes se prêtant à la Recherche Biomédicale [CCPPRB] Paris Nord) on 14/10/2003.
Subpopulation 1 comprised HER2 negative tumors that were treated with conventional chemotherapy in combination with celecoxib; subpopulation 2 comprised HER2 positive tumors that were treated with conventional chemotherapy in combination with trastuzumab. The two subpopulations were treated in a neoadjuvant setting and the primary endpoint was pathological complete response (pCR). For subpopulation 1, the minimum pCR rate was π0 = 15% and the expected pCR rate was π1 = 25%, with α = 9% and β = 10%. For subpopulation 2, the minimum pCR was π0 = 15% and the expected pCR rate was π1 = 30%, with α = 7% and β = 10%. The trial was initially planned according to two parallel Fleming two-stage designs.
We could have planned the same trial with our new adaptive design. Using our notations, we have (π01- π11; π02 - π12) = (15%-25%; 15%-30%), with α = 8% and β = 10% and γ = 30%. Finally, the value of w was selected at 2 because HER2 negative tumors are more frequent than HER2 positive tumors.
For the three designs (one single Simon design [SSD], the adaptive Simon design [ASD] and the two independent Simon designs [2ISD]), we presented the calculated expected sample size, the maximum sample size and the calculated type I and type II errors (Table 3).
| (Π01- Π11; Π02 - Π12) | w | Method | Maximum Sample Size | Expected Sample Size Under H00 | H01 / H10 | H11 | Calculated α | Calculated β |
|---|---|---|---|---|---|---|---|---|
| (0.1-0.3 ; 0.1-0.3) | 1 | SSD | 26 | 20.1 | 23.9 | 25.5 | 0.09 | 0.09 |
| 1 | ASD | 40 | 23 | 26.3 | 25.9 | 0.12 | 0.07 | |
| 1 | 2ISD | 50 | 40.7 | 45.1 | 49.5 | 0.18 | 0.01 | |
| (0.2-0.4 ; 0.2-0.4) | 1 | SSD | 36 | 28.3 | 33.7 | 35.6 | 0.08 | 0.09 |
| 1 | ASD | 47 | 29.8 | 34.7 | 35.7 | 0.09 | 0.09 | |
| 1 | 2ISD | 72 | 56.5 | 63.8 | 71.2 | 0.16 | 0.01 | |
| (0.3-0.5 ; 0.3-0.5) | 1 | SSD | 42 | 31.8 | 38.6 | 41.4 | 0.09 | 0.09 |
| 1 | ASD | 51 | 35.4 | 40.9 | 41.6 | 0.11 | 0.08 | |
| 1 | 2ISD | 78 | 72.4 | 75.1 | 77.9 | 0.17 | 0.01 | |
| (0.4-0.6 ; 0.4-0.6) | 1 | SSD | 46 | 30.2 | 39.4 | 44.3 | 0.09 | 0.09 |
| 1 | ASD | 50 | 34.1 | 42.4 | 44.8 | 0.09 | 0.09 | |
| 1 | 2ISD | 82 | 68.4 | 74.9 | 81.4 | 0.18 | 0.01 |
Results are provided under null, alternative or combined hypotheses with equal response rates under the null hypothesis where Δi =0.2, α = β = 0.1, γ = 0.3, with several scenarios of minimum efficacy rate (Π0.) and expected efficacy rate (Π1.).
Table 3: Maximal and expected sample sizes of the Single Simon design (SSD), the adaptive Simon design (ASD) and the two independent Simon designs (2ISD).
As expected, the maximum sample size was consistently greater with two independent Simon designs than with the adaptive Simon design. For values of (π01; π02) ≥ (0.20; 0.20) the difference in maximum sample size exceeds 20 patients: this was an increase of at least 130% in sample size for the two independent Simon designs compared to the adaptive Simon design.
Maximum sample size of one single Simon design was consistently less than the maximum sample size of the adaptive Simon design; however, a single Simon design did not determine the heterogeneity of a subpopulation. Furthermore, the difference between the maximum sample sizes decreased from 14 subjects (35%) for low values of (π01; π02;) such as (0.20; 0.20) to 4 subjects (8%) for higher values of (π01; π02;) such as (0.40; 0.40).
When w ≠ 1, the maximum sample size for the adaptive Simon design increased, making the adaptive design less advantageous (data not shown).
In the event of heterogeneity, the expected sample size was greater with the adaptive Simon test than with one single Simon design though the difference was consistently lower than 5 subjects. On the other hand, compared to the adaptive Simon test, the expected sample size with two independent Simon designs was much larger: 19 subjects (73%) for low (π01; π02;) values such as (0.10; 0.10) and 32 (76%) for higher values of (π01; π02;) such as (0.40; 0.40) under H01 or H10. This was an increase of 75% in sample size.
Calculated type I and type II errors were similar to the theoretical values for a single Simon design. For the adaptive Simon design, they were also similar to the theoretical type I and type II errors. For the two independent Simon designs, calculated type I error increased from 10 to 17% - 18%: this was a twofold increase of the value compared to the theoretical risk of 10%. On the other hand, calculated type II error was very low, around 1% for a theoretical value of 10%.
Probability of a true final conclusion at the first and second stage
We studied the probability of reaching a correct study conclusion at the first and second stage. Calculations were performed with the hypothesis of a binomial distribution of variates. Under H00 or H11, where there was no heterogeneity of the subpopulations, a single Simon design and an adaptive Simon’s design showed similar results, with error probabilities around 10%. Under H00 or H11, the two independent Simon designs had an error probability of around 20%.
In the event of heterogeneity, with the adaptive Simon design, the probability of correctly detecting heterogeneity varied according to the values of (π01- π11; π02; - π12). This probability had a calculated value of 40% for low (π01; π02;) values such as (0.10; 0.10) and fell to 25% for higher (π01; π02;) values such as (0.40; 0.40). These results did not change regardless of the value of w (data not shown).
With the two independent Simon designs, the probability of detecting a drug non-sensitive subpopulation was approximately 80%, regardless of the value of (π01-π11; π02;-π12). A single Simon design could not determine heterogeneity of subpopulations and was not compared.
Probability of detecting heterogeneity at the first stage
With the adaptive Simon design, the probability of detecting the drug non-sensitive subpopulation was consistently in the region of 10%, except for low values of (π01; π02;). These probabilities decreased when w > 1 (data not shown).
With two independent Simon designs, this probability was greater and varied between 16% and 51%. One single Simon design did not detect drug non-sensitive subpopulations at the first stage.
Probability of detecting heterogeneity at the second stage
With the adaptive Simon design, the probability of detecting the drug non-sensitive subpopulation varied between 15% and 28%. With two independent Simon designs, the probability varied between 35% and 67% and was greater for higher values of (π01; π02;).
One single Simon design did not detect the drug non-sensitive subpopulation at the second stage (Table 4).
| True final conclusion probability | Probability of detecting the non-sensitive subpopulation at first stage under several hypotheses | Probability of detecting the non-sensitive subpopulation at second stage under several hypotheses | ||||||||||
|---|---|---|---|---|---|---|---|---|---|---|---|---|
| (Π01- Π11; Π02- Π12) | H00 | H01 or H10 | H11 | H00 | H01 | H10 | H11 | H00 | H01 | H10 | H11 | |
| (0.1- 0.3 ; 0.1-0.3) | SSD | 0.9 | 0 | 0.9 | 0 | 0 | 0 | 0 | 0 | 0 | 0 | 0 |
| ASD | 0.87 | 0.37 | 0.83 | 0.13 | 0.11 | 0.11 | 0.02 | 0.02 | 0.28 | 0.28 | 0.06 | |
| 2ISD | 0.81 | 0.81 | 0.81 | 0.49 | 0.51 | 0.51 | 0.05 | 0.07 | 0.35 | 0.35 | 0.12 | |
| (0.2-0.4 ; 0.2-0.4) | SSD | 0.91 | 0 | 0.9 | 0 | 0 | 0 | 0 | 0 | 0 | 0 | 0 |
| ASD | 0.9 | 0.18 | 0.87 | 0.05 | 0.03 | 0.03 | 0.01 | 0.01 | 0.15 | 0.15 | 0.02 | |
| 2ISD | 0.83 | 0.82 | 0.81 | 0.49 | 0.45 | 0.45 | 0.04 | 0.07 | 0.42 | 0.42 | 0.13 | |
| (0.3-0.5 ; 0.3-0.5) | SSD | 0.9 | 0 | 0.9 | 0 | 0 | 0 | 0 | 0 | 0 | 0 | 0 |
| ASD | 0.88 | 0.24 | 0.87 | 0.13 | 0.08 | 0.08 | 0.01 | 0.01 | 0.17 | 0.17 | 0.03 | |
| 2ISD | 0.81 | 0.81 | 0.81 | 0.27 | 0.16 | 0.16 | 0.01 | 0.13 | 0.67 | 0.67 | 0.17 | |
| (0.4-0.6 ; 0.4-0.6) | SSD | 0.9 | 0 | 0.9 | 0 | 0 | 0 | 0 | 0 | 0 | 0 | 0 |
| ASD | 0.88 | 0.24 | 0.87 | 0.12 | 0.01 | 0.09 | 0.01 | 0.01 | 0.16 | 0.16 | 0.02 | |
| 2ISD | 0.81 | 0.81 | 0.81 | 0.42 | 0.31 | 0.31 | 0.02 | 0.11 | 0.54 | 0.54 | 0.15 | |
Results are provided under null (H00), alternative (H01 or H10) or combined hypotheses (H11) with equal response rates under the null hypothesis, Δi =0.2, w=1, α = β = 0.1 and γ= 0.3, with several scenarios of minimum efficacy rate (Π0.) and expected efficacy rate (Π1.).
Table 4: Operating characteristics of the single Simon design (SSD), the adaptive Simon design (ASD) and the two independent Simon designs (2ISD).
If gamma increased, the probability of correctly detecting heterogeneity increased, with an increase in the type I error (data not shown). We chose to present our calculations with an intermediate value of gamma of 30%.
Figure 1showed the probability of finding drug efficacy for at least one subpopulation with (π01-π02;) = (0.2-0.2), (π11-π12) = (0.4-0.4), w = 1, α = 0.1, β = 0.1, and γ = 0.3 with one single Simon design on the left and the adaptive Simon design on the right. The x axis showed the real drug efficacy rate for subpopulation A, π1 and on the y axis, the real drug efficacy rate for subpopulation B, π2.
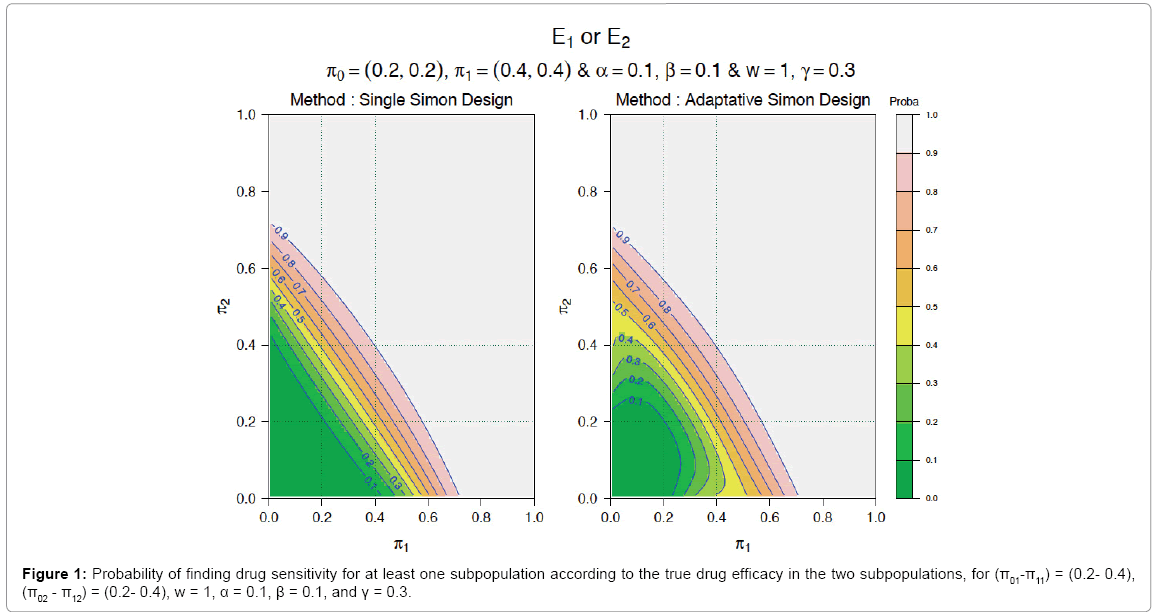
Figure 1: Probability of finding drug sensitivity for at least one subpopulation according to the true drug efficacy in the two subpopulations, for (π01-π11) = (0.2- 0.4),
(π02 - π12) = (0.2- 0.4), w = 1, α = 0.1, β = 0.1, and γ = 0.3.
We considered the situation where population 1 was drug sensitive (0.20 ≤π1 ≤0.40) and population 2 was drug non-sensitive (π2 < 0.20). With the single Simon design, there was only a small probability below 10% to conclude for drug efficacy. On the other hand, with the adaptive Simon design, there was a probability up to 40% to conclude for drug efficacy (see red and blue triangle in Figure 1).
Example
In the REMAGUS 02 clinical trial, with the two parallel Fleming two-stage designs, the sample size of subpopulation 1 was 112 patients and that of subpopulation 2, 62 patients. In subpopulation 1, a pCR of 13% was noted and the null hypothesis could not be rejected. In subpopulation 2, the pCR was 26% and the null hypothesis could be rejected.
With our novel adaptive design and using the same data, the results were as follows: in the first stage, in subpopulation 1, 32 patients were included and 4 responses noted; in subpopulation 2, 16 patients were included and 5 responses noted. To proceed to the second stage, a minimum of a1 = 8 responses was necessary (Figure 2).
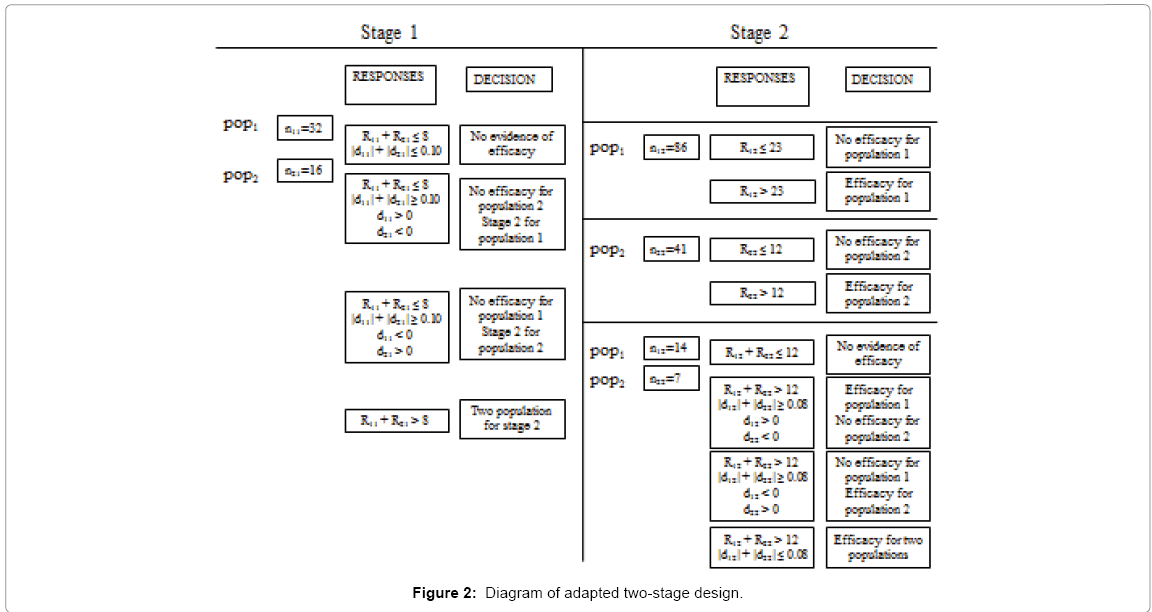
Figure 2: Diagram of adapted two-stage design.
We had R.1 = 9 and R.1 > a1. This was the C1C2 situation, i.e. continuation to stage 2 for the two subpopulations.
The second stage was conducted: 14 patients were included in subpopulation 1, and 7 in subpopulation 2. At the end of the two stages, the total number of responses in subpopulation 1 was 6 and in subpopulation 2, 7. The overall minimum number of responses at stage 2 was 12, thus showing global drug inefficacy.
Heterogeneity of the two subpopulations was tested:
d1=7/(16+7)-0.15 = 0.15435,
d2=6/(32+14)-0.15 = -0.01957
With γ = 30%, we calculated δ2 =0.0822 and
|d1|+|d2|=0.1739 > δ2.
This was the situation where Ψ2=1.
We concluded that heterogeneity was indeed shown.
Drug inefficacy was initially presumed for the two subpopulations but because of the heterogeneity, efficacy was demonstrated in subpopulation 2.
In the end, the total number of patients included was 69, instead of 174 with the two independent Fleming tests. The conclusions remained identical however, i.e., an inefficacy of celecoxib in HER2 negative tumors, and a clear efficacy of trastuzumab in HER2 positive tumors.
We proposed an innovative design adapted from Simon’s Minimax design. By applying one single two-stage design in two potentially different subpopulations, we were able to compare two observed rates of efficacy with two expected rates of efficacy. At the end of the first stage, one could conclude for drug inefficacy either one or two subpopulations. At the end of the second stage, for the one (or the two) subpopulation(s) in whom drug inefficacy was not shown at the first stage, conclusion for drug efficacy or drug inefficacy was possible.
To assess the efficacy of a drug in 2 subpopulations, three situations are possible. Firstly there is a rationale that drug efficacy is realistic in the two subpopulations and one single Simon design can be planned with the two subpopulations all together. Secondly, there is a rationale that the drug does not show efficacy in one subpopulation and one single Simon design can be planned without the likely non-sensitive subpopulation. Thirdly, drug efficacy is realistic in one subpopulation and we have no idea of drug efficacy in the second subpopulation: this is where our design can be useful. Two independent Simon design can be planned, but the interest of our new design is to perform one single clinical trial instead of two, to include a limited number of additional subjects, while keeping the possibility to determine if drug efficacy in one or two subpopulations.
We chose to adapt Simon’s Minimax design instead of Simon’s Optimal design, although our design can be easily adapted from the Optimal design. Simon’s Minimax design is constructed so that the maximum size of the sample is the lowest possible. In two potentially different subpopulations, it could not be assumed that the observed efficacy rate was similar to the expected efficacy rate. There was therefore a risk of increasing the sample size if a Simon’s Optimal based-design was used, whereas limiting the maximum sample size appeared more appropriate. Also, this could prove useful when disease prevalence was low [14].
Maximum expected numbers of subjects and expected numbers of subjects in the event of heterogeneity were consistently lower with our approach than with two independent Simon designs. Reach this conclusion with two independent Simon designs required a considerable increase in sample size, in some cases of up to 175%.
With the adaptive Simon design, calculations have shown that type I and type II errors were well controlled and were similar to theoretical risks. We have chosen to present results where two independent Simon designs were constructed with a type I error equal to that of one single Simon design. With this hypothesis, there was already a significant increase in sample size. If we had constructed the two independent Simon designs such that the calculated type I error was smaller than that of a single Simon design, the increase in sample size would have been considerably greater.
Probability of concluding for heterogeneity was lower with the adaptive design than with the two independent Simon designs: the difference was often around 50%. However, this must be balanced against the increase in sample size and with logistical complexity if two Phase II trials had to be performed instead of one.
We recommended constructing the adaptive Simon design with identical numbers (w = 1) of subjects in the two subpopulations, because when w was greater than 1, the sample size increased. The ratio between the two subpopulations could however be chosen freely: it could be similar to that of over-expression of a biomarker in a particular tumour type.
When this new design was developed, we chose to test for heterogeneity if the drug efficacy rate was particularly low. We could have chosen to test for heterogeneity in the event of a particularly high drug efficacy rate. The latter approach could also prove useful but only if one drug non-sensitive subpopulation were compared with another subpopulation showing significant drug sensitivity. However, a situation such as this is rare in clinical practice.
One limitation of our design was the impossibility to determine which subpopulation benefited the most from the drug. If the two subpopulations were drug sensitive, the design did not identify the most appropriate subpopulation for Phase III. Another limitation was the relatively low probability of highlighting heterogeneity. One could argue that the probability of detecting heterogeneity remained possible, whereas this was not the case with one single Simon design. Furthermore, only one trial was to be performed instead of the two required if independent Simon designs were used. Another benefit was the small increase in sample size, compared to the two independent Simon designs.
One could also argue that in the event of heterogeneity, the sample size of the subpopulation in the second step was larger than the sample size required for the second step in a single Simon design. Although this was true, including more patients from the subpopulation where the drug showed potential efficacy was not unethical and might provide a better evaluation of the toxicity of the new drug and a more accurate estimate of the response rate [15].
Our team has recently developed an adaptive method based on Fleming’s design and adapted to two different subpopulations [16]. This method made it possible to conclude for efficacy or inefficacy at each stage. Our design did not allow the trial to be discontinued early in the first stage in the event of efficacy. We did not perform a strict comparison of the statistical properties of these two designs. As Fleming’s adaptive design provided a bilateral conclusion, it required a larger maximum sample size.
Another design developed from Simon’s design was proposed by Jones and Holmgren [12]. Here, the subpopulations were ranked for the first stage, according to the presence of a predictor of response (subpopulation A), such as a biomarker, or absence of a predictor of response (subpopulation B). For the first stage, each subpopulation was included in an independent Simon design. According to the results of the first stage, the study plan varied: if subpopulation B was drug sensitive, a second stage was carried out in a mixed population, A and B, and the biomarker was no longer considered predictive. However, if only subpopulation A was drug sensitive, the trial continues to the second stage, in this subpopulation alone. This design was different because it was based on ranked subpopulations. Our design was more general because at the beginning of the trial, the two subpopulations were considered equally.
Finally, our design was presented for phase II trials in oncology, but can also be helpful for others specialities, such as pain related trials. The end point only needs to be binary.
In conclusion, phase 3 trials can fail and lead to termination of drug development [17]. In these trials, one reason for the lack of success is the inclusion of heterogeneous subpopulations [11]. When the drug fails to show efficacy, analyses of subgroups are performed to detect a potentially drug sensitive subpopulation. However, these analyses are not pre-determined and their findings are only indicative. Thus, identifying pre-determined, clearly designated subpopulations who are sensitive to a drug after phase II trials is particularly important. Stratified adaptive design such as ours, optimizes the subpopulation entering Phase III trials [18].
In this article, we described an adaptive two-stage design with interesting statistical properties. The design was easy to implement and enabled detection of heterogeneity in two subpopulations at the first or second stages, with only a minor increase in sample size and preservation of type I and type II errors.
Another interesting feature of this design was is that it could be used in different situations of drug development. In the context of one single phase II clinical trial, it can determine whether different subpopulations of patients (for instance elderly and non-elderly), or different biological subtypes of tumours (for instance with or without a biomarker that is potentially predictive of efficacy) showed different response rates to a drug.
Such results in a single clinical trial are both time- and patienteffective. They can be crucial in the development of targeted therapies in cancer.
The authors would like to thank the following persons for allowing us to use the REMAGUS 02 clinical trial data:
Dr B Asselain, Service de Biostatistiques, Institut Curie, Paris.
Pr J Y Pierga, Service d’Oncologie Médicale, Institut Curie, Paris.
Pr M Marty, Centre des Innovations Thérapeutiques en Oncologie et Hématologie, Hôpital Saint Louis, Paris.