Journal of Research and Development
Open Access
ISSN: 2311-3278
![]() +44-77-2385-9429
+44-77-2385-9429
ISSN: 2311-3278
![]() +44-77-2385-9429
+44-77-2385-9429
Review Article - (2024)Volume 12, Issue 1
The objective of this ongoing work is to refine the European Pipeline Research Group’s (EPRG) methodology for fatigue life assessment of unconstrained single peak plain dents in pipelines under cyclic internal pressure. EPRG 2000 was recently adopted by the American Petroleum Institute (API) and American Society of Mechanical Engineers (ASME) (API 579/ASME FFS) as an alternative approach recommended for Level 2 plain dent fatigue life assessment. EPRG 2000, along with its earlier version, EPRG 1995, has been commonly used for dent integrity assessment in North America and worldwide because it is recommended by the highly recognized Pipeline Defect Assessment Manual (PDAM). However, Pipeline industry practice in North America found that the EPRG equations provide conservative, in many cases, very conservative predictions that resulted in unnecessary excavations and repairs. Therefore, improving the model’s accuracy and level of conservatism is essential from both safety and costeffective perspectives. In this paper, a critical review of EPRG 2000 fatigue life prediction models is performed first, which provides a basis for improvement. Development and validation of the newly improved and further refined model are then discussed. Firstly, the refinement is based on extensive dent fatigue testing conducted by the Pipeline Research Council (PRCI) (ref). Then, a comparison between the newly improved EPRG model and (PRCI) funded additional full-scale-fatigue testing and modeling adopted by API Recommended Practice 1183 (API RP 1183) Level 2 and PRCI Level 3 models is made. This ongoing work provides a methodological framework to advance studies in dent interaction with welds, gouges, cracks, and corrosion.
Pipelines; Pipeline Defect Assessment Manual (PDAM); Pipeline Research Council (PRCI); Gouges; Corrosion
Pipelines can be mechanically damaged by external force from thirdparty intrusion, contact with rocks in the backfill, or by settlement onto rocks [1-3]. A dent is defined as a local inward depression in the pipe surface caused by an external force that produces pipe wall plastic deformation and a disturbance in the curvature of the pipe from its original shape. Dents can be commonly characterized by the following six types [2,3].
1. Plain dent, i.e., dent without geometrically coincident features, e.g., corrosion, gouge, weld. A plain dent is further categorized as a dent that causes a smooth change in the curvature of the pipe wall [1].
2. Dent with coincident features, e.g., corrosion, gouge, weld.
3. Single peak dents.
4. Multiple peak dents.
5. Constrained (Restrained).
6. Unconstrained (Unrestrained) dent.
Dents have caused frequent pipeline failures [4-7]. However, failures from plain dents alone are rare [1,2]. Plain dents do not have direct or immediate consequences. Dents with additional surface mechanical damage have resulted in immediate failure approximately 80 percent of the time [4,5]. In the remainder of mechanical damage events, dents, including plain dents, were not severe enough to cause immediate failure. However, it may lead to delayed pressure-cycle fatigue. The Department of Transportation (DOT) [7,8] and the Fuel Manufacturers Association in Brussels, Belgium (CONCAWE) [7,9] reported this type of fatigue failure in about 8.3% and 6% of the reported failures, respectively. Because of its importance, extensive efforts have been made worldwide to identify factors associated with time-delayed fatigue failure using both experimental and analytical approaches since the late 1950s [9-11]. The capability of a damaged, dented pipeline to withstand pressure cycles has been the subject of numerous studies worldwide [12-35], and numerous methods for performing dent fatigue assessments are now available for pipeline operators [3-8,13-16]. For example, EPRG proposed two methods: One published in 1995 and other in 2000 [34,15]. The PDAM called them EPRG 1995 and EPRG 2000, respectively. Moreover, standards and recommended practices have been established, specifically the recently published API RP1183 for Dent Assessment and Management [36]. It is noted that EPRG 2000 has been adopted and incorporated into API 579 [6]. API RP 1183 refers to it as the EPPRG/ 576 approach and recommends it as an alternative for level 2 plain dent fatigue life assessment (contrary to thepractice of 1183, the EPRG model is applicable to both plain dents and dents with gouges). For clarity and originality, we call it EPRG 2000 instead of the EPRG/API approach in this study throughout the paper.
EPRG 2000 and its earlier version, EPRG 1995, have been commonly used for plain dent fatigue life assessment in North America and worldwide because it is recommended by the highly recognized PDAM. However, pipeline industry practice in North America found that the EPRG models provide conservative, in many cases, very conservative predictions that resulted in unnecessary excavations and repairs. Therefore, the objective of this investigation is twofold: (1) improving the model accuracy and level of conservatism from both a safety and cost-effective perspectives, and (2) providing a more realistic equation that pipeline operators can easily use for fatigue life assessment with confidence and less conservatism.
In this paper, a review of the scientific basis for the EPRG 2000 model is performed and presented first, which provides a basis for the improvement. Then, the EPRG 2000 Equation is improved and further refined utilizing the most recent PRCI Mechanical Damage (MD) project MD 4-2 full-scale fatigue testing data [37]. Validation of the refined model with MD 4-11, 4-14, and 4-15 data [38,39] is also presented. A comparison of the accuracy and conservatism between the refined EPRG model and the original EPRG 2000 is made to demonstrate that the refined model is significantly better than the EPRG 2000 from both a safety and cost-effective perspective. Finally, the newly refined model is compared with API RP 1183 Level 2 and PRCI MD 4-2 Level 3 models to demonstrate the benefits of the improved model over API RP 1183 Level 2 and PRCI MD 4-2 Level 3. This ongoing work provides a methodological framework to study further dent interaction with welds, gouges, cracks, and corrosion.
Review of the scientific basis of the EPRG 2000 model
EPRG 2000 was developed based on the fundamental understanding of the commonly used S-N fatigue life in the Basquin equation but reversed its independent variable (A) and dependent variable (N). In a logarithmic scale, the Basquin equation is seen as a straight line, usually called an S-N curve.
N = C(A)m ….1
where A is material and stress-related, the independent variable; N is Cycles to Failure, the dependent variable; and C and m are the coefficients and index of the Basquin equation. The C and m are constants for a specific class of materials.
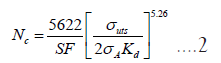
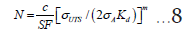
In other words, the development of the EPRG model is based on the scientific understanding of the factors that equate the fatigue life to a function that includes material strength, pipe geometry, dent geometry, and depth [1]. The formulations are shown in equations (2) through (7), which show the independent variable, A, is a function of the material’s Ultimate Tensile Strength (UTS), cyclic loading condition σA, and stress concentration factor Kd due to the presence of plain dent:
• σUTS: The Ultimate Tensile Strength, Equation (7). As a commonly accepted fact, the higher the σUTS is, the longer fatigue life N will be Equation (2) [40,41].
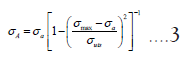
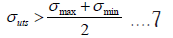
• σA: The equivalent stress amplitude accounting for the mean stress effect, Equation (3). The higher the σA is, the lower the fatigue life N will be, Equation (2).
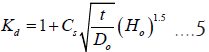
• Kd: The stress concentration factor for plain dents due to the presence of dents, Equation (5), where Cs=2 for smooth dents with dent radius >5t and Cs=1 for sharp dents with dent radius <5t, Ho=dent depth measured at zero internal pressure (mm), t=wall thickness and D=outside diameter.
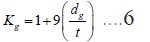
• Kg: The stress concentration factor for dent interacting with gouge, Equation (6). Kg is not relevant to the present study and will not be used.
Where,
SF=Safesty Factor=10 for API 579
• σUTS=Ultimate tensile strength, Mpa
• σA=Stress amplitude at mean stress correction using Gerber model or equivalent nominal fatigue stress range, Mpa
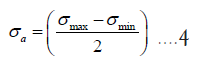
• σA=Stress amplitude, Mpa
• σmax=Maximum stress, Mpa
• σmin=Minimum stress, Mpa
Where,
Kd=Stress concentration factor due to dent
Kg=Stress enahancement factor for gauge=1.0 when guage is not present
dg=Maximum depth of the guage, mm=0 (assumed)
H0=Dent depth when not pressurized, mm
Cs=Dent shape factor, 2.0 for smooth dent (rd ≥ 5 t) and 1.0 for sharp dent (rd<5t)
t=Pipe wall thickness, mm
D0=Pipe outside diameter, mm
rd=Radius at the base of dent, mm
However, although the EPRG 2000 model is built on the scientific understanding of the factors affecting S-N fatigue life for unconstrained plain dent, the EPRG 2000 model is semi-empirical. The model adopted the S-N equation from the German Institute for Standards DIN 2413-1:1993-10 part 1, resulting in extremely conservative results. DIN 2413-1:1993-10 part 1 is a German standard for the design of steel pressure pipes and is now withdrawn [15,32]. A detailed review of the EPRG 2000 methodology and its development revealed that some unnecessary factors are involved in the method [32]. This study has attempted to develop a more realistic estimation of dent fatigue lives, presented in the following section.
Improvement of the EPRG 2000 equation
For the improvement of the EPRG 2000 equation, the following approach is used:
• Based on the understanding of the scientific basis, the EPRG 2000 formula remains unchanged for the improvement:
• Instead of selecting c and m from any existing dent-free S-N curves, the least squares linear regression in logarithmic scale (the above equation renders itself as a straight line) is used to determine c and m utilizing the PRCIMD 4-2 full-scale fatigue testing data for the improvement.
• σUTS and σA are the same as the data points in the PRCI MD 4-2 report [42].
• Kd is a function of OD (the pipe outer diameter),wt (the pipe wall thickness), Ho (the dent depth at zero pressure), and Cs (the dent shape factor):
Kd = Stress concentration factor due to dent =
Cs = 2 for smooth dents with radius >5t
Cs = 1 for sharp dents with radius <5t
Because the outer diameter of the pipe, D, and wall thickness, t, are given in the PRCI MD 4-2 report, only Kd, Ho, and Cs are unknown. Therefore, Kd is back-calculated (Cs and Ho are buried in Kd) from the EPRG 2000 predicted cycles to failure in DOT #432 closeout report as used by Zhang et al. [43,32].
Back-calculated Kd
A Microsoft spreadsheet is compiled for back-calculating Kd. In the table, Column 8 is the back-calculated Kd. Column 9, i.e., the last column, is the EPRG 2000 predicted cycles to failure N using the back-calculated Kd in Column 8. Column 7 is BMT’s EPRG 2000 predicted cycles to failure N [43]. The N values in Column 7 are the same as in Column 9, indicating that the back-calculated Kd values are correct. Therefore, these back-calculated Kd values will be used to improve EPRG 2000, which will be presented in the following section (Table 1).
| 1 | 2 | 3 | 4 | 5 | 6 | 7 | 8 | 9 |
|---|---|---|---|---|---|---|---|---|
| Spec.# | Pipe identification | OD (mm) | WT (mm) | SMYS Mpa | SMUTS Mpa | EPRG 2000 predicted cycles to failure N by BMT [40] | Back calculated Kd | Check N with the back calculated parameters |
| 7 | A | 609.6 | 7.9 | 358 | 455 | 2206 | 1.897 | 2206 |
| 8 | A | 609.6 | 7.9 | 358 | 455 | 441 | 2.576 | 441 |
| 9 | A | 609.6 | 7.9 | 358 | 455 | 263 | 2.842 | 263 |
| 10 | A | 609.6 | 7.9 | 358 | 455 | 345 | 2.700 | 345 |
| 11 | A | 609.6 | 7.9 | 358 | 455 | 435 | 2.583 | 435 |
| 12 | A | 609.6 | 7.9 | 358 | 455 | 1155 | 2.145 | 1155 |
| 13 | B | 609.6 | 8.9 | 482 | 565 | 212 | 2.663 | 212 |
| 14 | B | 609.6 | 8.9 | 482 | 565 | 322 | 2.459 | 322 |
| 15 | B | 609.6 | 8.9 | 482 | 565 | 179 | 2.750 | 179 |
| 16 | B | 609.6 | 8.9 | 482 | 565 | 176 | 2.758 | 176 |
| 17 | B | 609.6 | 8.9 | 482 | 565 | 641 | 2.157 | 641 |
| 18 | B | 609.6 | 8.9 | 482 | 565 | 690 | 2.127 | 690 |
| 48 | C | 457.2 | 7.9 | 358 | 455 | 432 | 2.587 | 432 |
| 52 | C | 457.2 | 7.9 | 358 | 455 | 278 | 2.813 | 278 |
| 54 | C | 457.2 | 7.9 | 358 | 455 | 4393 | 1.664 | 4393 |
| 56 | C | 457.2 | 7.9 | 358 | 455 | 624 | 2.412 | 624 |
| 57 | C | 457.2 | 7.9 | 358 | 455 | 1167 | 2.141 | 1167 |
Table 1: A comparison of the number of cycles to failure predicted by EPRG 2000 using the back-calculated Kd in the last column and predicted by BMT in seventh column, showing they are the same [40].
The new EPRG equation
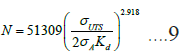
In accordance with the approach discussed, PRCI MD-4-2 full-scale testing data was used to improve the EPRG 2000 S-N equation. The least squares linear regression method is used to establish the new S-N correlation. Figure 1 shows the PRCI MD 4-2 testing data and new EPRG S-N equation obtained by the least squares linear regression, i.e., Equation (9), in which c=51309 and m=2.918 in metric units (Figure 1).

Figure 1: A plot of PRCI MD-4-2 full-scale testing data and the new EPRG equation obtained by least squares linear regression.
To demonstrate the effectiveness of the improved EPRG equation in fatigue life prediction, error analyses of the predictions by the new EPRG and the original EPRG 2000 equations are made. The average error between PRCI MD-4-2 testing data and the improved EPRG equation prediction is -6.7%, see Table 2, which is less than 1.1 times the overestimation of fatigue life. On the other hand, as per the Pipeline and Hazardous Materials Safety Administration (PHMSA) MEGA rule for pipelines in High Consequence Areas (HCA), a safety factor of 5 is required. In this case, the SF=5 is equivalent to the confidence level of 97% based on one-tail confidence analysis [44]. The pipeline should be safe and cost-effectively managed. The large standard deviation of the improved EPRG equation may be attributed to the uncertainty in the back-calculated Kd due to Ho and will be one of the ongoing topics for investigation (Table 2).
| Spec.# | Pipe identification | N from PRCI MD 4-2 full scale testing | N predicted by the original EPRG 2000 | Error = (NMD4-2-NEPRG2000)/NMD4-2 | N predicted by the improved EPRG 2000 | Error = (NMD4-2-NimprovedEPRG2000)/NMD4-2 |
|---|---|---|---|---|---|---|
| 7 | A | 21103 | 2206 | 90% | 30375 | -44% |
| 8 | A | 28211 | 441 | 98% | 12435 | 56% |
| 9 | A | 6825 | 263 | 96% | 9335 | -37% |
| 10 | A | 9116 | 345 | 96% | 10852 | -19% |
| 11 | A | 15063 | 435 | 97% | 12341 | 18% |
| 12 | A | 27575 | 1155 | 96% | 21214 | 23% |
| 13 | B | 13262 | 212 | 98% | 8283 | 38% |
| 14 | B | 15065 | 322 | 98% | 10444 | 31% |
| 15 | B | 4035 | 179 | 96% | 7541 | -87% |
| 16 | B | 4684 | 176 | 96% | 7470 | -59% |
| 17 | B | 11415 | 641 | 94% | 15302 | -34% |
| 18 | B | 15949 | 690 | 96% | 15940 | 0% |
| 48 | C | 23482 | 432 | 98% | 12294 | 48% |
| 52 | C | 9226 | 278 | 97% | 9627 | -4% |
| 54 | C | 47702 | 4393 | 91% | 44511 | 7% |
| 56 | C | 15473 | 624 | 96% | 15076 | 3% |
| 57 | C | 14091 | 1167 | 92% | 21336 | -51% |
| - | - | - | Average error | 95.60% | - | -6.7% |
| - | - | - | stdev | 2.60% | - | 40.70% |
Table 2: Comparison of the cycles to failure predicted by EPRG 2000 and the improved EPRG 2000 against the PRCI md 4-2 full-scale fatigue test data.
In contrast, the average error between the EPRG 2000 prediction and the PRCI MD 4-2 experiment is 95.5%, Table 2. The average error of 95.5% means that EPRG 2000 is nearly 20 times, i.e., about one order of magnitude under-prediction of the cycles to failure. In addition, the developer recommends a safety factor of 10 for the EPRG 2000 equation, that is, more than two orders of magnitude conservatism, which may have resulted in many unnecessary excavations and is unacceptable.
From the above error analyses, the improved EPRG equation is much better than the original ERRG 2000 equation for fatigue life prediction. The improvement is significant.
Further improvement of the new EPRG equation
Further improvement of the new EPRG equation is made for a better comparison with the PRCI MD 4-2 Level 3 assessment approach. Two modifications to the improved EPRG Equation are made: (1) rounding up the exponent constant m=2.918 to 3 to be consistent with British Standard (BS) 7608 Class D used by PRCI MD 4-2 Level 3 and Paris Law for steels and (2) rounding down the pre-exponent constant=51,018 to 50,000 to compensate the roundup of m [42,45]. The further refined equation for ERPG 2000 is shown as follows:
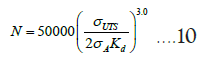
• It is noted that the refinement does not alter the scientific basis of the EPRG approach  The refined equation is slightly more conservative than the improved equation. Figure 2 compares the refined (Line B) and improved EPRG (Line A) equations. The figure shows that the conservatism depends on the value of
 For
For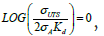 there is no difference in the predicted cycles to failure; the larger the value of
 the bigger the difference will be. The maximum difference in predicted cycles to failure in the figure is (1760- 1600)/1760=9% on the conservative side, which is relatively small and insignificant (Figure 2).

Figure 2: A comparison of the further refined (Line B) and original improved (Line A) equations.
With the further refined model, prediction error analysis was performed against the PRCI MD 4-2 full-scale test data. Table 3 and Figure 3 show that the average prediction error and standard deviation are -1% and 38%, respectively, which is slightly better than the improved EPRG equation predictions (average error: -6.7% and stdev 40.7%). The reason for the smaller average error and the standard deviation is unclear, which may indicate that the deterministic value of m=3 is a better exponent associated with a class of material like carbon steels [45]. It is important to note that these comparisons do not incorporate a safety factor (Table 3 and Figure 3).
| N from PRCI MD 4-2 full scale testing | N predicted by the new EPRG 2000 | New model prediction error (NMD4-2 - NNEWPRG2000) | Error=(NMD4-2-NNEWPRG2000)/NMD4-2 |
|---|---|---|---|
| 21103 | 29326 | -8223 | -39% |
| 28211 | 11708 | 16503 | 58% |
| 6825 | 8719 | -1894 | -28% |
| 9116 | 10178 | -1062 | -12% |
| 15063 | 11617 | 3446 | 23% |
| 27575 | 20275 | 7300 | 26% |
| 13262 | 7710 | 5552 | 42% |
| 15065 | 9786 | 5279 | 35% |
| 4035 | 7001 | -2966 | -74% |
| 4684 | 6934 | -2250 | -48% |
| 11415 | 14492 | -3077 | -27% |
| 15949 | 15113 | 836 | 5% |
| 23482 | 11571 | 11911 | 51% |
| 9226 | 8999 | 227 | 2% |
| 47702 | 43438 | 4264 | 9% |
| 15473 | 14271 | 1202 | 8% |
| 14091 | 20395 | -6304 | -45% |
| - | - | Average error | -1% |
| - | - | stdev | 38.00% |
Table 3: Comparison of the cycles to failure predicted by the modified EPRG equation against the PRCI MD 4-2 full-scale fatigue test.

Figure 3: The plot of PRCI MD-4-2 full-scale test data and the refined EPRG equation 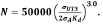
Validation of the refined EPRG equation against PRCI md 4-11, 4-14, and 4-15 data
Section 8.2.5 of API RP 1183 states that the Level 3 approach is the most general treatment of dent fatigue life assessment [3]. The models should be validated to demonstrate that they agree with full-scale testing data and comply with the Level 3 modeling requirements of API 579 Fitness-For-Service, PART 12 (12.4.4.2) [46]. In the same section, API RP 1183 indicates it is desirable to have simplified approaches that do not require Finite Element Analysis (FEA). Because the refined EPRG equation is considered to be a simplified Level 3 approach, validation of the refined EPRG 2000 equation with more full-scale testing data is essential and presented below (Figure 4).

Figure 4: Validation of refined EPRG 2000 model with PRCI MD 4-11 4-14 and 4-15 full-scale testing date, showing all the data points are above SF=2 line except three out of eleven test data of field dents.
Figure 4 shows that all the PRCI lab test data, MD 4-2, MD 4-11, and MD 4-14, MD 4-15, are above the SF=2 line except for three out of eleven test data of field dents, MD 4-15 data, that are below [38,47-49]. However, and more importantly, all the data points (MD 4-2 to MD 4-15) are well above the SF=5 line, indicating that the improved model satisfies the PHMSA MEGA rule [50].
The scatter band for field dent test results is slightly higher than the test results on lab-fabricated dents. The higher scatter band for field dents compared to the lab-fabricated dents is expected, considering that the lab-fabricated dents were in controlled conditions [50]. The field dents tested were all removed from former in-service pipelines donated by different pipeline operators and formed under different operating conditions.
Comparison of the refined EPRG equation with BS 7608 Kr and FEA-based model
As discussed in the previous section, API RP 1183 indicates that it is desirable to have simplified approaches that do not require Final Element Analysis (FEA) for dent fatigue life assessment. Because the refined EPRG Equation developed here by this study is considered as the simplified Level 3 approach without FEA, a comparison of the refined EPRG with the PRCI Level 3 model (i.e., BS7608 Class D and FEA-based Sr model) is made to see whether the fatigue life predictions of the refined EPRG model is comparable to that of Level 3 model or not.
PRCI level 3 approach-A brief review
PRCI MD 4-2 projects adopted BS 7608 Class D mean-1sd stress- range Sr-based S-N correlation, Equation 11, for unconstrained single peak plain dent fatigue life prediction [42].
log10(N) = 12.3912−3log10(Sr) ……11
To easily compare Equation 11 with the refined EPRG Equation (10), the logarithm format of Equation 11 is converted to the Basquin equation format. This makes BS7608 Class D mean-1sd equation (11) in the Power Law format, Equation 12.
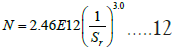
where the pre-exponent constant is C=2.46E12 and the Power m=3. Sr is the stress range in any one cycle (in N/mm²), which is the only variable in the equation. Even though EPRG has an analytical formula for Sr in 1995 and 2000 which was recommended by PDAM in 2004 and reviewed by Baker for an unconstrained plain dent in 2000, PRCI MD 4-2 still recommends using FEA to determine Sr [34,15,16].
Further comparison between Equation (12) with the refined EPRG equation (10) found no σuts in Equation (12), i.e., no materials’ strength property in the equation. This observation has been confirmed in the literature which indicates BS 7608 weld Fatigue lives that “are not dependent on the material because welds are known to contain small cracks from the welding process [51]. As a result, most of the fatigue life is spent on growing these small cracks. Fatigue lives are not dependent on material because all structural steels have about the same crack growth rate.” This fact is certainly not true for an unconstrained plain dent in base metals, even with the same material class. As discussed previously, the higher σUTS is, the longer fatigue life N will be [40,52-54]. Therefore, this may be one of the fundamental issues with formulating the PRCI Level 3 approach.
The stress range Sr distribution for each unconstrained plain dent from PRCI MD-4-2 and 4-11 were determined by FEA and is shown in Figure 5 (a). The maximum Sr is extracted and used for fatigue life predictions using Equation (12), the BS 7608 Class D mean-1sd S-N Design equation [42]. The FEA model predicted fatigue life for unrestrained plain dents prediction is shown in Figure 5 (b). In the plot, the Y-axis is the Stress Range, Sr, and the X-axis is the cycles to failure (Figures 5a and 5b).

Figure 5: FEA Stress Range (a) Sr mapping and (b) the predicted fatigue life based on Sr, equations 12 [37].
In the refined EPRG equation plot, the Y-axis is the dependent variable, i.e., cycles to failure N, while the X-axis is the independent variable, i.e., which is the opposite of that used by the PRCI plot. In addition, the PRCI plot only includes two sets of test data, i.e., MD 4-2 and MD 4-11 data with two lines: Model prediction and model prediction minus one standard deviation (1 stdev). Therefore, two changes are made to the Refined EPRG plots for comparison.
Figure 6 shows two model plots: (a) the refined EPRG model and (b) the PRCI Level 3 model. In the figure, the dashed lines are the model predictions, and the solid lines are the model predictions minus one standard deviation. Because the data points above and between the model prediction and minus one standard deviation are nearly the same, it suggests that both models are comparable and equivalent (Figures 6a and 6b).

Figure 6: Comparison of (a) the refined EPRG model prediction and (b) PRCI Level 3 FE Predictions, showing the refined EPRG model and PRCI Level 3 model are equivalent.
Execution of the refined EPRG model: Excel based software
A comparison of the refined EPRG model and PRCI Level 3 FEA approaches has clearly demonstrated that the refined EPRG model is indeed equivalent to the simplified Level 3 API RP 1183. The execution of the refined EPRG equation can be simply accomplished by using an excel-based software using In-line Inspection (ILI) or field excavation data. The software requires seven inputs; dent depth under Pressure Hp, Outer Diameter (OD) and wall thickness wt of the pipe, minimum pipe body ultimate strength σUTS, maximum and minimum cyclic pressures Pmax, Pmin, and the dent shape factor Cs. There are two outputs for the model predictions of cycles to failure: One for refined EPRG and another for the original EPRG 2000. In addition, the software allows the operator to select the safety factor for each model based on the operator’s integrity management plans or PHMSA’s rule. Figure 7 shows the screenshots of the software.

Figure 7: Excels based software showing seven inputs for the calculation and two outputs for cycles to failure of unconstrained single peak plain dent: One for the refined ERPG 2000 and one for the original EPRG 2000.
Recently, a verification study of fatigue-based methods in API RP 1183 to estimate the fatigue life of pipeline dents was conducted by Zhu [10]. This is the most comprehensive study executed through detailed review and calculations identifying the self-inconsistencies between API RP 1183 screening and assessment methods. Zhu indicated that for the PRCI Level 2 shape-based assessment, it is a great challenge for users to calculate fatigue life for a plain dent because a set of extremely complicated curve-fitting equations need to be used for determining the shape parameter, shape factor, pressure factor, grade scale factor, scaling factor, and others. It is unusual that all curve-fitting equations have either an integer or a common fraction as the exponent for an assumed power function; it is nonsensical from the point of view of statistical analysis. This raises a concern about whether the shape-based fitting equations are adequate or correct. Based on review and comments, the present authors fully concur with Zhu’s opinion because:
• API RP 1183 and its referred original work do not provide a scientific basis for shape parameters. This makes it difficult for users to check and use the shape-based parameter (SP) assessment given by API RP1183 or in its referred original report and papers [43].
• The SP approach was often established on and validated against full-scale trials. Do the words “against full-scale trials” mean against “full-scale FE trials?” If this is the case, the reliability and confidence level validation is questionable because it is “FE validated by FE” [37].
• A total of 65 actual full-scale Tests (57 from MD-4-2 and eight from other sources outside the PRCI MD project) are used by PRCI to evaluate four existing Dent Fatigue models, namely, API 1156, EPRG/PI 579, Rosenfeld and Fowler model [5,13]. However, to date, validation of the SP fatigue model and comparison with other models have not been performed since the SP model was established [43,37].
Because there is a concern about whether the shape-based fitting equations are adequate or correct, and because a set of extremely complicated curve-fitting equations need to be used for determining the shape parameter, shape factor, pressure factor, grade scale factor, scaling factor, etc., the refined EPRG model may be considered for use as a Level 2 fatigue life assessment of the unconstrained plain dent for fitness of services when the lower bound material property, upper bound pressure cycling, and upper bound dent geometry from ILI and/or field inspection excavation are used as inputs. This consideration is based on the execution of the refined EPRG approach being simple and fast (not time- consuming), which is consistent with API 579 Failure Assessment Diagram (FAD) Level 2 for the crack assessment concept [46].
For critical dent features that require Level 3 assessment, the same improved ERPG model can be used with actual material property, pressure cycling data, and precise sizing data from ILI/NDE as inputs and application of SF=5 for HCA as required by PHMSA MEGA rule, and/or combined with FEA to accurately determine stress concentration factor Kd, (It is not the same as stress range Sr in API RP 1183).
Moreover, many papers have been published to demonstrate the implementation of API RP 1183 and the challenges of using API RP 1183 [37-41]. These papers are consistent and support Zhu’s comments and concerns. As suggested by PRCI, a peer review of API RP 1183 to address the issues identified by the recently published papers is indeed essential.
It should be noted that further validation of the refined EPRG model with more lab testing and field failure data is needed and ongoing and will be followed with new technical reports and papers for review and updating.
This ongoing study aims to improve the EPRG methodology for fatigue life assessment of unconstrained single peak plain dents in pipelines under cyclic internal pressure. EPRG 2000 was adopted by API 579 and more recently adopted by API RP 1183 as an alternative approach recommended for Level 2 plain dent fatigue life assessment. However, pipeline industry practice in North America has experienced the EPRG equations providing conservative, in many cases, very conservative predictions that result in unnecessary excavations and repairs. Therefore, improving the model accuracy and level of conservatism is essential from both safety and cost-effective perspectives.
A comprehensive and critical review of EPRG fatigue life prediction models is performed, which provides a scientific basis for improvement. PRCI MD 4-2 full-scale fatigue test data is used to improve the EPRG model, and PRCI MD 4-11, 14, and 15 data are used for validation. Comparison of the improved EPRG model with the original EPRG 2000 model shows a great improvement from the average error=95.6% down to -1%. Further comparison of the refined EPRG model with API RP 1183 Level 3 BS7608 Class D and FE-method shows that they are comparable and equivalent. The benefits of the refined EPRG model over the PRCI Level 3 FEA approach are simple and can be executed with simple Excel software by pipeline operators’ integrity engineers without using time-consuming FE that requires specific numerical techniques. The refined EPRG approach is what is desired by API RP 1183. This ongoing work provides a methodological framework to advance the Level 2 FFS assessment and dent-interacting with welds, gouges, cracks, and corrosion.
[Crossref]
[Crossref]
[Crossref]
[Crossref]
[Crossref]
Citation: Gao M, Krishnamurthy R, Wang R (2024) A Newly Improved Fatigue Life Prediction Model for Unconstrained Single Peak Plain Dents Based on EPRG Approach. J Res Dev.12:248.
Received: 02-Mar-2024, Manuscript No. JRD-24-29921 ; Editor assigned: 05-Mar-2024, Pre QC No. JRD-24-29921 (PQ); Reviewed: 20-Mar-2024, QC No. JRD-24-29921 ; Revised: 27-Mar-2024, Manuscript No. JRD-24-29921 (R); Published: 03-Apr-2024 , DOI: 10.35248/2311-3278.24.12.248
Copyright: © 2024 Gao M, et al. This is an open-access article distributed under the terms of the Creative Commons Attribution License, which permits unrestricted use, distribution, and reproduction in any medium, provided the original author and source are credited.