
Journal of Clinical Trials
Open Access
ISSN: 2167-0870

ISSN: 2167-0870
Research Article - (2023)Volume 13, Issue 6
Introduction: Esophageal Cancer (ESCA) is a significant cause of tumor-related mortality worldwide. Cuproptosis is a novel cell death which is different from other regulate cell death, including ferroptosis, pyroptosis and apoptosis. However, the role of cuproptosis in the initiation and progression of ESCA remains unknown.
Materials and methods: The transcriptome data and clinical data of 173 patients with esophageal cancer in The Cancer Genome Atlas (TCGA) database were sorted and extracted with Perl software. Pearson correlation analysis was performed on cuproptosis related genes and all LncRNA’s. The prognostic related LncRNA’s were determined by univariate and multivariate Cox regression analysis, and a new prognostic model was constructed to calculate the risk score of each patient. C-Index curve, Principal Component Analysis (PCA) analysis and Receiver Operating Characteristic (ROC) curve analysis were used to evaluate the prognosis prediction performance of 3-cuproptosis related LncRNA’s (CRLs) model. In addition, multivariate Cox analysis was used to assess the prognostic value of the model in the entire cohort and in different subgroups.
Results and discussion: The 3-CRLs risk scoring criteria including EWSAT1, AC125437.1 and GK-IT1 was established to evaluate the Overall Survival (OS) of ESCA. Survival analysis and ROC curve showed that the score had good prediction performance in TCGA train group and test group. The coefficients of each LncRNAs were analyzed using Lasso regression and lambda values were determined. Principal component analysis was used to determine whether 3-CRLs can clearly distinguish the gap between high and low risk samples. Multivariate Cox regression showed that 3-CRLs characteristics were independent prognostic factors of OS. Norman map showed robust effectiveness in prognosis prediction.
Conclusion: The risk characteristics based on 3-CRLs may be used to predict the prognosis of esophageal carcinoma patients.
Esophageal cancer; Cuproptosis; LncRNA; Survival analysis; Cox proportional hazards model
Esophageal Carcinoma (ESCA) is a common malignance which ranks sixth and eighth in mortality and morbidity in all tumors worldwide [1]. Diagnosis and treatment methods about ESCA have made great progress. Currently, treatments about ESCA include endoscopic resection, surgery, radiotherapy, chemotherapy and immunotherapy [2,3]. ESCA has two main pathological subtypes: Esophageal Squamous Cell Carcinoma (ESCC) which is the most common type, while the other is Esophageal Adenocarcinoma (EA) [4]. Unfortunately, owing to lack of early diagnosis biomarker and specific therapy methods for ESCC, 5-year survival rate is below 15% [5]. Therefore, it is critical to explore a novel prognostic risk model used to find high risk ESCA patients, which may contribute to improve overall survival rate of ESCA patients.
Copper induced cell death is a novel mode of death form, which is different from other known regulatory cell death, such as: apoptosis, pyroptosis, and ferroptosis, and it is defined as cuproptosis [6]. It occurs through directly binding of copper ions to the lipid acylated components of the TCA cycle in mitochondrial respiration, leading to the aggregation of fatty acylated proteins and the subsequent down-regulation of iron-sulfur proteins, subsequently resulting in protein toxic stress and cell death [7]. Moreover, they found seven genes (FDX1, DLD, LIAS, DLAT, LIPT1, PDHA1, and PDHB) make cells resistant to cuproptosis, and three genes (MTF1, CDKN2A, and GLS) make cells sensitive to cuproptosis via whole-genome CRISPR-Cas9 selection screen. Past studies have demonstrated that cuproptosis was associated with multiple cancers, including bladder cancer [8], hepatocellular carcinoma [9], and glioma [10]. However, the role of Cuproptosis Related Genes (CRGs) and long noncoding RNAs in ESCA remains unclear.
LncRNA’s is the general term for a class of RNA molecules whose transcript length exceeds 200 nucleotides. Although they cannot encode proteins in cells, they still play special functions in our body, such as chromatin and genome modification, transcription regulation, and intracellular transport [11]. LncRNA’s play significant roles in the initiation and progression of ESCA [12]. Previous study have reported that LncRNA H19 was upregulated in ESCC, and contributing to tumor cells proliferation and metastasis [13].
In our study, we screen out a series of Cuproptosis Related LncRNAs (CRLs) based on ten cuproptosis related genes, then we established a prognostic risk model of LncRNAs associated with cuproptosis in ESCA. Our results provide a novel method predicting the prognosis of ESCA patients.
Data acquisition and processing
We collected the transcriptome data and clinical data of ESCA patients from TCGA database. After downloading the transcriptome data, Perl software was used to convert the gene id into symbol name to obtain the gene expression matrix with row name id and column name symbol name. Clinical data were extracted and combined with Perl software for subsequent analysis.
Screening of LncRNAs associated with cuproptosis
In our result, we performed person correlation analysis between cuproptosis related genes and LncRNAs to screen CRLs using the “limma” R package (|logFC|>1, p<0.05). Then we collected clinical data of ESCA patients and LncRNAs expression data from TCGA. We combined these data to construct the univariate Cox regression analysis and Kaplan-Meier survival analysis to acquire prognostic CRLs. P<0.05 was considered to be statistical significance.
Construction and validation of predictive features
We constructed the Cox analysis through “survival” package to establish the optimal prognostic risk model, and calculated the risk score through the following formula: Riskscore=coef(LncRNA1) × expr(LncRNA1)+coef(LncRNA2) × expr(LncRNA2)+… +coef(LncRNAn) × expr(LncRNAn). Univariate and multivariate Cox analyses were performed using the “survival” package in R software to assess the relationship between prognosis and clinical factors and risk scores. In order to evaluate the prediction accuracy of different clinical factors and risk scores on survival time, we used the ROC package in R software to draw the time-dependent ROC curve. All independent prognostic factors identified by multivariate Cox regression analysis were included in the construction of prognostic nomogram diagram to study the information of 1-, 3-, and 5-Overall Survival (OS) for ESCA patients. Calibration curves were drawn to estimate the accuracy of the actual observed survival rate versus the predicted survival rate.
Functional enrichment analysis
We used the “limma” package to acquire the mean values of each sample gene and find out the different expression genes between the high and low risk groups. Then we utilized these genes to perform Gene Ontology (GO) and the Kyoto Encyclopedia of Genes and Genomes (KEGG) pathways analyses. These results were demonstrated via the “ggplot2” package.
Identification of prognosis associated LncRNAs coexpressed cuproptosis related genes in ESCA patients
According to relevant studies, we screened out 19 CRGs, including: NFE2L2, NLRP3, ATP7B, ATP7A, SLC31A1, FDX1, LIAS, LIPT1, LIPT2, DLD, DLAT, PDHA1, PDHB, MTF1, GLS, CDKN2A, DBT, GCSH, DLST. Figure S1 demonstrated that the expression levels of ATP7A, ATP7B, CDKN2A, DBT, DLAT, FDX1, GCSH, GLS, LIPT1, MTF1, NFE2L2, NLRP3, and SLC31A1 were upregulated in ESCA samples, compared with normal tissue samples. While, the expression levels of DLST, PDHA1, PDHB were lower in ESCA samples than normal samples. Then we combined with the gene expression files of the total samples to obtain the expression matrix of CRGs. After that, we performed co-expression analysis to identify 708 CRLs which are linked to CRGs, with the criteria of p value<0.001 and |Pearson R|>0.4 (Figure 1). A total of 160 ESCA patients were randomly divided into either the training group (N=80) or the validation group (N=80). The clinical characteristics of these samples in the two groups are displayed in Table 1. Univariate Cox regression analysis screened out six CRLs with a hazard ratio (HR)>1 which means that they may be negative prognostic indicators in patients with ESCA (Figure 2A). Least Absolute Shrinkage and Selection Operator (LASSO) regression analysis was then used to select 3 CRLs, including: EWSAT1, AC125437.1, and GK-IT1 (Figure 2B and 2C). The correlation heat map demonstrated the close relationship between the CRGs and these three LncRNAs (Figure 2D).
| Covariates | Type | Total | Test | Train | P-value |
|---|---|---|---|---|---|
| Age | <=65 | 98(61.25%) | 48(60%) | 50(62.5%) | 0.8711 |
| >65 | 62(38.75%) | 32(40%) | 30(37.5%) | ||
| Gender | Female | 23(14.37%) | 15(18.75%) | 8(10%) | 0.1764 |
| Male | 137(85.62%) | 65(81.25%) | 72(90%) | ||
| Grade | G1 | 16(10%) | 10(12.5%) | 6(7.5%) | 0.1417 |
| G2 | 65(40.62%) | 33(41.25%) | 32(40%) | ||
| G3 | 44(27.5%) | 16(20%) | 28(35%) | ||
| unknown | 35(21.88%) | 21(26.25%) | 14(17.5%) | ||
| Stage | Stage I | 16(10%) | 12(15%) | 4(5%) | 0.117 |
| Stage II | 68(42.5%) | 35(43.75%) | 33(41.25%) | ||
| Stage III | 48(30%) | 20(25%) | 28(35%) | ||
| Stage IV | 8(5%) | 3(3.75%) | 5(6.25%) | ||
| unknown | 20(12.5%) | 10(12.5%) | 10(12.5%) | ||
| T | T0 | 1(0.62%) | 1(1.25%) | 0(0%) | 0.113 |
| T1 | 27(16.88%) | 18(22.5%) | 9(11.25%) | ||
| T2 | 37(23.12%) | 20(25%) | 17(21.25%) | ||
| T3 | 75(46.88%) | 31(38.75%) | 44(55%) | ||
| T4 | 4(2.5%) | 3(3.75%) | 1(1.25%) | ||
| unknown | 16(10%) | 7(8.75%) | 9(11.25%) | ||
| M | M0 | 119(74.38%) | 61(76.25%) | 58(72.5%) | 0.6978 |
| M1 | 8(5%) | 3(3.75%) | 5(6.25%) | ||
| unknown | 33(20.62%) | 16(20%) | 17(21.25%) | ||
| N | N0 | 65(40.62%) | 33(41.25%) | 32(40%) | 0.09 |
| N1 | 62(38.75%) | 35(43.75%) | 27(33.75%) | ||
| N2 | 9(5.62%) | 2(2.5%) | 7(8.75%) | ||
| N3 | 6(3.75%) | 1(1.25%) | 5(6.25%) | ||
| unknown | 18(11.25%) | 9(11.25%) | 9(11.25%) |
Table 1: The clinical characteristicof colon cancer patients in the training and validation group.
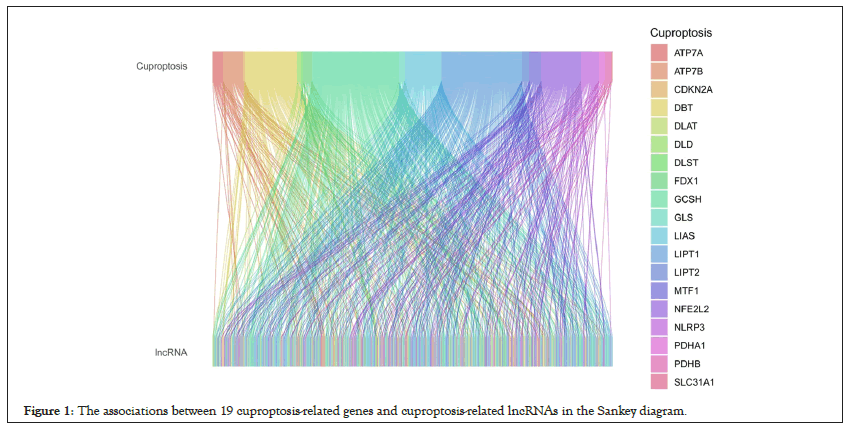
Figure 1: The associations between 19 cuproptosis-related genes and cuproptosis-related lncRNAs in the Sankey diagram.
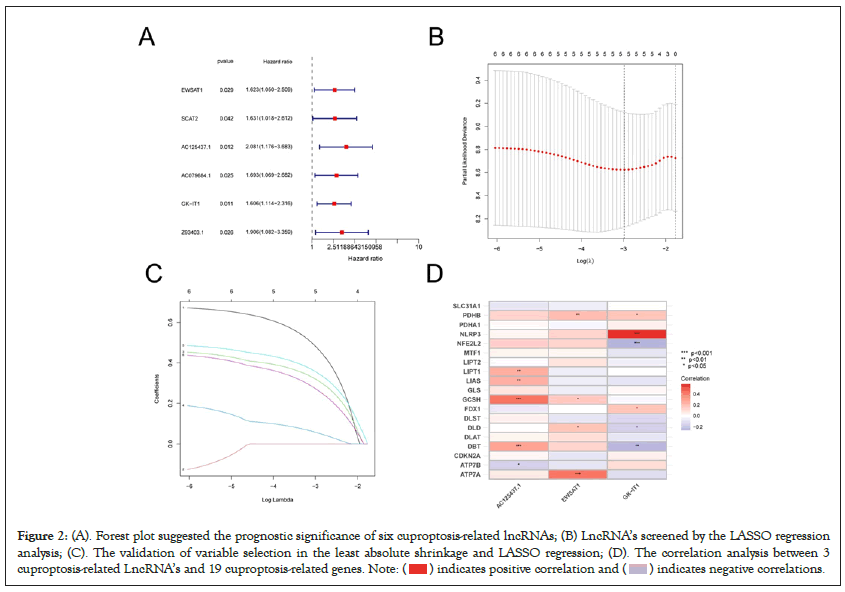
Figure 2: Forest plot suggested the prognostic significance of six cuproptosis-related lncRNAs; (B) LncRNA’s screened by the LASSO regression
analysis; (C). The validation of variable selection in the least absolute shrinkage and LASSO regression; (D). The correlation analysis between 3
cuproptosis-related LncRNA’s and 19 cuproptosis-related genes.Note: ( ) indicates positive correlation and (
 ) indicates negative correlations.
Construction and validation of the prognostic model of cuproptosis-related LncRNAs
To further study the potential prognostic value of the 3 CRLs in ESCA, we constructed a prognostic model using the results of the multivariate COX regression. According to the risk scoring formula, the risk score can be calculated as follows: risk score=(0 .672*EWSAT1)+(0.676*AC125437.1)+(0.490*GK-IT1). Based on this formula, the risk score of each sample can be calculated, and the samples were divided into high-risk group (n=60) and low-risk group (n=60) according to the median risk score (Figures 3A-3C). Risk score=0.85 was seen as the cut-off value, risk score greater than 0.85 was considered as high-risk group, while risk score less than 0.85 was considered as low-risk group. More deaths happened obviously in the high-risk group than in the low-risk group (Figures 3D-3F). Heatmaps (Figures 3G-3I) showed significant differences in the expression levels of the three genes between the high and low risk groups. The expression levels of EWSAT1, AC125437.1, and GK-IT1 were all increased in the high-risk group. The Kaplan– Meier curves showed that OS was significantly lower in the highrisk group patients than low-risk group patients in the total samples, training and validation samples (Figures 3J-3L).
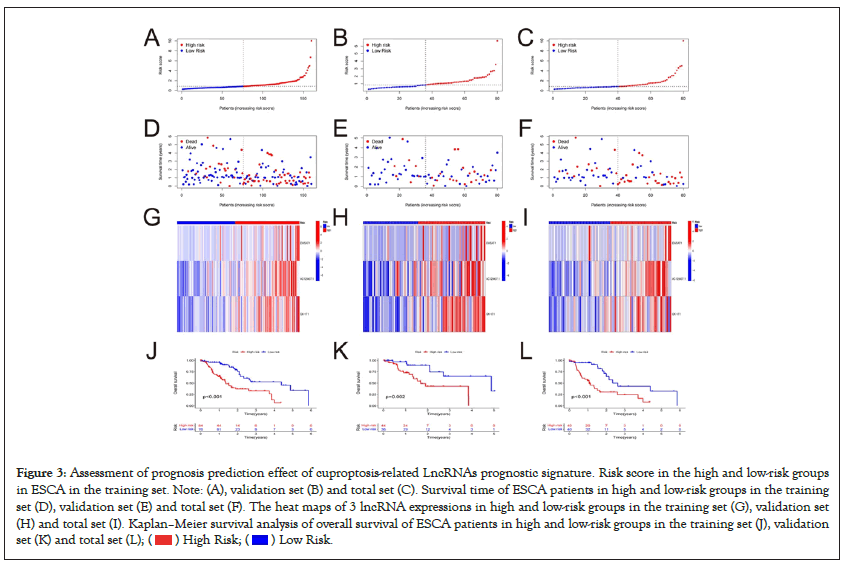
Figure 3: Assessment of prognosis prediction effect of cuproptosis-related LncRNAs prognostic signature. Risk score in the high and low-risk groups
in ESCA in the training set. Note: (A), validation set (B) and total set (C). Survival time of ESCA patients in high and low-risk groups in the training
set (D), validation set (E) and total set (F). The heat maps of 3 lncRNA expressions in high and low-risk groups in the training set (G), validation set
(H) and total set (I). Kaplan–Meier survival analysis of overall survival of ESCA patients in high and low-risk groups in the training set (J), validation
set (K) and total set (L); ( ) High Risk; (
 ) Low Risk.
An independent prognostic indicator of the risk score in ESCA
We conducted univariate and multivariate Cox regression analyses to explore whether the risk score model can be an independent prognostic factor. Multivariate Cox regression analysis demonstrated that stage (Hazard Ratio (HR)=2.442, 1.574-3.726; P<0.05) and risk score (HR=1.251, 1.044–1.499; P<0.05) were independently correlated with OS, suggesting that risk model have independent prognostic value in patients with ESCA (Figures 4A and 4B). The area under the AUC curve was 0.737, 0.667, and 0.835 for the 1-, 3-, and 5-years ROCs, respectively (Figure 4C). The AUC value was 0.737 in the 1-years ROC of the model, displaying significant predictive power compared to other clinicopathological factors (Figure 4D).
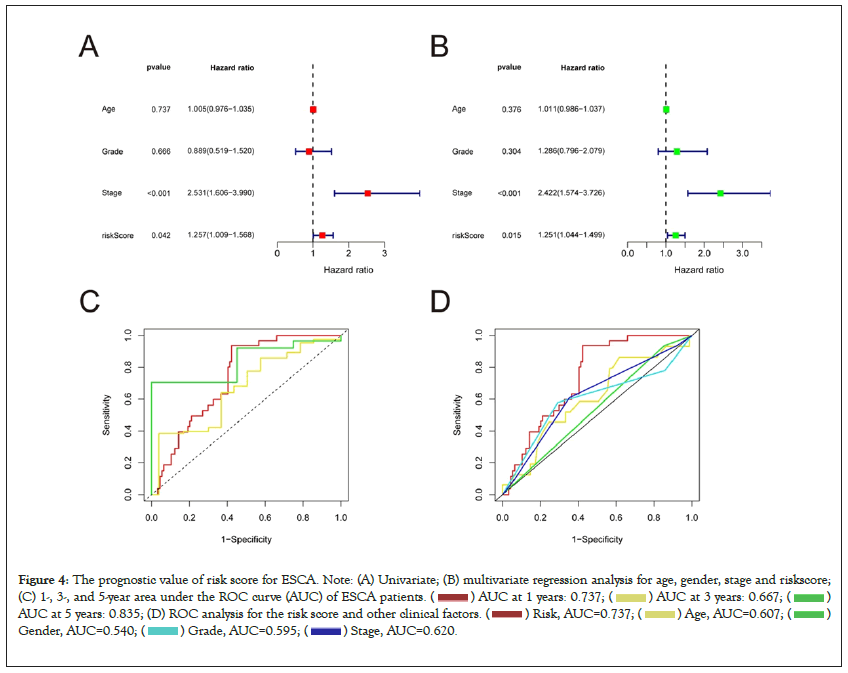
Figure 4: The prognostic value of risk score for ESCA. Note: (A) Univariate; (B) multivariate regression analysis for age, gender, stage and riskscore;
(C) 1-, 3-, and 5-year area under the ROC curve (AUC) of ESCA patients. ( ) AUC at 1 years: 0.737; (
 ) AUC at 3 years: 0.667; (
 )
AUC at 5 years: 0.835; (D) ROC analysis for the risk score and other clinical factors. (
 ) Risk, AUC=0.737; (
 ) Age, AUC=0.607; (
 )
Gender, AUC=0.540; (
  ) Grade, AUC=0.595; (
 ) Stage, AUC=0.620.
Construction and validation of the nomogram
We made a prediction about the clinical outcome of ESCA patients at 1, 3, and 5 years through drawing a nomogram which contained clinical risk scores and characteristics (Figure 5A). And the calibration curves demonstrated good agreement between the nomogram and the predicted results (Figure 5B). Moreover, the C-index values of the prognostic signature were higher than those of other clinical characteristics, such as stage, age, and gender (Figure 5C). The important differences in OS between the low-risk and high-risk groups at stages I–II and III–IV were analyzed, and the result indicated that the high-risk patients at stages I–II had a worse clinical outcome (Figure 5D and 5E). Then PCA was utilized to analyze the differences between low- and high-groups in four types of samples (total gene expression samples, cuproptosis related genes, all cuproptosis related LncRNAs, and 3 cuproptosis related LncRNAs which be used to construct the risk model) (Figures 6A–6D). The result showed that LncRNAs involved in risk model construction can apparently distinguish the differences between high- and low-risk groups.
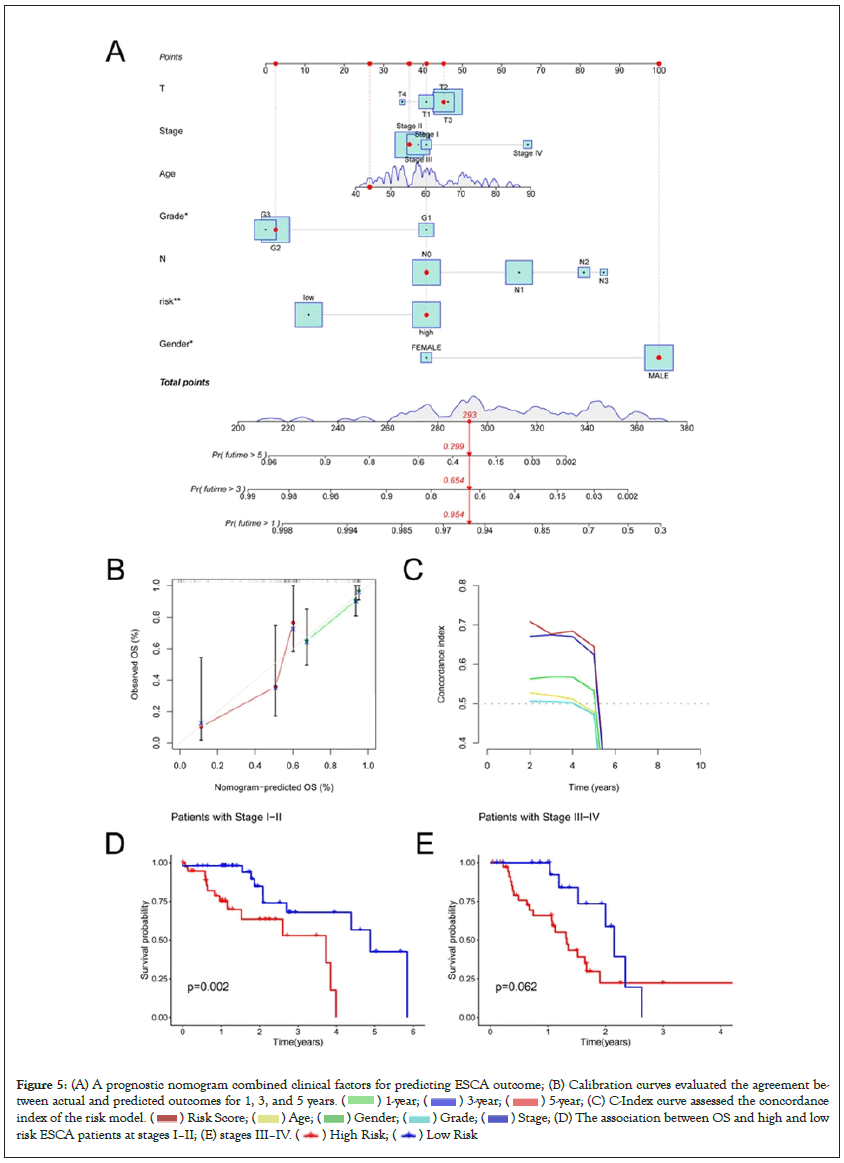
Figure 5: (A) A prognostic nomogram combined clinical factors for predicting ESCA outcome; (B) Calibration curves evaluated the agreement between
actual and predicted outcomes for 1, 3, and 5 years. ( ) 1-year; (
  ) 3-year; (
 ) 5-year; (C) C-Index curve assessed the concordance
index of the risk model. (
  ) Risk Score; (
  ) Age; (
 ) Gender; (
  ) Grade; (
 ![]() ) Stage; (D) The association between OS and high and low
risk ESCA patients at stages I–II; (E) stages III–IV. (
) Stage; (D) The association between OS and high and low
risk ESCA patients at stages I–II; (E) stages III–IV. ( ) High Risk; (
 ) Low Risk
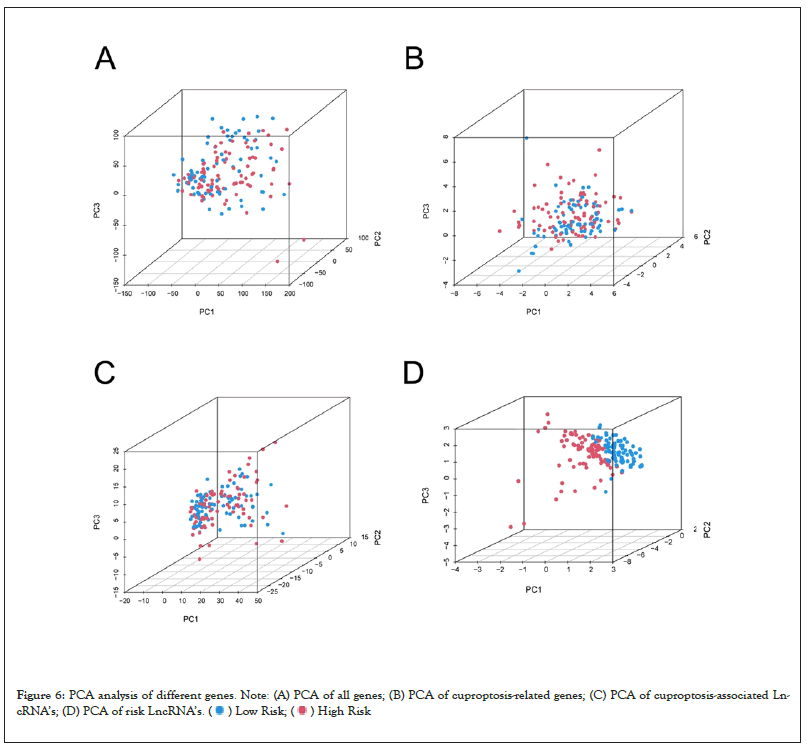
Figure 6: PCA analysis of different genes. Note: (A) PCA of all genes; (B) PCA of cuproptosis-related genes; (C) PCA of cuproptosis-associated LncRNA’s;
(D) PCA of risk LncRNA’s. (  ) Low Risk; (
  ) High Risk
Functional enrichment analysis
We performed variation analysis of genes in the high- and low-risk groups, and obtained 52 genes which expressed differently between two groups (Table 2). GO analysis and KEGG analysis of these 52 differential genes were performed. Biological Processes (BP) of GO enrichment analysis showed that these genes were mainly associated with cell chemotaxis, humoral immune response, response to lipopolysaccharide, and response to molecule of bacterial origin (Figures 7A–7C). According to KEGG pathway analysis, differential genes were found to be correlated with cytokine- cytokine receptor interaction, rheumatoid arthritis, IL-17 signaling pathway, and Tumor Necrosis Factor (TNF) signaling pathway (Figures 7D–7F). These results indicate that the differentially expressed genes play a significant role in the immune defense.
| Gene | Low-mean | High-mean | Log-FC | p-Value | fdr |
|---|---|---|---|---|---|
| FCGR3B | 1.181914 | 2.710122 | 1.197232 | 0.001063 | 0.047124 |
| RNU6-1237P | 1.228992 | 2.68904 | 1.129616 | 0.00043 | 0.029723 |
| CD69 | 3.293104 | 8.066496 | 1.292494 | 0.000492 | 0.03169 |
| CXCL6 | 11.72083 | 42.87055 | 1.870912 | 2.46E-05 | 0.005261 |
| ASGR2 | 0.390959 | 2.920874 | 2.90131 | 0.000458 | 0.030787 |
| AC125437.1 | 1.045913 | 2.142727 | 1.034685 | 3.19E-11 | 2.66E-07 |
| PTPRJ-AS1 | 1.304204 | 3.108956 | 1.253261 | 3.29E-09 | 1.83E-05 |
| WFDC3 | 0.789172 | 1.631352 | 1.047656 | 0.001095 | 0.04777 |
| APOA2 | 3.112697 | 32.94937 | 3.404014 | 0.000359 | 0.027009 |
| RNU6-877P | 1.451112 | 2.927655 | 1.012587 | 9.92E-05 | 0.013767 |
| RN7SL368P | 5.993128 | 12.69507 | 1.082888 | 7.91E-06 | 0.002746 |
| AC021739.1 | 0.682313 | 1.394701 | 1.03145 | 0.000303 | 0.025092 |
| AC112496.1 | 1.299179 | 3.060766 | 1.236293 | 4.72E-06 | 0.001917 |
| HMGB1P21 | 0.826588 | 1.693917 | 1.035122 | 9.42E-06 | 0.002946 |
| AC005920.2 | 1.213059 | 2.715494 | 1.162565 | 2.65E-06 | 0.001628 |
| RNVU1-27 | 1.906122 | 4.320685 | 1.180619 | 0.000177 | 0.018072 |
| RNU4-80P | 3.865922 | 7.985661 | 1.046599 | 9.57E-06 | 0.002946 |
| RNU4-51P | 0.853261 | 1.816292 | 1.089938 | 2.1E-08 | 7.01E-05 |
| AC002542.6 | 0.687442 | 1.408168 | 1.034509 | 5.46E-06 | 0.002117 |
| RNU7-41P | 5.365801 | 11.66018 | 1.119724 | 4.56E-05 | 0.008254 |
| CXCL5 | 10.45983 | 80.86726 | 2.950697 | 0.000146 | 0.016541 |
| NR4A1 | 30.29489 | 60.78472 | 1.004634 | 2.74E-05 | 0.005563 |
| IL6 | 5.206579 | 12.89351 | 1.308238 | 0.000226 | 0.020994 |
| H2BC16P | 0.494676 | 1.547373 | 1.645264 | 0.001 | 0.046552 |
| GK-IT1 | 1.347226 | 4.444431 | 1.722006 | 7.36E-14 | 1.23E-09 |
| MIR1183 | 0.96942 | 2.042791 | 1.075348 | 0.000181 | 0.018126 |
| RND1 | 3.679189 | 8.757552 | 1.25114 | 0.001095 | 0.04777 |
| AC079150.1 | 1.562197 | 3.49277 | 1.160795 | 5.29E-05 | 0.009069 |
| SELE | 4.436041 | 11.16289 | 1.331366 | 0.000179 | 0.018098 |
| SLED1 | 0.662161 | 1.714666 | 1.372675 | 2.2E-07 | 0.000246 |
| G0S2 | 20.40683 | 58.96651 | 1.530844 | 0.000114 | 0.01424 |
| TREM1 | 2.532936 | 5.122396 | 1.016009 | 0.000203 | 0.019503 |
| PAEP | 0.796157 | 3.67747 | 2.20759 | 0.000424 | 0.029446 |
| RNU6-437P | 4.668679 | 9.451949 | 1.017598 | 1.15E-06 | 0.000833 |
| AC087276.3 | 0.656886 | 1.341728 | 1.030378 | 9.05E-06 | 0.002946 |
| BCL2A1 | 9.246645 | 19.39487 | 1.068673 | 3.45E-06 | 0.001743 |
| MIR5585 | 0.809354 | 1.734196 | 1.099425 | 0.000148 | 0.016708 |
| RASD1 | 13.74976 | 28.49928 | 1.051519 | 0.00031 | 0.025469 |
| OSM | 1.711608 | 4.21443 | 1.299985 | 0.000114 | 0.01424 |
| AL121924.1 | 0.743455 | 1.553777 | 1.063461 | 0.00039 | 0.028193 |
| RNA5SP466 | 0.723909 | 1.674218 | 1.209607 | 0.00033 | 0.026033 |
| CXCL2 | 31.50366 | 73.34758 | 1.21923 | 0.000156 | 0.017024 |
| SAA4 | 0.637072 | 1.389787 | 1.125335 | 0.000958 | 0.045759 |
| RNA5SP207 | 0.900978 | 3.269833 | 1.859654 | 2.93E-08 | 8.13E-05 |
| RNU6-1177P | 1.163191 | 2.573718 | 1.145766 | 0.000788 | 0.041289 |
| RNU4-40P | 3.39847 | 6.895681 | 1.020808 | 7.31E-08 | 0.000152 |
| RNA5SP202 | 1.210546 | 2.611833 | 1.109405 | 0.0012 | 0.049718 |
| ATF3 | 29.13714 | 61.95474 | 1.088355 | 1.01E-07 | 0.000169 |
| AC103691.1 | 3.520279 | 7.877379 | 1.162026 | 1.09E-06 | 0.000827 |
| CXCL8 | 62.34285 | 192.4217 | 1.625976 | 3.07E-06 | 0.00168 |
| RNVU1-4 | 1.299313 | 2.847179 | 1.131784 | 0.001032 | 0.047099 |
| SSTR2 | 0.713822 | 1.883073 | 1.399452 | 0.000258 | 0.022848 |
Table 2: Differential genes between high and low risk groups.
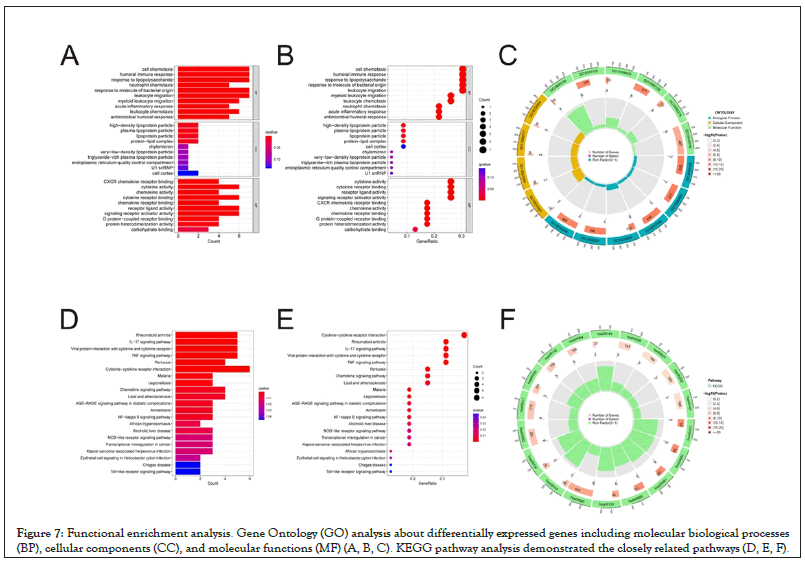
Figure 7: Functional enrichment analysis. Gene Ontology (GO) analysis about differentially expressed genes including molecular biological processes (BP), cellular components (CC), and molecular functions (MF) (A, B, C). KEGG pathway analysis demonstrated the closely related pathways (D, E, F).
Copper is an essential mineral nutrient for all living organisms because it is the basis of a large number of biological processes, including mitochondrial respiration, iron absorption, antioxidant, and detoxification processes. However, previous studies have verified that copper was closely correlated with various disease statuses. As for tumor, a higher level of Cu in cancer tissues compared to normal samples have been observed in many studies. Cu accumulation was associated with enhanced cell proliferation and growth, and angiogenesis. Furthermore, a significant alteration about Cu levels of serum and cancer samples have occurred in different cancer patients, including thyroid, breast, and lung cancers [14-16]. Recently, a new study reported that copper accumulation in cells can induce cuproptosis [17]. Cuproptosis occurs when copper binds directly to the lipoylated components of the TCA cycle, and the subsequent loss of Fe-S protein cluster triggers proteotoxic stress and a different form of cell death. Previous studies have showed that cuproptosis related LncRNAs were closely associated with head and neck squamous cell cancer [18], hepatocellular carcinoma [19], colon adenocarcinoma [20], and glioma [21]. However, the correlation between cuproptosis related LncRNAs and ESCA remains unclear.
In this study, we explored the expression characteristics of EWSAT1, GK-IT1 and AC125437.1 in esophageal cancer tissues and examined the relationship between these CRLs and OS. For the first time, we constructed a new prognosis score model based three CRLS, and verified the effectiveness of the model by Cox regression, C-Index curve, ROC curve, and principal component analysis. LncRNA EWSAT1 have been reported to play an oncogene role in non-small cell lung cancer (NSCLC), osteosarcoma, and colorectal cancer [22- 24]. GK-IT1 was verified to promote the progression of esophageal squamous cell carcinoma by activating the ERK/MAPK pathway [25]. AC125437.1, as a little-studied LncRNA, has potential prognostic value and needs further investigation.
IL17 signaling pathway and TNF signaling pathway were related to differentially expressed genes. IL-17 is a significant member of inflammatory cytokines, and unrestricted IL-17 signaling is associated with the immunopathology, autoimmune diseases, and progression of several types of cancers [26]. TNF was initially described as a circulating factor that can cause tumor necrosis, but was later identified as a key regulator of inflammatory response [26]. It is a pleiotropic cytokine that plays a significant role in the pathogenesis of a variety of diseases. TNF is mainly produced by monocytes and macrophages, as well as some T cells. The various biological activities of TNF depends on the binding and activation of two different receptors, namely TNF receptor 1 (TNFR1) and TNF receptor 2 (TNFR2) [27].
In this study, a new prognostic model was constructed based on cuproptosis associated LncRNAs, which could be used to predict the clinical outcome of patients with ESCA. And the risk model was verified by Cox analysis and AUC curve, providing a new insight into the correlation between CRLs and the prognosis of esophageal cancer. However, the application of this model in clinical practice should be further explored to verify the accuracy of the results in our study.
[Crossref] [Google Scholar] [PubMed]
[Crossref] [Google Scholar] [PubMed]
[Crossref] [Google Scholar] [PubMed]
[Crossref] [Google Scholar] [PubMed]
[Crossref] [Google Scholar] [PubMed]
[Crossref] [Google Scholar] [PubMed]
[Crossref] [Google Scholar] [PubMed]
[Crossref] [Google Scholar] [PubMed]
[Crossref] [Google Scholar] [PubMed]
[Crossref] [Google Scholar] [PubMed]
[Crossref] [Google Scholar] [PubMed]
[Crossref] [Google Scholar] [PubMed]
[Crossref] [Google Scholar] [PubMed]
[Crossref] [Google Scholar] [PubMed]
[Crossref] [Google Scholar] [PubMed]
[Crossref] [Google Scholar] [PubMed]
[Crossref] [Google Scholar] [PubMed]
[Crossref] [Google Scholar] [PubMed]
[Crossref] [Google Scholar] [PubMed]
[Crossref] [Google Scholar] [PubMed]
[Crossref] [Google Scholar] [PubMed]
[Crossref] [Google Scholar] [PubMed]
[Crossref] [Google Scholar] [PubMed]
[Crossref] [Google Scholar] [PubMed]
[Crossref] [Google Scholar] [PubMed]
[Crossref] [Google Scholar] [PubMed]
[Crossref] [Google Scholar] [PubMed]
Citation: Peng S, Li H, Min J, An R, Du N, Li Z (2023) A Novel Cuproptosis-Related LncRNA Signature Predicts Prognosis in Patients with Esophageal Carcinoma. J Clin Trials. 13:542.
Received: 06-Oct-2023, Manuscript No. JCTR-23-27362; Editor assigned: 10-Oct-2023, Pre QC No. JCTR-23-27362(PQ); Reviewed: 24-Oct-2023, QC No. JCTR-23-27362; Revised: 31-Oct-2023, Manuscript No. JCTR-23-27362(R); Published: 07-Nov-2023 , DOI: 10.35248/2167-0870.23.13.542
Copyright: © 2023 Peng S, et al. This is an open-access article distributed under the terms of the Creative Commons Attribution License, which permits unrestricted use, distribution, and reproduction in any medium, provided the original author and source are credited.