Journal of Geology & Geophysics
Open Access
ISSN: 2381-8719
+44 1478 350008
ISSN: 2381-8719
+44 1478 350008
Research Article - (2021)Volume 10, Issue 7
A hydrophobic composition containing water repellents and highly volatile solvents is shown in this study to isolate water from the bottom hole formation zone of gas wells and reduce as much as possible the saturation of pore spaces with water. During injection, this composition shows selectivity and mostly penetrates water-saturated porous media. The study shows that the injection of such composition into porous media has a high water-insulating effect, reducing the water permeability of water-saturated porous media by 35 times with a degree of water isolation of 97%. Moreover, while injecting, it has selective action, mainly penetrating water-saturated media rather than gas-saturated media. As a result of injecting 0.91 to 0.99 pore volumes (pv) of the composition, the Qwater/Qgas ratio reaches 5.22 to 5.26, indicating high selectivity.
Volatile solvents; Gas wells; Permeability; Water isolation; Porous media
PV: Pore Volume; Qwater: Water Flow Rate; Qgas: Gas Flow Rate; Bhz: Bottom-Hole Formation Zone; Gwc: Gas-Water Contact; Pe: Petroleum Ether; Swr: Residual Water Saturation; Sg: Gas Saturation; Spe: Petroleum Ether Saturation; Ri: Current Resistance Factor; Q1: Volumetric Flow Rate; ΔP1: Pressure Drop; Qi: Current Flow Rate; Pi: Current Pressure Drop; Rres: Residual Resistance Factor; Rmax: Maximum Resistance Factor; k1: Water permeability of the reservoir model before injection of the composition; k2: Water permeability of the reservoir model after injection of the composition; A: Water isolation level; B: Restored gas permeability percentage; Kg2: Gas permeability of the reservoir model after injection of the composition; Kg1: Gas permeability of the reservoir model with residual water
The presence of liquids (mostly water) in the Bottomhole Formation Zone (BHZ) and wellbore has negative consequences when it comes to the production gas. Having water in the wellbore reduces the flow rate, increases sand production and sand plug formation at the bottom. As well as increasing pressure losses when gas moves through layers of water in a wellbore, it can also result in a lower temperature of the gas since the liquid through which the gas is bubbled evaporates. Removing reservoir mineralized water from the well into the collection system will result in the formation of ice and gas hydrates in the gas pipelines, thereby increasing the flow rate and complicating the regeneration of desiccants (sorbents and methanol) [1-4].
Inflow of water into the wellbore is commonly caused by interstratal cross flows behind the casing, uneven advancement of the Gas- Water Contact (GWC) due to a decrease in reservoir pressure, and the formation of a water cut cone [5-8].
Taking steps to prevent water inflow is divided into two parts: first, intervening the bottomhole formation zone so as slow (prevent) water from being pulled from underlying horizons (the formation of a water cut cone), and secondly, improving the efficiency of water insulation works [9-13]. In the latter case, behind-the-casing flows are eliminated during well workover.
It is possible to reduce the water cut of the extracted products of gas wells by slowing down the rate of water inflow from reservoirs, i.e. create a water barrier. As well, the gas-saturated layers' gas permeability should not decrease in this case, which means the composition for water isolation must be highly selective [14-16].
Water isolation in oil and gas reservoirs is usually achieved by using gel-forming compositions. These usually contain polymers or inorganic reagents, inverse hydrophobic emulsions, suspensions of swelling agents, sediment-forming compositions, etc. [17-20]. In most water insolation compositions, there is an insufficient selectivity of the impact, since they reduce not only the permeability of waterconducting channels, but also the permeability of productive formation [21-24]. In that context, repellent compositions intended to isolate selectively water in gas wells were the focus of this study
In this work, the water repelling agent Neftenol ABR developed by JSC "Himeco-Gang" was analysed. Petroleum Ether (PE) was used as a model of a low-viscosity hydrocarbon solvent, since its composition and properties are similar to that of gas condensate, unstable gasoline, and hexane fraction, etc. [25-28]. After dissolving the water repellent in PE, a composition solution was produced.
Models of gas and water-saturated reservoir intervals were built from bulk porous media extracted from river sand. In these reservoir models, the sand or cores were initially saturated with Cenomanian water (density 1012 kg/m3). A stainless steel pipe was used for the body of the reservoir model, with a screw thread applied to the inner surface to prevent liquid from breakthrough along the walls.
Gas-saturated porous media were simulated using some of the water-saturated reservoir models. This was done by blowing compressed air through a water-saturated reservoir model at a constant pressure drop (0.05 MPa). The model in this case was vertically positioned while gas (air) was supplied from above. Periodically, the gas flow direction was changed (the model was turned over), resulting in a more uniform distribution of retained water over the porous medium. Water blowing time was usually about 24 hours, and in the case of reservoirs with low permeability, it could take up to 2 days.
The pore volume (pv) of the reservoir models and residual saturation (Swr) were determined using the gravimetric method [29-32].
For flow experiments, the following technique is used. Models with gas- or water-saturated reservoirs were injected with composition solutions. The direction of injection of the composition in this case was always opposed to the direction of the movement of water and gas (the composition was injected through the outlet of the reservoir models).
Once the composition was uploaded, the models were left alone for 12 hours. Afterward, water was filtered through the water-saturated reservoir models to determine the effect of the composition on the permeability of the porous medium. At the same time, pressure drop, composition, and amount of evolved fluids were measured.
Following the injection of the composition, gas (air) was injected into the gas saturated models. In this case, the gas was supplied through the inlet from above with a constant pressure drop (0.05 MPa) into the vertically positioned reservoir models. The volume of the displaced liquid and gas flow rate through each reservoir model (using a foam rotameter) were measured at the outlet.
Using the material balance, saturation levels of porous media were assessed. In gas-saturated reservoir models, residual water saturation was determined by the results of azeotropic drying with benzene after the experiments were completed.
In the course of the experiments, the change in the pressure drop and the composition of the fluids at the outlet was monitored. Fluid flow was carried out at a constant rate of approximately 3 m/day.
The two-layer reservoir models included interlayers saturated with both gas and water. Using the same method described above, models of gas- and water-saturated interlayers were constructed. As part of the experiments on a two-layer reservoir model, the pressure drop, composition, and amount of fluids exiting each reservoir model were monitored. Similarly, the composition was injected in the opposite direction from that in which gas and water moved.
In order to characterize the water repellent solution, the following factors were used [33-36].
1. Resistance factor (R) to characterize the degree of reduction in the permeability of porous media for water:

Where Ri is the current resistance factor; Q1 and ΔP1 - volumetric flow rate and pressure drop, respectively, when steady state of water flow is reached at stage 1 (primary water injection); Qi and Pi, respectively, are the current flow rate and pressure drop when flowing of water or composition.
In the case of a steady state flow

Where Rres is the residual resistance factor, i.e. the resistance factor established after the injection of the composition; k1 and k2, respectively, are the water permeability of the reservoir model before and after injection of the composition. The maximum resistance factor (Rmax) and (Rres) are characterizing, respectively, the maximum and steady-state degree of the reduction in the water permeability of the porous medium.
2. Water isolation level (A,%) - to describe the amount of water intake reduced by the composition:

3. Restored gas permeability percentage (B%) in gas-saturated porous media:

Where Kg2 is the gas permeability of the reservoir model after injection of the composition; Kg1 is the gas permeability of the reservoir model with residual water.
4. The volume ratio of fluid flow through a water-saturated interlayer to fluid flow through a gas-saturated interlayer (Qwater / Qgas) to determine the selectivity of injection of the composition (experiments on a two-layer reservoir model).
In the case of selective water isolation, the composition should reduce the water permeability of flooded interlayers without affecting the gas permeability of gas-saturated interlayers that allow gas to enter the well [37-40].
Therefore, in the study, it is necessary to simulate the effect of the composition on water- and gas-saturated porous media (with residual water saturation).
The effect of a hydrocarbon solution of the water repellent on the water permeability of water-saturated porous media
Upon injection of a hydrocarbon liquid (PE and solution of a water repellent in PE) into a water-saturated porous hydrophilic medium, it leads to a precipitous increase in pressure drop and resistance factor (Figure 1).
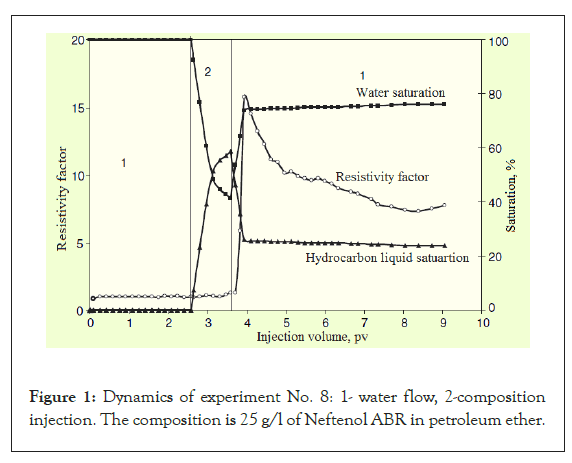
Figure 1: Dynamics of experiment No. 8: 1- water flow, 2-composition injection. The composition is 25 g/l of Neftenol ABR in petroleum ether.
After switching to water injection (after composition), pressure drop and resistance factor continue to increase and reach their maximum values, after which they decrease. Nevertheless, the initial water permeability is not restored, and the higher the concentration of the water repellent, the higher the residual resistance factors (Table 1).
| Experiment | Gas permeability μm2 | Concentration of water repellent, g /L of PE | Resistance factor (when injecting the composition) | Resistance factor (when water flows after composition) | Degree of water insulation, % | ||
|---|---|---|---|---|---|---|---|
| Maximum | After injecting 1 pv of the composition | Maximum | Residual | ||||
| 4 | 0,466 | 0 | 1,46 | 1,12 | 2,85 | 2,67 | 62,5 |
| 7 | 0,662 | 5 | 1,46 | 1,0 | 2,83 | 2,06 | 51 |
| 15 | 0,261 | 25 | 1,17 | 1,17 | 10,9 | 5,6 | 82,1 |
| 8 | 0,615 | 25 | 1,30 | 1,30 | 15,8 | 7,6 | 86,8 |
| 11 | 1,55 | 25 | 0,96 | 0,96 | 14,5 | 5,7 | 82,5 |
| 6 | 0,490 | 52,6 | 1,9 | 1,9 | 68 | 35,4 | 97,2 |
Table 1: Effect of ABR Neftenol concentration and reservoir permeability on the degree of water isolation in reservoir models.t
PE injection (experiment 4) does not significantly reduce the water permeability of the porous media, as the degree of water isolation is only 62.5%, which does not suffice to significantly reduce the flow of water into the wellbore. With a water repellent concentration greater than 25 g/l of the solution, a higher degree of isolation of water will be achieved (degree of isolation is 82.1%-297.2%).
According to the graph (Figure 2), both the residual and maximum resistance factors are exponentially related to the repellent concentration. Such a strong influence of the repellent agent concentration on the resistance factors suggests a change in wettability of the porous medium (from hydrophilic to hydrophobic) and, therefore, a significant reduction in water permeability [41-44].
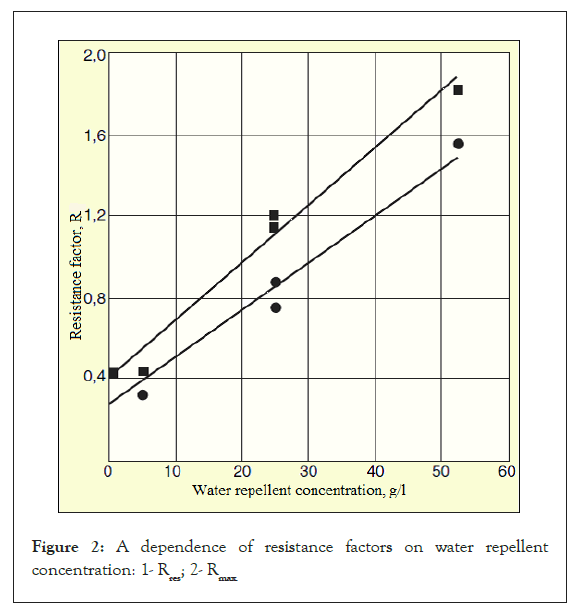
Figure 2: A dependence of resistance factors on water repellent concentration: 1- Rres; 2- Rmax.
The permeability of the porous medium has no significant effect on the composition injection results. Even though the permeability was changed from 0.26 to 1.55 m2, (a nearly 6X change), no noticeable change was detected in water isolation (82.1%-286.8%), maximum and residual resistance factors (Table 1, experiments 8, 11 and 15).
The effect of a hydrocarbon solution of the water repellent on the gas permeability of gas-saturated porous media
In experiments 10, 12, 16 and 20, a solution of a water repellent in PE was tested for its effect on the gas permeability of porous media. After injection of the composition, all the experiments conducted demonstrated that gas permeability is restored in gas-saturated porous media relatively quickly (Figure 3).
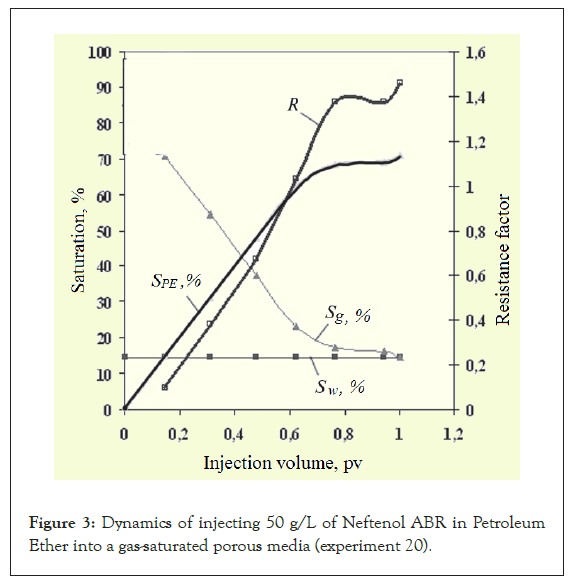
Figure 3: Dynamics of injecting 50 g/L of Neftenol ABR in Petroleum Ether into a gas-saturated porous media (experiment 20).
Moreover, in most experiments, the degree of permeability recovery is greater than 100% (i.e., the gas permeability becomes greater than before injection of the composition) and the degree of recovery does not fundamentally depend on the concentration of Neftenol ABR (Table 2 and Figure 4). After disassembling the models, it was revealed that the PE had evaporated completely after blowing.
| Experiment | Concentration of water repellent, g/l | Resistance factor (when injecting a composition) | Gas permeability, μm2 | Water saturation, % | Permeability recovery rate,% | |||
|---|---|---|---|---|---|---|---|---|
| maximum | after pumping 1 pv of solution | absolute | with water residual | before exposure | after exposure | |||
| 9 | 0 | 0,94 | 0,94 | 0,792 | 0,677 | 29,6 | 26 | 111 |
| 12 | 25 | 1,72 | 1,67 | 0,299 | 0,216 | 36,6 | 26 | 131 |
| 16 | 25 | 1,93 | 1,61 | 0,516 | 0,416 | 27,7 | 26 | 99,3 |
| 10 | 25 | 1,02 | 1,02 | 1,54 | 1,47 | 11,6 | 1 | 103 |
| 20 | 50 | 1,46 | 1,46 | 0,967 | 0,916 | 14,5 | 9 | 101 |
Table 2: Influence of porous media permeability and water repellent concentration on the restoration of porous media gas permeability.
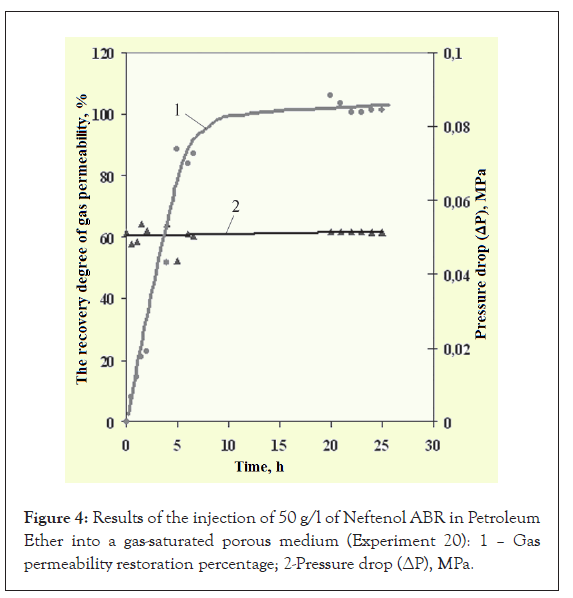
Figure 4: Results of the injection of 50 g/l of Neftenol ABR in Petroleum Ether into a gas-saturated porous medium (Experiment 20): 1 – Gas permeability restoration percentage; 2-Pressure drop (ΔP), MPa.
The injection of the composition into porous media and subsequent blowing with air is accompanied by a decrease in the saturation of porous media with water, which is why porous media become more gas permeable. The comparison between experiments 10 and 12 shows that the greater the initial saturation of the porous media with water, the greater the increase in gas permeability after injecting the water repellent composition into the porous media. Changes in the wettability of the rock caused by the water repellent suppress the capillary forces that hold water in the capillaries and on the surface of the sand, thereby facilitating evaporation of water [45-47].
Modelling the injecting process of a water repellent solution using a two-layer reservoir model
A water repellent solution, according to the study, can significantly reduce the water permeability of a water-saturated porous media and increase the gas permeability of a gas-saturated porous media, i.e., it can selectively isolate the water. It is however important to check the "selectivity" when injecting the composition, that is, the ability of a water repellent solution to flow into porous media with different saturation levels.
In order to assess the flow selectivity of the water repellent solution and pure solvent, experiments were conducted using two-layer reservoir models of gas- and water-saturated interlayers. A list of the characteristics of reservoir models is given in Table 3, the experimental scheme is shown in Figure 5, and the results of the experiments are shown in Figures 6 and 7.
| Experiment | Composition | Interlayer type | Permeability, μm2 | Saturation, % | |||
|---|---|---|---|---|---|---|---|
| Gas | Water | Gas with residual water | Gas | Water | |||
| 29/30 | PE | Gas saturated | 0,874 | 0,541 | 0,780 | 78,6 | 21,4 |
| Water saturated | 0,964 | 0,497 | – | 0 | 100 | ||
| 27/28 | 50 g/l АBR | Gas saturated | 0,945 | 0,488 | 0,779 | 73,0 | 27,0 |
| In PE | Water saturated | 1,08 | 0,607 | – | 0 | 100 | |
Table 3: Characterization of two-layer reservoir models.
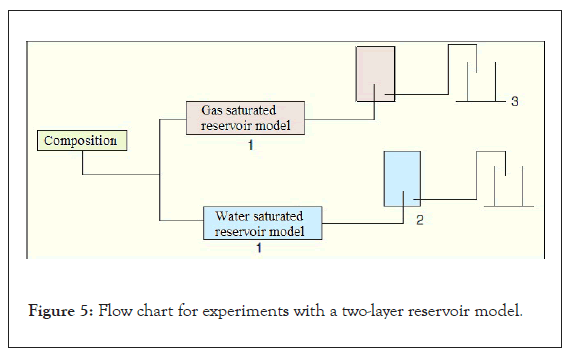
Figure 5: Flow chart for experiments with a two-layer reservoir model.
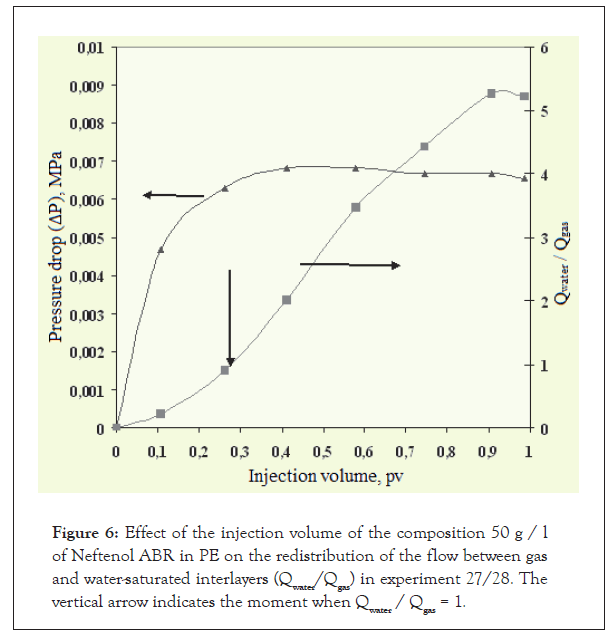
Figure 6: Effect of the injection volume of the composition 50 g / l of Neftenol ABR in PE on the redistribution of the flow between gas and water-saturated interlayers (Qwater/Qgas) in experiment 27/28. The vertical arrow indicates the moment when Qwater / Qgas = 1.
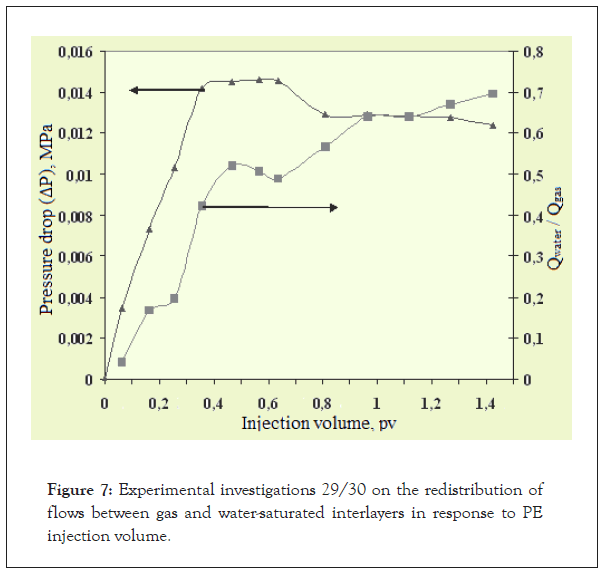
Figure 7: Experimental investigations 29/30 on the redistribution of flows between gas and water-saturated interlayers in response to PE injection volume.
The experiments performed on reservoir models with two layers showed the following results.
1. Injection of 0.3 pv of ABR solution into the bottom-hole zone results in greater penetration into the water-saturated layer than into the gas-saturated layer.
2. As a result of injecting 0.91 to 0.99 pv of the composition, the current ratio Qwater/Qgas reaches 5.22 to 5.26, which indicates high selectivity when injecting the composition.
3. A highly volatile organic solvent (PE) does not have the ability to selectively penetrate a water-saturated interlayer. Upon injecting 1.42 pv of the solvent, the current ratio Qwater/Qgas reaches 0.696, indicating that the bulk of the reagent is entering the gas-saturated interlayer.
According to the study, a solution of a water repellent in a highly volatile hydrocarbon solvent:
• Has no detrimental effect on the gas permeability of gas-saturated porous media (the solvent is easily removed by the gas flow from the porous media);
• Helps to remove residual water from gas-saturated porous media and enhance their gas permeability;
• Possesses a high water-insulating efficiency, reducing the water permeability of water-saturated porous media up to 35 times with the degree of water isolation up to 97%.
• Shows selectivity during injection, and mostly penetrates watersaturated media, rather than gas-saturated media.
Citation: AL-Obaidi SH, Hofmann M, Smirnov VI, Khalaf FH, Alwan HH (2021) A Study of Compositions Relevant to Selective Water Isolation in Gas Wells. J Geol Geophys. 10: 1000.
Received: 22-Oct-2021 Accepted: 05-Nov-2021 Published: 12-Nov-2021 , DOI: 10.35248/2381-8719.21.10.1000
Copyright: © 2021 AL-Obaidi SH, et al. This is an open-access article distributed under the terms of the Creative Commons Attribution License, which permits unrestricted use, distribution, and reproduction in any medium, provided the original author and source are credited.