
Immunotherapy: Open Access
Open Access
ISSN: 2471-9552

ISSN: 2471-9552
Research Article - (2022)Volume 8, Issue 3
Adipocyte enhancer-binding protein 1 (AEBP1) is differentially expressed in various tumors. However, the relationship between AEBP1 and immune cell infiltration in Gastric Cancer (GC) remains unclear. Epigenetic regulation and transcriptional expression of AEBP1 in various clinicopathological parameters were detected using UALCAN database. Associations between infiltrating immune cells and their corresponding gene marker panels and AEBP1 expression were examined using the TIMER database. Kaplan-meier survival curve was used to evaluate the relationship between AEBP1 expression and overall survival and progression-free survival. AEBP1 expression in GC tissues was higher than that in normal tissues (P<0.05). The high expression of AEBP1 and the high methylation level of AEBP1 were associated with the high incidence and TNM stage of malignant tumor. In addition, the expression of AEBP1 in GC was associated with immune-related genes such as CD3E, CD3D, and CD2, and immune-infiltrating cells such as CD8+ T-cells and CD4+ T-cells, neutrophils, and macrophages. The methylation sites CG00009293, CG08495088, CG12955216, CG10480062, CG06852744, and CG12978582 were related to the low expression of AEBP1. AEBP1 may be a potential oncogenic gene and a new therapeutic target and predictive biomarker for gastric cancer. In immune cell infiltration, AEBP1 may play an important role.
AEBP1; Gastric cancer; Immune cells; Immune genes, Methylation
Data source
TCGA (https://genome-cancer.ucsc.edu/) provides scholars and researchers with clinical and pathological information on 33 types of cancer. Data of GC patients with RNA-Seq expression and matching clinico pathological information was obtained through the TCGA tool cancer browser. Because the database is publicly available and accessible, approval from the local ethics committee was not necessary.
GEO database
The GEO database is a comprehensive gene expression library in the National Center for Biotechnology Information (NCBI) (https://www.ncbi.nlm.nih.gov/geo/), as one of the largest collections of gene chips in the world.
Expression profile and correlation analysis
UALCAN is a public server for analyzing cancer OMICS data (TCGA and MET500), providing high-quality graphics via javascript and CSS, based on PERL-CGI, providing graphs and genes depicting genes, epigenetic regulation, survival information, and correlation among map expression [26]. Analysis of AEBP1 expression and promoter methylation in GC can be performed based on clinicopathological features including TP53 mutation status, lymph node metastasis status, histological subtype, patients’ age, sex, individual cancer stage, and sample type.
Immunochemistry
The tissue resected under the endoscope was placed in 10% formalin, the excess fixative was washed with water, and then 75% alcohol, 85% alcohol for 12 hours, 95% alcohol, and 100% alcohol for 4 hours each, and the tissue block was placed in xylene for transparency. Put the melted paraffin into the tissue, embed the tissue in paraffin solution, slice, remove, bake, and soak in xylene I and xylene II for 10 minutes each. They were subjected to a temperature of 60 ◦C for 2 h, deparaffinized, hydrated with xylene and ethanol, and then the recovered nuclear antigen was washed with PBS and hydrogen peroxide solution. Additional slices were randomly selected and incubated with rabbit anti-AEBP1 antibody (#ab254973; Abcam, Shanghai, China) at 4 ◦Co vernight, followed by HRP incubated goat anti rabbit mouse universal antibody (1:3000, ab182016, Shanghai, China) for 60 min at room temperature. After the slides were placed in PBS and decolorized, they were developed with DAB chromogenic solution. In addition, all slides (nuclei) were counterstained with 5 μg/mL Harris at room temperature for 3 min. Finally, the image was captured under a microscope (Nikon Eclipse E200; Tokyo, Japan).
Statistical analysis survival
On the basis of the AEBP1 median expression, patients in the experimental group and the validation groups were divided into two subgroups: low AEBP1 expression and high AEBP1 expression. The effect of AEBP1 expression level on the clinical outcomes of GC patients was investigated accessing Kaplan-Meier (KM) survival curves, and a prognostic classifier was constructed to compare survival differences. The KM survival curve was implemented with the survminer package. Kaplan-Meier plotter (https://kmplot.com/analysis/)) verified the association between AEBP1 expression and total cancer survival. Kaplan-Meier plotter system consists of gene chips and RNA-seq data.
TIMER database analysis
In GC patients, the association between the expression of AEBP1 and the four infiltrating immune cells (neutrophils, macrophages, CD8+ T-cells, CD4+ T-cells) and immune-related genes (CD2, DC3D and CD3E) was evaluated accessing the TIMER database(http://timer.cistrome.org/).
Meta-analysis
A meta-analysis of data from TCGA, GEO, and ICGC databases was performed to evaluate the significance of AEBP1 expression for GC prognosis. Heterogeneity among the included studies was decided by the I2-value obtained from the Cochrane Q test and the P-value obtained from the chi-square test. In cases of heterogeneity (I2 ≥ 50% or P<0.05), the results were summarized using a random- effects model. Otherwise, a fixed-effect model was used for analysis. The meta R package (R version 4.0.0) was accessed to implement the meta-analysis.
GO and KEGG enrichment analyses
GO and KEGG enrichment analyses were performed using the R packages "org. Hs.eg.db," "ggplot2," "Cluster Profiler" and "enrich plot and R 4.0.2." When P<0.05, the term is considered to be significantly enriched.
Patient characteristics
The analysis included detailed clinical prognostic information and RNA-sequencing data from 378 samples from the TCGA database. Patients were divided into a high expression group (n=169) and a low expression group (n=169). Age, gender, lymphatic metastasis, metastasis didn’t significant difference between the low and high expression groups (P=0.5002, 0.7321, 0.5366, 0.6563). Grade, tumor size and stage was markedly different between the expression groups of high and low (P=0.0383, 1.00E-04, 0.017) (Table 1).
| Covariates | Type | Total | High | Low | P value |
|---|---|---|---|---|---|
| Age | <=65 | 155 (45.86%) | 82(48.52%) | 73 (43.2%) | 0.5002 |
| Age | >65 | 179 (52.96%) | 87(51.48%) | 92 (54.44%) | |
| Age | Unknow | 4 (1.18%) | 0(0%) | 4 (2.37%) | |
| Grade | G1 | 8 (2.37%) | 3(1.78%) | 5 (2.96%) | 0.0383 |
| Grade | G2 | 123 (36.39%) | 51(30.18%) | 72(42.6%) | |
| Grade | G3 | 198 (58.58%) | 110(65.09%) | 88(52.07%) | |
| Grade | Unknow | 9 (2.66%) | 5(2.96%) | 4(2.37%) | |
| M | M0 | 301 (89.05%) | 151(89.35%) | 150 (88.76%) | 0.6563 |
| M | M1 | 19 (5.62%) | 8(4.73%) | 11 (6.51%) | |
| M | Unknow | 18 (5.33%) | 10(5.92%) | 8 (4.73%) | |
| N | N0 | 103 (30.47%) | 53(31.36%) | 50 (29.59%) | 0.5366 |
| N | N1 | 87 (25.74%) | 40(23.67%) | 47 (27.81%) | |
| N | N2 | 71(21.01%) | 33(19.53%) | 38 (22.49%) | |
| N | N3 | 69(20.41%) | 39(23.08%) | 30 (17.75%) | |
| N | Unknow | 8 (2.37%) | 4(2.37%) | 4 (2.37%) | |
| T | T1 | 18(5.33%) | 1(0.59%) | 17 (10.06%) | 1.00E-04 |
| T | T2 | 67 (19.82%) | 29(17.16%) | 38 (22.49%) | |
| T | T3 | 160 (47.34%) | 81(47.93%) | 79 (46.75%) | |
| T | T4 | 93 (27.51%) | 58(34.32%) | 35 (20.71%) | |
| T | Unknow | 0 (0%) | 0(0%) | 0 (0%) | |
| Gender | Female | 118 (34.91%) | 57(33.73%) | 61(36.09%) | 0.7321 |
| Gender | Male | 220 (65.09%) | 112(66.27%) | 108 (63.91%) | |
| Stage | Stage I | 1 (0.3%) | 0(0%) | 1(0.59%) | 0.017 |
| Stage | Stage I | 45 (13.31%) | 13(7.69%) | 32(18.93%) | |
| Stage | Stage II | 108 (31.95%) | 62(36.69%) | 46 (27.22%) | |
| Stage | Stage III | 145(42.9%) | 76(44.97%) | 69 (40.83%) | |
| Stage | Stage IV | 29 (8.58%) | 13(7.69%) | 16 (9.47%) | |
| Stage | Unknown | 10 (2.96%) | 5(2.96%) | 5 (2.96%) | |
| Expression | High | 169 (50%) | 169(100%) | - | 0 |
| Expression | Low | 169 (50%) | - | 169 (100%) | |
| Methylation | High | 169 (50%) | 80(47.34%) | 89 (52.66%) | 0.3841 |
| Methylation | Low | 169 (50%) | 89(52.66%) | 80 (47.34%) |
Table 1: Association between clinicopathological characteristics of patients and AEBP1 expression in tumor with GC.
AEBP1 expression is lower in normal tissues than in cancer samples
Analysis of the mRNA expression levels of AEBP1 in TCGA samples showed that AEBP1 expression was higher in cancer samples than in normal tissues (P<0.022) Figures 1A and 1B.
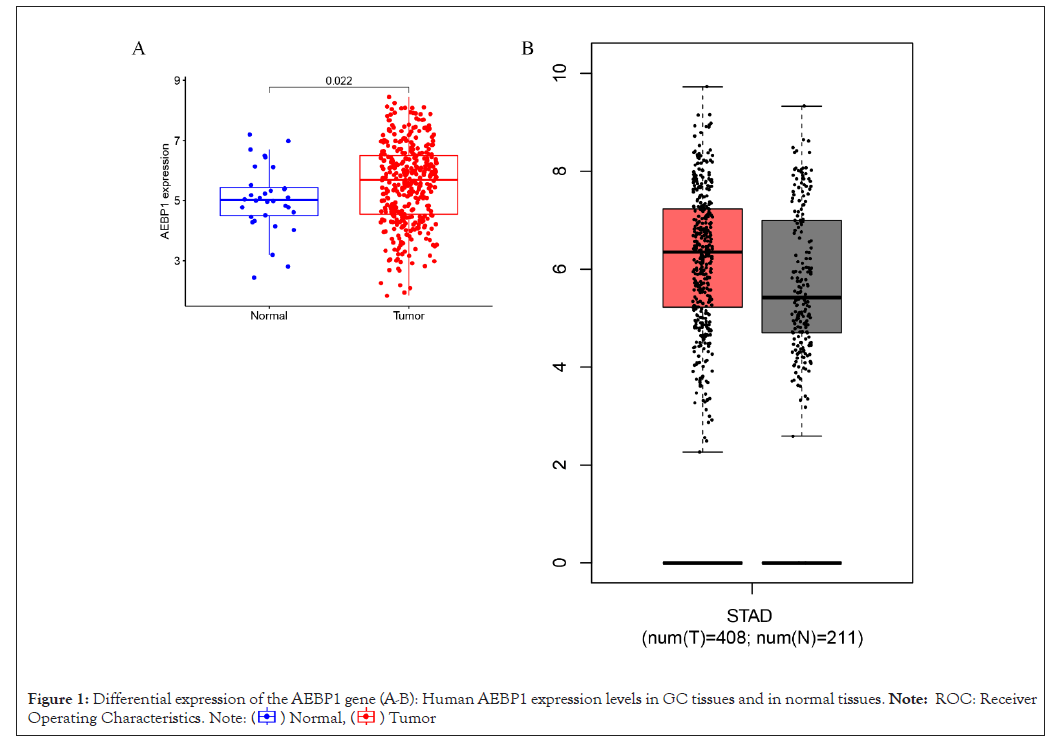
Figure 1: Differential expression of the AEBP1 gene (A-B): Human AEBP1 expression levels in GC tissues and in normal tissues. Note: ROC: Receiver
Operating Characteristics. .
.
Epigenetic regulation and transcriptional expression of AEBP1 in various clinicopathological parameters AEBP1 expression in GCs was analyzed using the UALCAN server according to different clinicopathological parameters (such as individual cancer stage, sample type, cancer grade, patient gender and age, histological subtype, TP53 mutation status, and lymph node metastasis status) (Table 2).
| Variables | Different stages | N | Comparisons | Statistical significance |
|---|---|---|---|---|
| Statistical significance | Normal | 41 | Normal vs. primary tumor | 3.64E-05 |
| Primary tumor | 286 | |||
| Individual cancer stages | Stage 1 | 34 | Normal-vs.-Stage1 | 1.02E-02 |
| Stage 2 | 123 | Normal-vs.-Stage2 | 2.47E-06 | |
| Stage 3 | 169 | Normal-vs.-Stage3 | 1.64E-04 | |
| Stage 4 | 41 | Normal-vs.-Stage4 | 2.38E-03 | |
| Patients age | 21-40 yrs | 34 | Normal-vs.-Age (21-40Yrs) | 8.88E-01 |
| 41-60 yrs | 4 | Normal-vs.-Age (41-60Yrs) | 1.54E-06 | |
| 61-80 yrs | 128 | Normal-vs.-Age (61-80Yrs) | 1.21E-04 | |
| 81-100 yrs | 253 | Normal-vs.-Age (81-100Yrs) | 3.83E-01 | |
| Histological subtype | Adenocarcinoma NOS | 155 | Normal-vs.-Adenocarcinoma (NOS) | 2.01E-06 |
| Adenocarcinoma Diffuse | 69 | Normal-vs.-Adenocarcinoma (Diffuse) | 6.91E-07 | |
| Adenocarcinoma Signet Ring | 12 | Normal-vs.-Adenocarcinoma (Signet Ring) | 7.74E-02 | |
| Intestinal Adenocarcinoma NOS | 73 | Normal-vs.-Intestinal Adenocarcinoma (NOS) | 5.13E-02 | |
| Intestinal Adenocarcinoma Tubular | 76 | Normal-vs.-Intestinal Adenocarcinoma (Tubular) | 6.85E-01 | |
| Intestinal Adenocarcinoma Mucinous | 20 | Normal-vs.-Intestinal Adenocarcinoma (Mucinous) | 8.20E-04 | |
| Intestinal Adenocarcinoma Papillary | 7 | Normal-vs.-Intestinal Adenocarcinoma (Papillary) | 7.73E-01 | |
| Nodal metastasis status | N0-No regional lymph node metastasis | 123 | Normal-vs.-N0 | 9.88E-05 |
| N1- Metastases in 1 to 3 axillary lymph nodes | 112 | Normal-vs.-N1 | 8.79E-04 | |
| N2-Metastases in 4 to 9 axillary lymph nodes | 79 | Normal-vs.-N2 | 2.92E-03 | |
| Metastases in 10 or more axillary lymph nodes | 82 | Normal-vs.-N3 | 1.38E-04 | |
| TP53 mutation status | TP53 mutation status | 178 | Normal-vs.-TP53-Mutant | 2.58E-03 |
| TP53 non-mutant | 235 | Normal-vs.-TP53-NonMutant | 2.21E-06 |
Table 2: The AEBP1 mRNA expression for GC on the ground of different clinicopalthoogical parameters accessing UALCAN.
The results demonstrated that the expression of AEBP1 in GC tissues of different clinical stages was higher than that in normal tissues. AEBP1 expression tended to increase in advanced stages of cancer. (Stage 4>Stage 3> Stage 1) and decreased with increasing patient age groups. The expression of AEBP1 gene was also found to increase with increasing lymph node metastatic status (N3>N2>N1).
The occurrence and development of human cancer is related to DNA methylation [27]. According to our data, it is obvious that the promoter methylation of AEBP1 less expressed in GC tissues than in normal tissues, and is negatively regulated for all other clinicopathological parameters (Table 3). It reflects that the expression of promoter methylation in tissues decreases with the development of cancer stage and lymph node metastasis status (N0>N1>N3). The results suggest that AEBP1 mRNA expression is negatively correlated with promoter methylation, and that hyper methylation of the AEBP1 promoter may play a repressive role in cancer development (Figures 2A-2L).
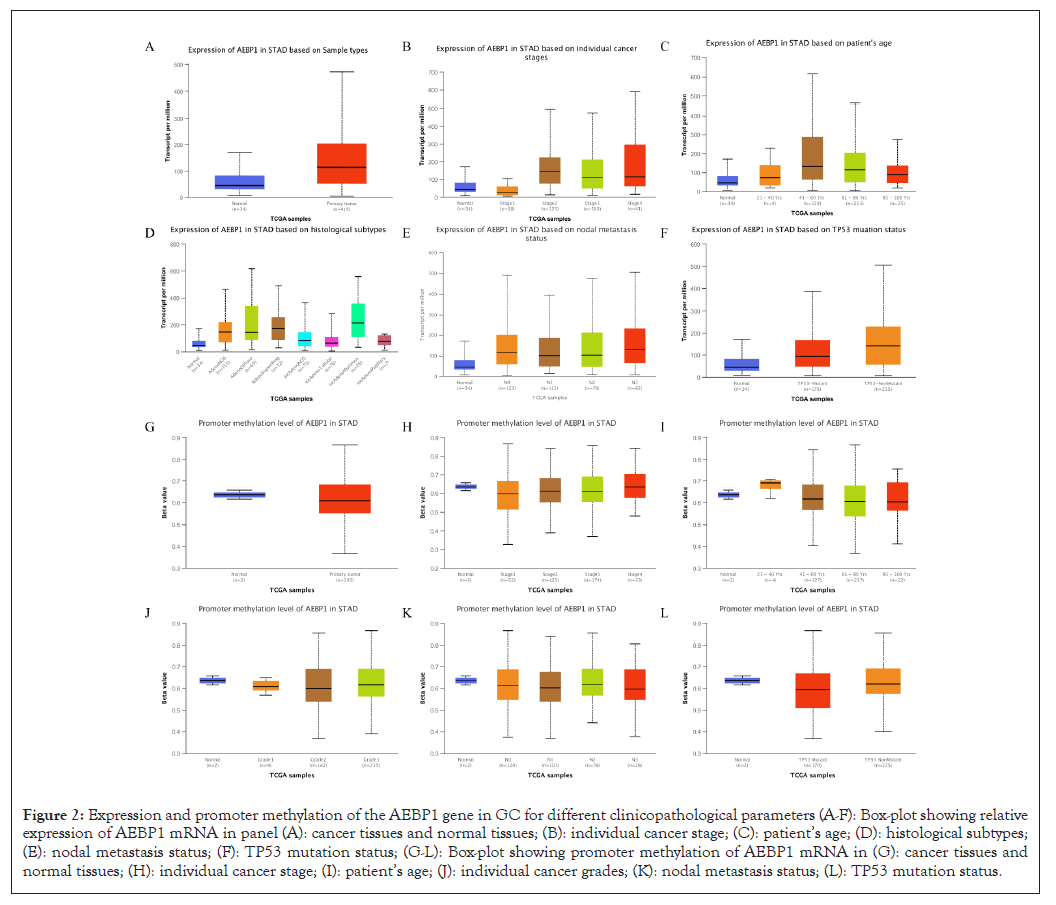
Figure 2: Expression and promoter methylation of the AEBP1 gene in GC for different clinicopathological parameters (A-F): Box-plot showing relative expression of AEBP1 mRNA in panel (A): cancer tissues and normal tissues; (B): individual cancer stage; (C): patient’s age; (D): histological subtypes; (E): nodal metastasis status; (F): TP53 mutation status; (G-L): Box-plot showing promoter methylation of AEBP1 mRNA in (G): cancer tissues and normal tissues; (H): individual cancer stage; (I): patient’s age; (J): individual cancer grades; (K): nodal metastasis status; (L): TP53 mutation status.
| Variables | Different stages | N | Comparisons | Statistical significance |
|---|---|---|---|---|
| Statistical significance | Normal | 2 | Normal vs. primary tumor | 3.64E-05 |
| Primary tumor | 235 | |||
| Individual cancer stages | Stage 1 | 34 | Normal-vs.-Stage1 | 6.43E-01 |
| Stage 2 | 123 | Normal-vs.-Stage2 | 7.49E-01 | |
| Stage 3 | 169 | Normal-vs.-Stage3 | 7.67E-01 | |
| Stage 4 | 41 | Normal-vs.-Stage4 | 9.80E-01 | |
| Patients age | 21-40 yrs | 4 | Normal-vs.-Age(21-40Yrs) | 2.77E-01 |
| 41-60 yrs | 127 | Normal-vs.-Age(41-60Yrs) | 8.62E-01 | |
| 61-80 yrs | 237 | Normal-vs.-Age(61-80Yrs) | 6.98E-01 | |
| 81-100 yrs | 22 | Normal-vs.-Age(81-100Yrs) | 6.49E-01 | |
| Histological subtype | Grade1 | 9 | Normal-vs.-Grade1 | 6.32E-01 |
| Grade2 | 142 | Normal-vs.-Grade2 | 7.18E-01 | |
| Grade3 | 235 | Normal-vs.-Grade3 | 7.81E-01 | |
| Nodal metastasis status | N0-No regional lymph node metastasis | 124 | Normal-vs.-N0 | 7.72E-01 |
| N1- Metastases in 1 to 3 axillary lymph nodes | 101 | Normal-vs.-N1 | 6.94E-01 | |
| N2-Metastases in 4 to 9 axillary lymph nodes | 79 | Normal-vs.-N2 | 9.36E-01 | |
| Metastases in 10 or more axillary lymph nodes | 28 | Normal-vs.-N3 | 5.99E-01 | |
| TP53 mutation status | TP53 mutation status | 170 | Normal-vs.-TP53-Mutant | 5.87E-01 |
| TP53 non-mutant | 225 | Normal-vs.-TP53-NonMutant | 8.82E-01 |
Table 3: The AEBP1 promoter methylation for GC on the ground of different clinicopathological parameters using UALCAN.
GC AEBP1 expression analysis
The expression of AEBP1 in GC was confirmed by immunohistochemistry Figures 3A-3F. The results confirmed that AEBP1 expression was higher in GC tissues than in normal gastric tissues.
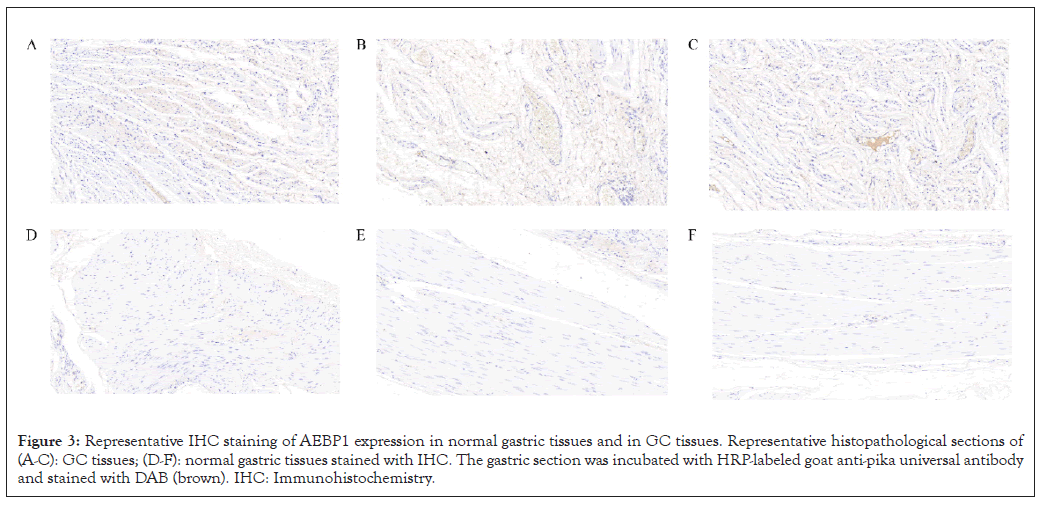
Figure 3: Representative IHC staining of AEBP1 expression in normal gastric tissues and in GC tissues. Representative histopathological sections of (A-C): GC tissues; (D-F): normal gastric tissues stained with IHC. The gastric section was incubated with HRP-labeled goat anti-pika universal antibody and stained with DAB (brown). IHC: Immunohistochemistry.
Higher AEBP1 mRNA expression in GC is associated with shorter OS
On the basis of the KM chart, GC patients with higher AEBP1 mRNA expression had a shorter OS (P=0.007, 0.003, 0.011), methylation sites cg27493928, cg25289803, cg08739576, cg06128448, cg02126753 GC cases with lower AEBP1 mRNA expression had a shorter OS (P=0.007, 0.003, 0.04, 0.046, 0.034), methylation sites cg12978582 GC patients with higher AEBP1 mRNA expression had a shorter OS (P=0.043), methylation sites cg1083171, cg25289803, cg27493928 GC cases with higher AEBP1 mRNA expression had a shorter progression-free survival (P=0.038, 0.017, 0.040) in the test cohort. These results suggested that AEBP1 expression in GC was higher than that in normal gastric tissue. Two data sets were selected for meta-analysis to evaluate the correlation between Overall Survival (OS) and AEBP1 gene expression and obtain more objective conclusions. Since statistically remarkable differences did not exist between the two datasets (P=0.54, I2=0%), the fixed-effects model was used to evaluate the 95% Confidence Interval (CI) and combined risk ratio (HR). The relatively high expression of aebp1 gene was remarkably related to poor OS (HR=1.20, 95% CI:1.10-1.30, P<0.0001; suggesting that aebp1 may be a predictor of poor OS (Figures 4A-4G).
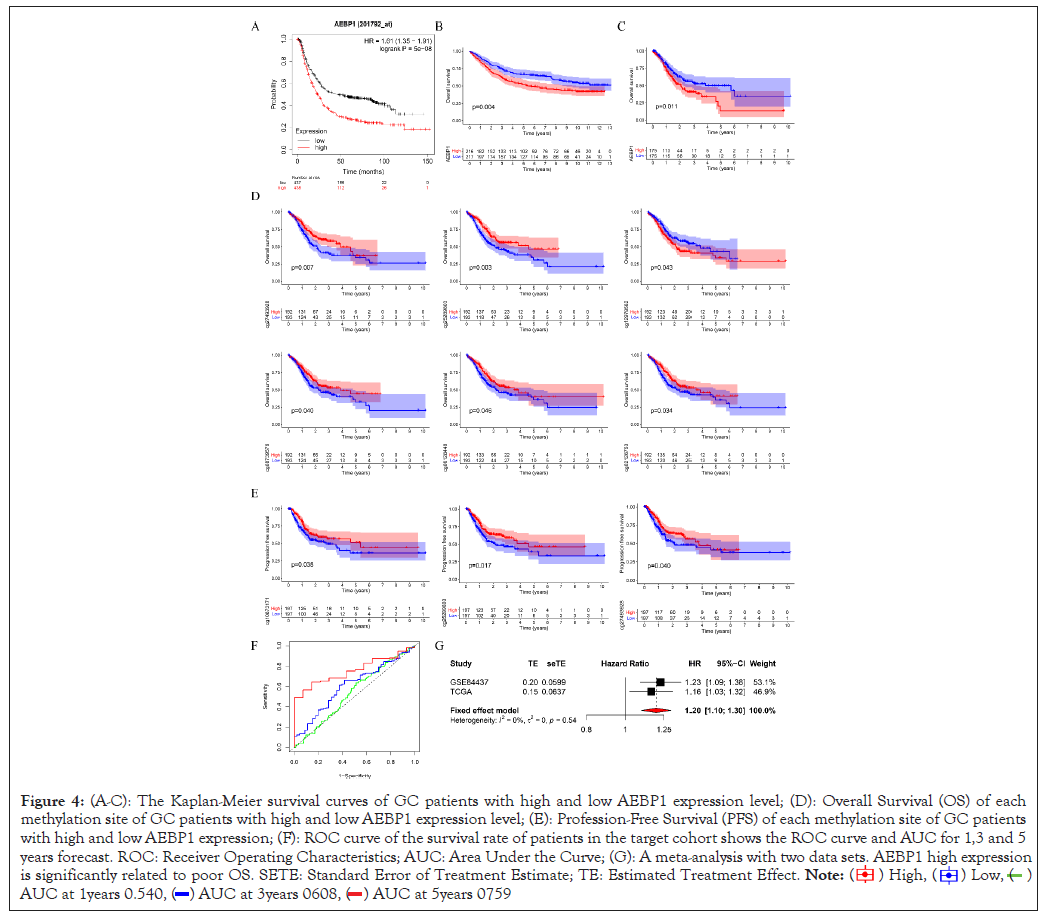
Figure 4: (A-C): The Kaplan-Meier survival curves of GC patients with high and low AEBP1 expression level; (D): Overall Survival (OS) of each
methylation site of GC patients with high and low AEBP1 expression level; (E): Profession-Free Survival (PFS) of each methylation site of GC patients
with high and low AEBP1 expression; (F): ROC curve of the survival rate of patients in the target cohort shows the ROC curve and AUC for 1,3 and 5
years forecast. ROC: Receiver Operating Characteristics; AUC: Area Under the Curve; (G): A meta-analysis with two data sets. AEBP1 high expression
is significantly related to poor OS. SETE: Standard Error of Treatment Estimate; TE: Estimated Treatment Effect.
 .
.
Accordingly, the ROC curve analysis and measurement based on the accuracy and prediction ability of the risk characteristics expressed by AEBP1, the results show that the predicted AUCs of 1,3 and 5 years are 0.540, 0.608 and 0.759 respectively. And check the prediction ability and accuracy of 1,3 and 5 years. Multivariate Cox analysis and univariate Cox analysis were accessed to examine whether AEBP1 can be an independent prognostic factor. These results showed that the p value of AEBP1 was less than 0.05, indicating that AEBP1 can be an independent prognostic factor. The risk ratio is greater than 1, suggesting that the expression of AEBP1 is highly predictive of risk. Compared with common clinical features, AEBP1 expression is more intimately associated to prognosis (Figures 5A and 5B).
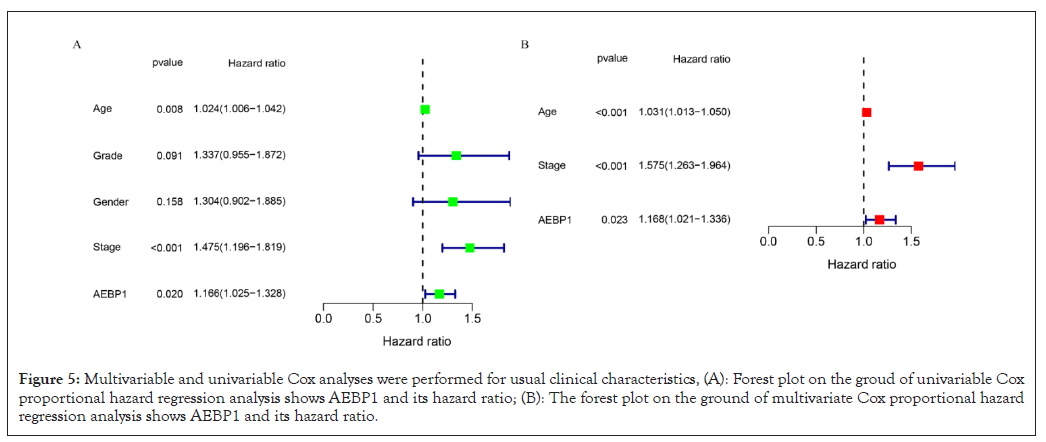
Figure 5: Multivariable and univariable Cox analyses were performed for usual clinical characteristics, (A): Forest plot on the groud of univariable Cox proportional hazard regression analysis shows AEBP1 and its hazard ratio; (B): The forest plot on the ground of multivariate Cox proportional hazard regression analysis shows AEBP1 and its hazard ratio.
Correlation between AEBP1 expression and clinical characteristics
Association analysis of AEBP1 mRNA expression and clinicopathological parameters in GC patients showed that AEBP1 expression decreased with age (P=0.043). AEBP1 high expression was related to the progression of GC from G2 to G3 (P<0.0015). In terms of tumor size, the high expression of AEBP1 has significant influence on the progression of GC from T1 to T2, T1 to T3 and T1 to T4 (P=8.6E-07, 2.7E-07, 1.9E-07). In terms of tumor staging, the high expression of AEBP1 was remakebly related to the progression of GC from stage I to stage II, from stage I to stage III, from stage I to stage IV, and from stage II to stage III (P=5.5E-05, 0.0026, 0.023, 0.083) . The methylation level of AEBP1 gene was correlated with T2 to T3 and T2 to T4 (P=0.0064, 0.042) (Figures 6A and 6B).

Figure 6: For different clinicopathological parameters, the expression of AEBP1 gene and AEBP1 gene methylation in GC. (A): Box-plot showing the relation of AEBP1 mRNA with age, gender, stage, tumour size; (B): Box-plot showing Methylation of AEBP1 mRNA in tumour size.
DNA methylation analysis
The degree of methylation of cg06852744 was the highest, followed from high to low by cg10480062, cg08495088, cg00009293, cg12955216, cg10873171, cg14249876, cg12978582, cg02126753, cg27493928, cg25289803, cg06128448, cg08739576 and cg01399219. Among them, methylation sites such as cg00009293, cg06852744, cg08495088, cg10480062, cg12955216 and cg12978582 were positively correlated with high expression of AEBP1. The sites cg25289803, cg14249876, cg08739576, cg06128448, cg02126753, cg01399219, cg27493928, cg07476508, and cg10873171 methylation sites were negatively related to AEBP1 high expression (Figures 7A-7C).
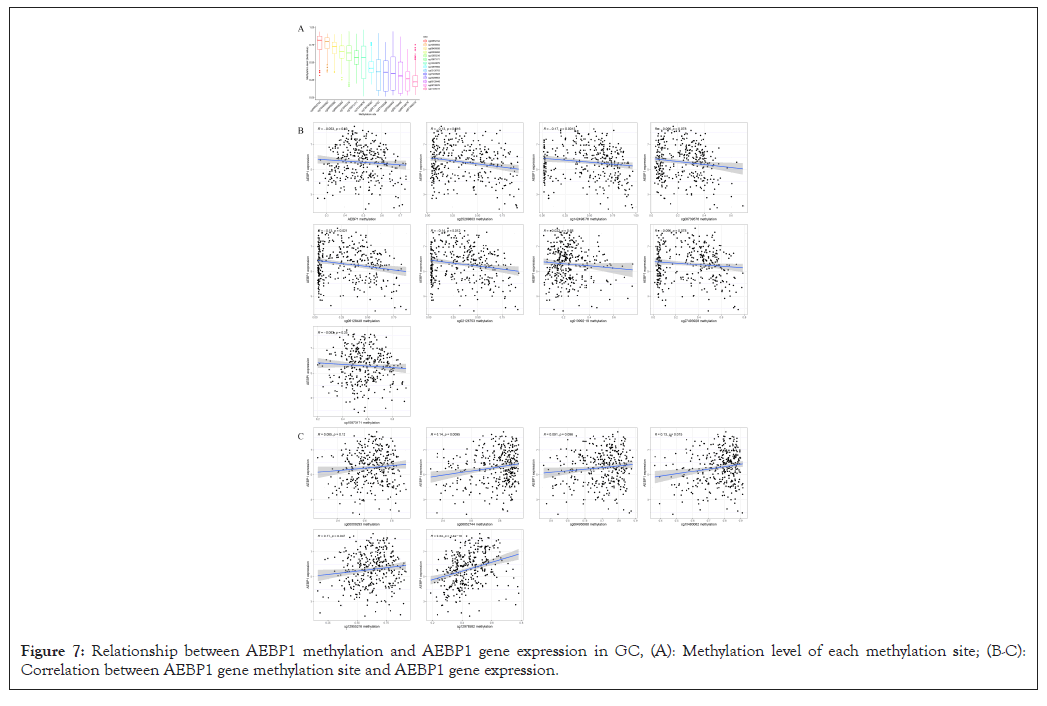
Figure 7: Relationship between AEBP1 methylation and AEBP1 gene expression in GC, (A): Methylation level of each methylation site; (B-C): Correlation between AEBP1 gene methylation site and AEBP1 gene expression.
AEBP1 methylation level in normal control group was higher than that in GC group, suggesting that methylation changes were related to abnormal expression of AEBP1. In addition, DNA methylation may be related to the pathogenesis of GC and the high AEBP1 expression in tumor tissues.
Correlation analysis between infiltrating immune cells and AEBP1 expression
The survival of individual cancer patients is affected by tumor- infiltrating lymphocytes. Therefore, we studied the relationship between AEBP1 expression and three immune related genes (CD3E, CD3D, CD2) and four infiltrating immune cells (CD8+ T cells, CD4+ T cells, Macrophages, Neutrophils). The results showed that the expression level of AEBP1 was significantly positively correlated with the infiltration levels of neutrophils (r=0.27, P=8.76 e-08), macrophages (r=0.658, P=1.4 e-48), CD4+ T cells (r=0.275, P=5.34 e-08), CD8+ T cells (r=0.382, P=1.18 e-04), Zhang (r=0.235, P=1.25 e-06), cd3d (r=0.177, P=2.94 e-04) and cd3e (r=0.227, P=3.08e-06) (2022.1.1). With P<0.05 as the significant level Figure 8). The results showed that the high expression of AEBP1 is correlated to the immunosuppressive microenvironment.
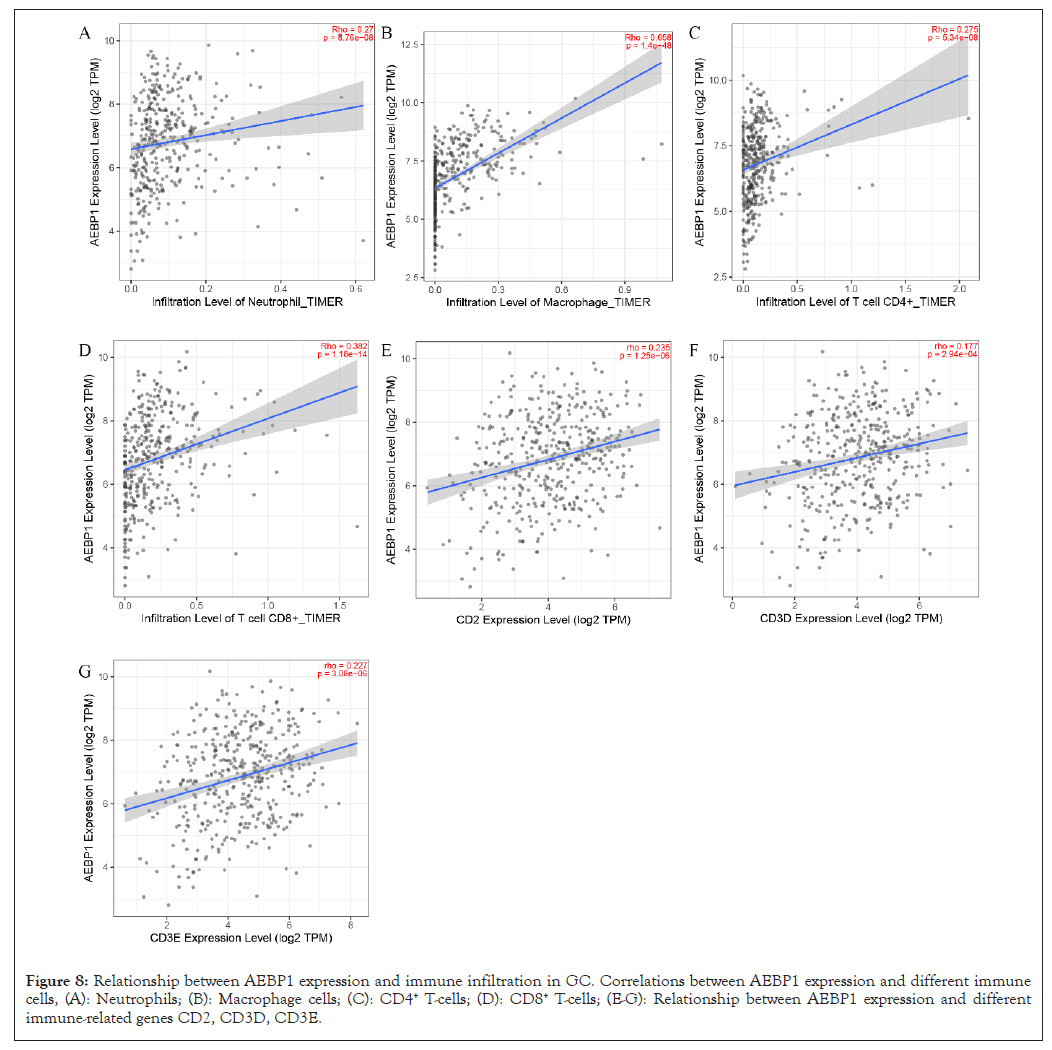
Figure 8: Relationship between AEBP1 expression and immune infiltration in GC. Correlations between AEBP1 expression and different immune cells, (A): Neutrophils; (B): Macrophage cells; (C): CD4+ T-cells; (D): CD8+ T-cells; (E-G): Relationship between AEBP1 expression and different immune-related genes CD2, CD3D, CD3E.
KEGG pathway analysis and GO enrichment analysis were performed. Figure 9A shows the top 30 significantly enriched up regulated pathways. GO pathway analysis revealed that extracellular structure organization (GO: 0043062, P=4.8e-60), extracellular matrix organization (GO: 0030198, P=4.01e-60), collagen fibril organization (GO:0030199, P=1.47e-27), and ossification (GO: 0001503, P=1.77e-20) was associated with relatively high expression of AEBP1 (Figure 9A). The KEGG pathway analysis identified many enriched pathways, including ossification and cell-substrate adhesion, collagen fibril organization, extracellular structure organization, extracellular matrix organization, and AEBP1 genes were strongly linked in Figure 9B.
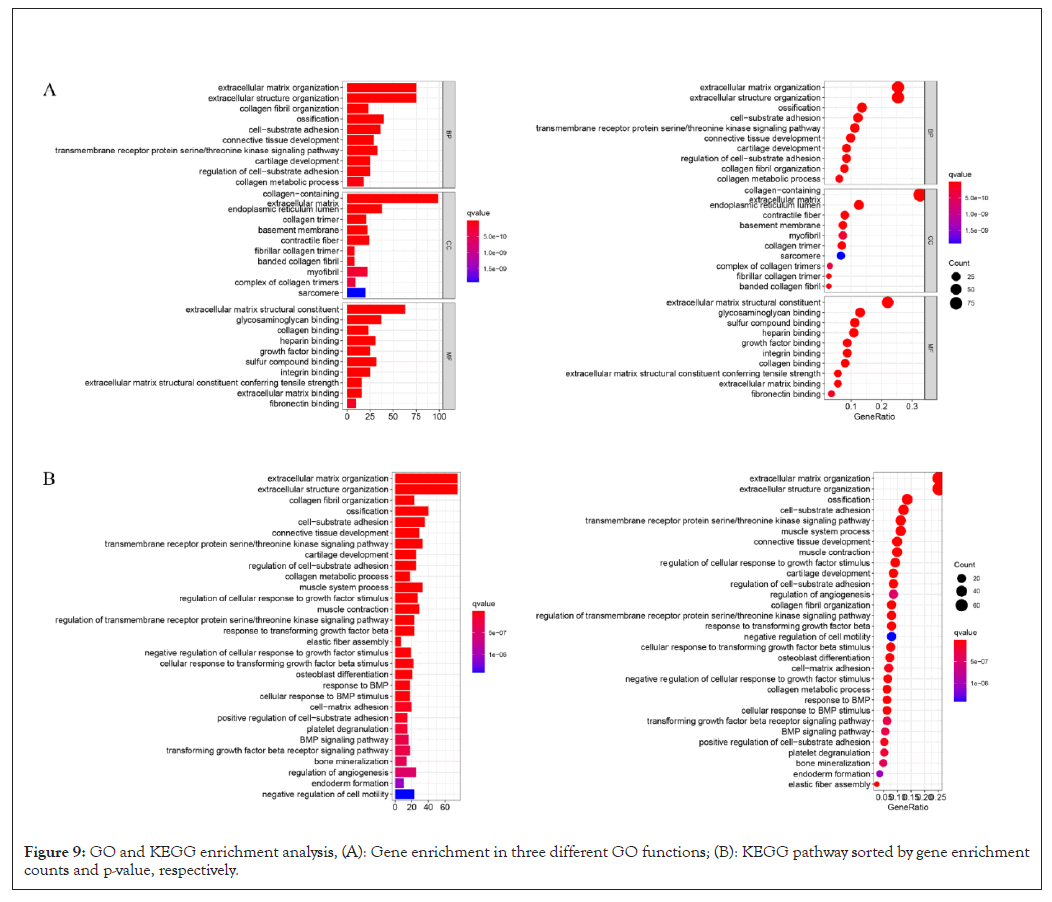
Figure 9: GO and KEGG enrichment analysis, (A): Gene enrichment in three different GO functions; (B): KEGG pathway sorted by gene enrichment counts and p-value, respectively.
Adipocyte enhancer-binding protein 1 (AEBP1) was found in adipocytes and has been implicated in many biological processes, incorporating cholesterol homeostasis and inflammation [28], adipogenesis [29] and cell differentiation [29]. Studies have found that AEBP1 can promote the occurrence and development of tumors [31-33]. We found that AEBP1 expression was up-regulated in GC, which was consistent with previous research results [31-33].
The mRNA expression profile of the AEBP1 gene obtained from the GC TCGA dataset from the UALCAN server was revealed in various clinicopathological parameters including patient age, cancer stage, lymph node metastasis status and TP53 mutation. Epigenetic changes in this gene are known to be a major cause of tumor transformation, and in this regard, our results on promoter methylation of the AEBP1 gene for different parameters showed a negative correlation with the expression profile, suggesting that hypermethylation of the AEBP1 gene may Regulates the development of cancer.
Additionally, we found that AEBP1 is a new potential therapeutic target and predictive biomarker of GC. AEBP1 can be used as a prognostic indicator of immune status. The higher expression and methylation of AEBP1 in tumor tissues are related to the infiltration of immune cells. In addition, our results suggest that tumor size is associated with methylation levels of AEBP1. AEBP1 was associated with age, grade, stage and tumor size. KEGG pathway analysis and GO functional enrichment analysis suggested that AEBP1 was remarkably related to tumorigenesis, tumor development pathways, including extracellular matrix organization [35] and cell-substrate adhesion [36]. The gastric ECM is mainly composed of collagen, which is essential for regulating cell division, differentiation, proliferation, growth, migration and apoptosis. This indicates that it plays a vital part in the development and progression of cancer [37,38]. Using the TIMER database, we revealed for the first time that AEBP1 expression in GC was correlated with the infiltration of various immune cells. The prognosis and efficacy of chemotherapy and immunotherapy may be affected by tumor-infiltrating lymphocytes, such as tumor-associated macrophages and tumor- infiltrating neutrophils [38]. However, the relationship between immune cell infiltration and AEBP1 expression has not been revealed. We investigated the relationship between GC immune infiltration level and AEBP1 expression through TIMER website. AEBP1 gene was related to neutrophils, macrophages, CD8+ T-cells, CD4+ T-cells, CD2, CD3D and CD3E gene infiltration. Our results confirm that immune cell infiltration level is critical for GC progression and that AEBP1 expression is a predictor of increased immune cell infiltration. These results provide ideas for further study of the correlation between AEBP1 and GC immune infiltration.
There are some limitations to this study. The significance of AEBP1 in predicting the prognosis of GC and developing therapeutic strategies needs further experimental verification. The biological part of AEBP1 in GC needs to be confirmed by more tumor specimens and further experiments. In addition, according to the requirements of data types, including mRNA expression and methylation expression, we only obtained data from TCGA, which may lead to data bias in this study.
This study renders important prove for the importance of AEBP1 in the prognosis of human GC. We found that AEBP1 is a novel biomarker and elucidate its prognostic potential in GC through online public database analysis. It is the basis of the occurrence of GC to study its biological function and its part in immune infiltration and to elucidate the mechanism of its relatively high expression. Our results suggest that AEBP1 may be a potential oncogenic gene for GC. AEBP1 may be a predictive biomarker and new potential therapeutic target. Our experimental data provide insights for further research and the development of appropriate treatment strategies. In addition, we are working on GC cell lines and mouse models to validate the current findings and develop effective treatment strategies by targeting the AEBP1 gene.
The Department of Finance of Hubei Province and the Department of Science and Technology of Hubei Province, under a special project of the Hubei Provincial Central Government for guiding local science and technology development (Xiaodong Huang, grant no. 2019ZYYD067), and by the Youth Project of Health Commission of Wuhan (Xiaoli Chen, grant no. WX20Q17).
[Cross ref] [Google Scholar] [Pubmed].
[Cross ref] [Google Scholar] [Pubmed].
[Cross ref] [Google Scholar] [Pubmed].
[Cross ref] [Google Scholar] [Pubmed].
[Cross ref] [Google Scholar] [Pubmed].
[Cross ref] [Google Scholar] [Pubmed].
[Cross ref] [Google Scholar] [Pubmed].
[Cross ref] [Google Scholar] [Pubmed].
[Cross ref] [Google Scholar] [Pubmed].
[Cross ref] [Google Scholar] [Pubmed].
[Cross ref] [Google Scholar] [Pubmed].
[Cross ref] [Google Scholar] [Pubmed].
[Cross ref] [Google Scholar] [Pubmed].
[Cross ref] [Google Scholar] [Pubmed].
[Cross ref] [Google Scholar] [Pubmed].
[Cross ref] [Google Scholar] [Pubmed].
[Cross ref] [Google Scholar] [Pubmed].
[Cross ref] [Google Scholar] [Pubmed].
[Cross ref] [Google Scholar] [Pubmed].
[Cross ref] [Google Scholar] [Pubmed].
[Cross ref] [Google Scholar] [Pubmed].
[Cross ref] [Google Scholar] [Pubmed].
[Cross ref] [Google Scholar] [Pubmed].
[Cross ref] [Google Scholar] [Pubmed].
[Cross ref] [Google Scholar] [Pubmed].
[Cross ref] [Google Scholar] [Pubmed].
[Cross ref] [Google Scholar] [Pubmed].
[Cross ref] [Google Scholar] [Pubmed].
[Cross ref] [Google Scholar] [Pubmed].
[Cross ref] [Google Scholar] [Pubmed].
[Cross ref] [Google Scholar] [Pubmed].
[Cross ref] [Google Scholar] [Pubmed].
[Cross ref] [Google Scholar] [Pubmed].
[Cross ref] [Google Scholar] [Pubmed].
[Cross ref] [Google Scholar] [Pubmed].
[Cross ref] [Google Scholar] [Pubmed].
[Cross ref] [Google Scholar] [Pubmed].
[Cross ref] [Google Scholar] [Pubmed].
Citation: Huang X, Tian X, Chen X, Wan Y, Chen M, Liu X, et al. (2022) AEBP1 Predicts Clinical Prognosis and is Associated with Immunocyte Infiltration in Gastric Cancer. Immunotherapy (Los Angel). 08:194.
Received: 02-May-2022, Manuscript No. IMT-22-16542; Editor assigned: 04-May-2022, Pre QC No. IMT-22-16542 (PQ); Reviewed: 19-May-2022, QC No. IMT-22-16542; Revised: 26-May-2022, Manuscript No. IMT-22-16542 (R); Published: 06-Jun-2022 , DOI: 10.35248/2471-9552.22.08.194
Copyright: © 2022 Huang X, et al. This is an open-access article distributed under the terms of the Creative Commons Attribution License, which permits unrestricted use, distribution, and reproduction in any medium, provided the original author and source are credited.