Journal of Tourism & Hospitality
Open Access
ISSN: 2167-0269
ISSN: 2167-0269
Research - (2023)Volume 12, Issue 2
Background: Climate Change and pollution are plagues of our time and, as a reaction, energy production relies more and more on Renewable Energy Sources (RESs). The introduction of Zero-Emission Vehicles (ZEVs) will lead to better air quality and Climate Change impacts mitigation. In fact, ZEVs do not emit neither Greenhouse gases nor pollutant substances, except for life cycle, frictions from break and wheels emissions. In addition, ZEVs integration in Smart Grids (SGs) contributes to a more efficient use of renewable energy since ZEVs can act as batteries (Vehicle-to-Grid paradigm). In the ‘LIFE for Silver Coast’ European Project, coordinated by PO.MO.S. (Polo per la Mobilità Sostenibile), a sustainable intermodal mobility system is developed aiming environmental preservation of the ‘Silver Coast’, an area in Italy of significant touristic and naturalistic interest. The system includes e-bikes, e-scooters, e-cars, e-buses and even e-boats with proper charging stations and an ICT platform for planning trips and booking tickets.
Methods: The Project pursues its goal through innovative solutions like: A four-independent-engines e-boat prepared for autonomous driving and a special paddle wheel designed for the shallow waters flora and fauna conservancy and Artificial Intelligence (AI) applications for e-boats autonomous driving and Energy Management for Energy Communities (EC).
Results: Four e-boats have been realized and moored in the project area, one of them being prepared for autonomous driving. Proper prototype AI algorithms for e-boat autonomous driving and EC Energy Management have been synthesized.
Conclusions: The project reached its environmental preservation targets by making its contribution to Research thanks to its innovative solutions.
Mobility system; Zero-emissions vehicles; Sustainability; Sustainable tourism; Electric boat; Environment; Air quality; Life cycle assessment; Air monitoring
Climate Change and pollution are plagues of our time. A 30% increment in CO2 emissions, since the Industrial Revolution, is expected [1]. As a reaction, energy production relies more and more on Renewable Energy Sources (RESs), and researchers are constantly looking for solutions to face those issues [2-4].
More specifically, the introduction of Zero-Emission Vehicles (ZEVs) will lead to a better air quality and Climate Change impacts mitigation [5-7]. In fact, ZEVs emit neither greenhouse gases nor pollutant substances, if life cycle, frictions from breaks and wheels emissions are excluded. In addition, their integration in Smart Grids (SGs) contributes to a more efficient use of renewable energy. SGs are large electrical grids [8,9] that include residential, commercial, industrial buildings and RESs generators like photovoltaic (PV) panels and wind turbines such that they are candidates to represent the energy management paradigm of the future. In fact, through the use of Energy Storage Systems (ESSs) and IT technologies for minimizing losses, green energy is conveyed to the consumers who need it and its excess is stored in ESSs for later use. In the context of Vehicle-to-Grid [10-12], ZEVs can act as ESSs thanks to their supplied batteries, making them be relevant nodes in SGs and, consequently, tools for environmental protection. In the ‘LIFE for Silver Coast’ European Project [13-15], coordinated by PO.MO.S (Polo per la Mobilità Sostenibile), a sustainable intermodal mobility system is developed aiming at the environmental preservation of the ‘Silver Coast’, an area in Italy of significant touristic and naturalistic interest. The Project comprises e-bikes, e-scooters, e-cars, e-buses and even e-boats for lagoon trips. Thanks to its experimental connotation, the Project pursues its goal through innovating solutions that are mostly focused on e-boats, developed by POMOS.
The e-boat design consists of a PV roof, an electric power train composed of an innovative Energy Storage System (ESS), an electric engine and a paddle wheel. Among the four e-boats, the so called 'Valentino III' counts four couples of electric engines and paddle wheels. Moreover, a special paddle wheel design helps to preserve the lagoon flora and fauna, since e-boats sail on shallow waters.
In Section 1, an overview of the Project ranges from a brief Project description to the presentation of the main environmental protection activities; in Section 2, the main innovative solution of the Project is reported leading to Conclusions.
Project overview
The LIFE Project aims at mitigating air pollutant and greenhouse emissions in ‘Silver Coast’, which is a naturalistically fascinating area in Tuscany (IT), by developing an innovative, sustainable and intermodal mobility system. Even though the Project is experimental in its nature, a fully functional mobility system is planned to start from the conclusion of pilot project, for permanently preserving air quality in ‘Silver Coast’ area, offering a reliable service over the years and spreading a new culture on sustainable mobility. More precisely, a sustainable mobility system both for residents and for tourists will be available and usable as a key target. Furtherly, aiming at the Energy Community paradigm, ICT implementations for Smart Grids in the Project area are in progress. Last but not least, it is worth mentioning that proper actions are under planning for replicability of the intermodal mobility system after the LIFE Project conclusion. In fact, the Project partnership has identified context that are similar to the Project area. Croatia, Lake Garda and Pianura Pontina (Lazio, Italy) are eligible areas for the LIFE Project replicability. The main features of the Project are shown below.
The project area: The ‘Silver Coast’consists of Monte Argentario, Orbetello, Magliano and Isola del Giglio and roughly counts 29,000 inhabitants. Nevertheless, in summer, an average visitors flow of about 3,00,000 per year occurs. In fact, the area is very attractive for tourists because of its naturalistic beauty. The natural reserve, which includes Orbetello, is interested by the migration of protected birds’ species (e.g. the pink flamingo). In Monte Argentario, along the Panoramic Road which connects Porto S. Stefano to Porto Ercole harbors, in Monte Argentario, it is possible to appreciate the view of the Tuscan Archipelago. Moreover, the WWF Oasis, the natural reserve of Duna Feniglia and the Isola del Giglio crystal clear sea are among the most beautiful attractive places of the ‘Silver Coast’. Hence, the yellow line represents the boundary of the project area. The red dots, on the other hand, indicate the most important cities in the area. As it can be seen, the Silver Coast includes the city of Orbetello but also Monte Argentario and the of Giannella and Feniglia tomboli. Furthermore, Isola del Giglio and Isola di Giannutri are also included in the boundaries of the project area. It should be noted that a part of the Maremma National Park is included in the Silver Coast. Giannella and Feniglia are two strips of land that connect Monte Argentario to the Peninsula. Giannella is located in the North, while Feniglia is located in the South. They are very important from a naturalistic point of view because their conformation is such that two lagoons rich in native fauna and flora form between them. On these lagoons the project e-boats are designed to navigate (Figure 1).
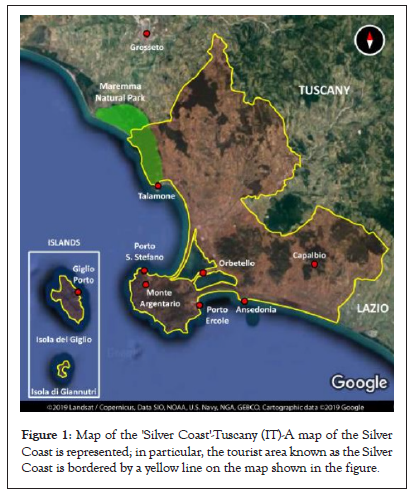
Figure 1: Map of the 'Silver Coast'-Tuscany (IT)-A map of the Silver Coast is represented; in particular, the tourist area known as the Silver Coast is bordered by a yellow line on the map shown in the figure.
The mobility system: In response to the increase of transport demand in summer, meeting the need of preserving the natural heritage besides the health of the resident population, a sustainable mobility system is developed in the LIFE Project. The mobility system, as a sustainable solution, involves only ZEVs and, as an intermodal solution, it counts different means of transport typologies: 14 e-cars, 20 e-scooters, 80 e-bikes and 4 e-boats. An overview of the mobility system is presented in Figure 2. The e-boats connect the strips of land in Giannella and Feniglia, which are stretches of lagoon between Monte Argentario and the Italian Peninsula. Charging stations, suitable for each mean of transport typology, are strategically installed in the Project Area (Figure 2).
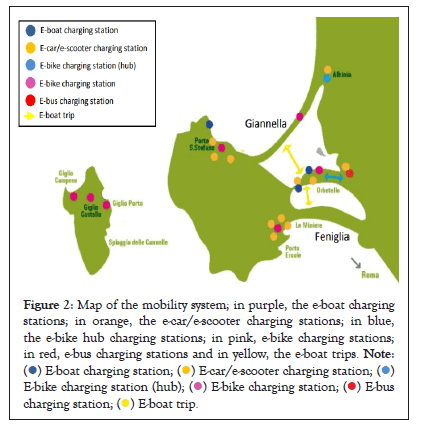
Figure 2: Map of the mobility system; in purple, the e-boat charging
stations; in orange, the e-car/e-scooter charging stations; in blue,
the e-bike hub charging stations; in pink, e-bike charging stations;
in red, e-bus charging stations and in yellow, the e-boat trips. Note: 


Air monitoring: Since the LIFE Project is focused on air quality; air monitoring is a prominent activity. Three monitoring stations installed in the Project Area collect data about air pollutants and greenhouse emissions (Figure 3).
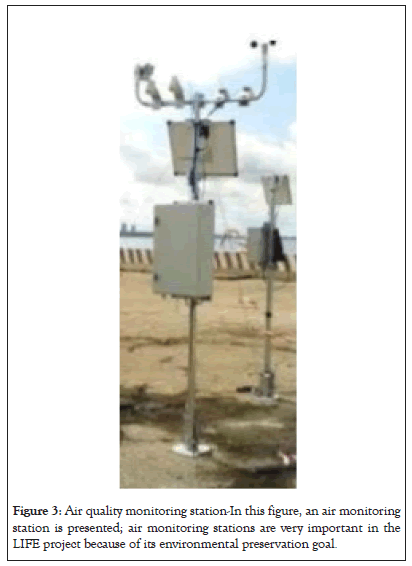
Figure 3: Air quality monitoring station-In this figure, an air monitoring station is presented; air monitoring stations are very important in the LIFE project because of its environmental preservation goal.
Data processing and analysis are carried out by a suited algorithm, which is developed in Matlab environment by POMOS. The algorithm loads raw data coming from the monitoring stations and returns different figures of the emissions i.e., mean, minimum and max values over the time interval of interest. Moreover, max emissions values are compared to the ARPAT (‘Agenzia Regionale per la Protezione Ambientale della Toscana’) thresholds and presented by plots like all the above-mentioned quantities (Figures 4 and 5).
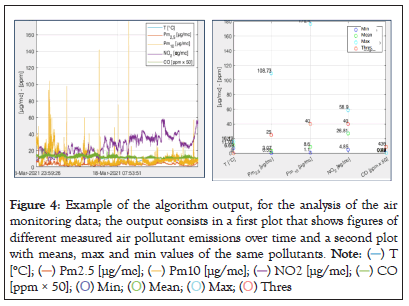
Figure 4: Example of the algorithm output, for the analysis of the air
monitoring data; the output consists in a first plot that shows figures of
different measured air pollutant emissions over time and a second plot
with means, max and min values of the same pollutants. 


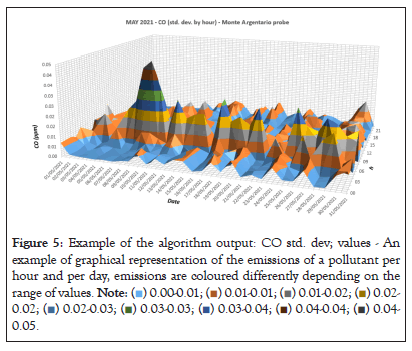
Figure 5: Example of the algorithm output: CO std. dev; values - An
example of graphical representation of the emissions of a pollutant per
hour and per day, emissions are coloured differently depending on the
range of values. 


To set an example, with reference to Figure 5. Example of the algorithm output: CO std. dev. values. CO standard deviation values per hour are displayed day by day. In addition, pre-defined standard deviation ranges are represented with different colors for better readability. In addition, the algorithm can perform the same calculations for two-time windows in the same time horizon. The first window starts at the beginning of the time horizon and the second one finishes at the end of the time horizon such that a comparison against air quality between two different periods in the Project lifespan can be made. The windows length can be set arbitrarily by the operator, who oversees finding a reasonable trade-off between period representativeness (shorter windows) and statistical significance (longer windows).
To refine the emissions analysis, measures are integrated with additional information coming from the LIFE IT mobility platform. Since it is difficult to assess changes in air quality only through a few number of monitoring stations, a further study is carried out aiming at estimating the avoided emissions thanks to the use of the Project ZEVs. For this purpose, transportation data are collected from June 2022 to September 2022, i.e., high season, as a first step for assessing the number of system users in full operational mode such that it is possible to estimate the equivalent distance travelled by internal combustion engine vehicles. More in deep, data about the use of the mobility system are measured, as reported in measured transport data (Table 1).
| Transport data | Value |
|---|---|
| E-bike rents | 13 |
| E-scooters rents | 282 |
| E-cars rents | 567 |
| Total e-bus passengers | 500 |
| Total rents | 862 |
| Average trip e-bike | 6.2 |
| Average trip e-scooter | 4.9 |
| Average trip e-car | 27.1 |
Table 1: Measured transport data.
Furthermore, surveys investigate the reasons behind the system users’ choices. Some extracts of collected information are shown in Figures 6-8.
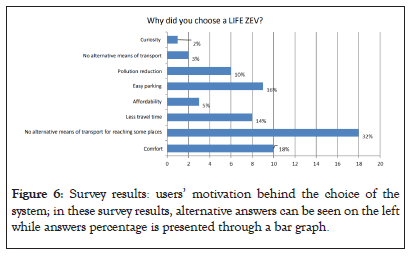
Figure 6: Survey results: users’ motivation behind the choice of the system; in these survey results, alternative answers can be seen on the left while answers percentage is presented through a bar graph.
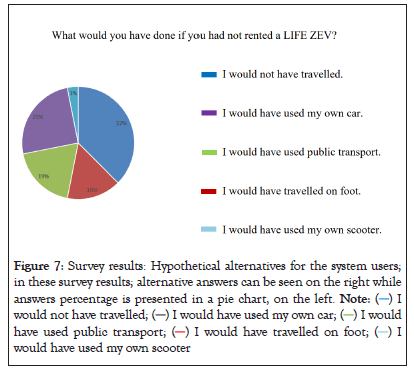
Figure 7: Survey results: Hypothetical alternatives for the system users;
in these survey results; alternative answers can be seen on the right while
answers percentage is presented in a pie chart, on the left. 


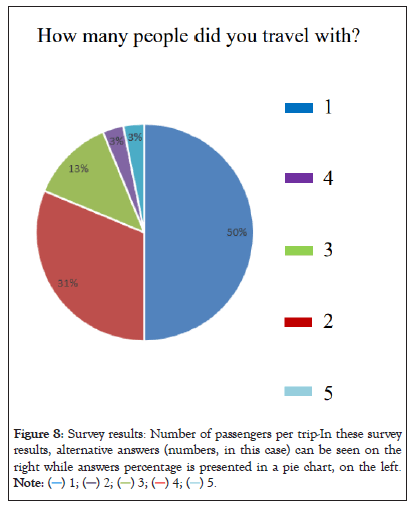
Figure 8: Survey results: Number of passengers per trip-In these survey
results, alternative answers (numbers, in this case) can be seen on the
right while answers percentage is presented in a pie chart, on the left. 
In the second step of the analysis, projections of the mobility system are made by considering different future scenarios: Scenario 1 or Season 2022, which refers to data reported in Table 1. Measured transport data; Scenario 2 which involves 'seasonal' service for e-boats and e-bus and 3 options (a,b,c) of 'off season' mileage for cars and scooters:
Option a (off season mileage of e-scooters and e-cars as 20% of summer season), Option b (off season mileage of e-scooters and e-cars as 40% of summer season), Option c (off season mileage of e-scooters and e-cars as 50% of summer season), Scenario 3 constituted by scenario 2+a 50% fleet expansion for cars and scooters, Scenario 4 constituted by scenario 2+a 100% fleet expansion for cars and scooters.
A deeper analysis is carried out for e-boats, since they represent the most experimental part of the project and they have not yet officially carried passengers, due to a long navigation test phase. In Table 2 Assumption for avoided emissions evaluation. The overall assumptions for the calculation of e-boat avoided emissions are reported (Table 2).
| Project parameters | Value |
|---|---|
| Summer season days | 122 |
| Cars load factor | 1,50 |
| Boats travels per day-Giannella | 4 |
| Boats travel per day-Feniglia | 4 |
| Average passengers carried per travel-Giannella | 8,34 |
| Average passengers carried per travel-Feniglia | 6,26 |
| Tot pax Giannella | 33,36 |
| Tot pax Feniglia | 25,02 |
| Vehicles avoided Giannella | 22,24 |
| Vehicles avoided Feniglia | 16,68 |
| Veh.Km avoided Giannella/summer season [km] | 23.337,34 |
| Veh.km avoided Feniglia/summer season [km] | 7.530,36 |
| Tot veh.km avoided [km] | 30.867,71 |
| Orbetello-Giannella [km] | 8,60 |
| Orbetello-Feniglia (Tombolo) [km] | 3,70 |
Table 2: Assumption for avoided emissions evaluation.
‘Average passengers carried per travel-Giannella’ and ‘Average passengers carried per travel-Feniglia’ are the most difficult figure to evaluate. Statistical data (ISTAT, ‘Istituto Nazionale di Statistica’) are considered, starting from the touristic flows in the Project Area (Grosseto, IT) as shown in Table 3, where the ‘alpha ratio’ is the ratio between monthly arrivals and peak of arrivals in summer (August), reported only for months in Summer (high season). That is a key figure because it is assumed to be the e-boats fill rate (Table 3).
| Period | Arrivals in accommodation structures (ISTAT) | ‘Alpha ratio’ Monthly arrivals/August arrivals (peak) |
|---|---|---|
| Jan-19 | 15364 | - |
| Feb-19 | 17961 | - |
| Mar-19 | 31910 | - |
| Apr-19 | 95902 | - |
| May-19 | 86053 | - |
| Jun-19 | 207146 | 76.50% |
| Jul-19 | 224922 | 83.10% |
| Aug-19 | 270739 | 100.00% |
| Sep-19 | 144043 | 53.20% |
| Oct-19 | 51093 | - |
| Nov-19 | 21859 | - |
| Dec-2019 | 23577 | - |
Table 3: ISTAT statistical data and calculation of alpha ratio.
Therefore, average value n of passengers carried per travel per month is evaluated 1 as the product of the fill rate ‘f’ (‘alpha ratio’) by the e-boats maximum capacity ‘c’ presented in Table 4. E-boats max capacities as reported in the request for approval certificate from below equation (Tables 4 and 5).
| E-boat length [m] | Max capacity |
|---|---|
| 6 | 4 |
| 8 | 6 |
| 8 | 6 |
| 10 | 8 |
Table 4: E-boats max capacities.
| Substance | Emission factor [g/km] |
|---|---|
| CO | 3,35 |
| NOx | 0,68 |
| NMVOC | 0,46 |
| CH4 | 0,04 |
| PM | 0,03 |
| CO2 | 203,60 |
Table 5: Emission factors.
n = f.c ……. (1)
The average among the values of n for all summer months is estimated and considered as the average passengers carried per travel.
‘Tot veh.km avoided’ T is the result of the computation based on the below equations:
Pi = ni.b ……. (2)
vi = Pi.l ……. (3)
Di = vi.di.k ……. (4)
Dtot = DGiannella + DFeniglia ……. (5)
where Pi is the total e-boat passengers per day for the i-path (Giannella or Feniglia), n is the average passengers carried per travel for the i-path (Giannella or Feniglia), b is the number of boat travels per day (assumed according to the technical features of e-boats, their batteries and charging stations), vi is the number of vehicles (internal combustion) avoided per day for the i-path (Giannella or Feniglia), l is cars load factor (average value in Italy), Di is the total travel distance per day for the i-path (Giannella or Feniglia) in km, di is the distance of one single i-path (Giannella or Feniglia) in km, measured through Google Maps, k is the number of Summer days and Dtot is the total travel distance per day in km. Air emissions are calculated with 6, with reference to the ARPAT emission factors in E is the emission in kg or t, D is the total travel distance in km and μ is the emission factor of the j-pollutant in g/km from below equation.
E = D.μ ……. (6)
E is the emission in kg or t, D is the total travel distance in km and μ is the emission factor of the j-pollutant in g/km.
Avoided emissions for the overall scenarios are shown in Figures 9 and 10. In addition, the amount of CO2 indirectly emitted by ZEVs (due to the fraction of energy produced using fossil fuels) is displayed together with the avoided CO2 emissions in Figures 9-12.
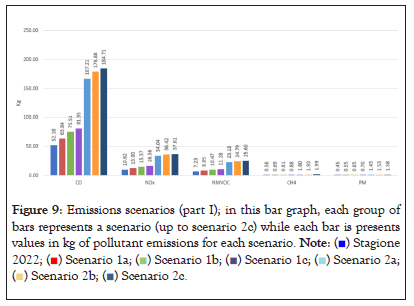
Figure 9: Emissions scenarios (part I); in this bar graph, each group of
bars represents a scenario (up to scenario 2c) while each bar is presents
values in kg of pollutant emissions for each scenario. 


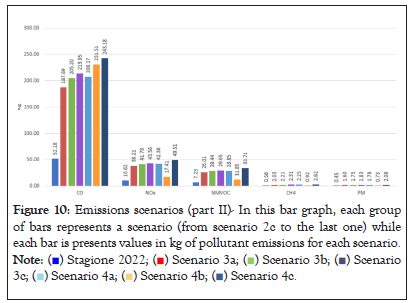
Figure 10: Emissions scenarios (part II)- In this bar graph, each group
of bars represents a scenario (from scenario 2c to the last one) while
each bar is presents values in kg of pollutant emissions for each scenario. 

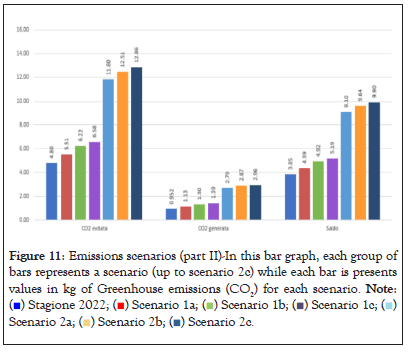
Figure 11: Emissions scenarios (part II)-In this bar graph, each group of
bars represents a scenario (up to scenario 2c) while each bar is presents
values in kg of Greenhouse emissions (CO2) for each scenario. 

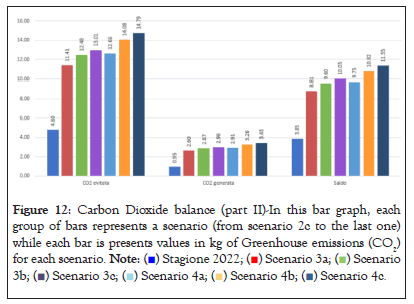
Figure 12: Carbon Dioxide balance (part II)-In this bar graph, each
group of bars represents a scenario (from scenario 2c to the last one)
while each bar is presents values in kg of Greenhouse emissions (CO2)
for each scenario. 

Life cycle analysis: The LCA methodology is applied to the LIFE project according to ISO 14040 and 14044. Since air quality must be preserved and has to be enhanced, it is necessary to include all possible emissions in the overall balance, also the ones coming from ZEVs. In fact, to set an example, transportation of e-cars to the Area of The Project produces emissions due to the use of trucks. The overall mobility system is schematized as a ‘system of product’, i.e. a system that leads to create products or that offers services by producing waste and emissions. Then, all the material, energy, product, waste and emission flows are assessed completing the ‘inventory analysts’ and, in the next step, it leads to the definitions of indicators for the ‘impact assessment’. At the end of the analysis, the achieved information is processed and interpreted with the aim of drawing conclusions. The LCA framework is represented in Figure 13. Briefly, it starts with a project definition, where each energy, waste, raw material or product flows are taken into consideration. Then, in the Inventory phase, each flow is quantified before choosing the proper indicators, in the next analytical phase. In the end, data are interpretated for drawing conclusions (Figure 13).
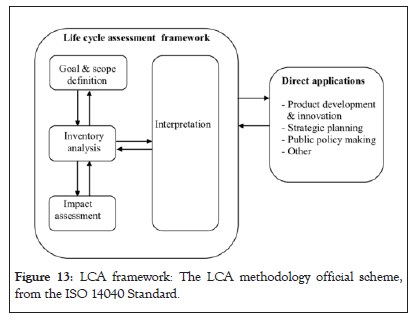
Figure 13: LCA framework: The LCA methodology official scheme, from the ISO 14040 Standard.
The LCA of the LIFE Project includes transportation and operational emissions. The latter come from frictions due to breaks and tires. In conclusion, Particulates (PM2.5 and PM10) emitted by friction are comparable to the avoided emissions from internal combustion engine vehicles (par. 1.3) probably because ZEVs are heavier than the former such that frictions are more consistent. The same result is achieved for other pollutant substances, as shown in Table 6. Comparison between lifecycle emissions and avoided emissions. In conclusion, thanks to the LIFE Project, a reasonable amount of pollutant emissions is avoided and, even if some emissions come from the Project itself, the latter are negligible or less than the former, leading to a positive balance in terms of air quality for the Project Area (Table 6).
| Substance | Emissions [kg] | Avoided emissions (par. 1.3- worst scenario) [kg] | Avoided emissions (par. 1.3-best scenario) [kg] |
|---|---|---|---|
| PM | 1,00 | 0,45 | 2,08 |
| NOx | 0,14 | 10,62 | 49,51 |
| CO | 0,18 | 52,18 | 243,18 |
| NMVOC | 0,20 | 7,23 | 33,71 |
Table 6: Comparison between lifecycle emissions and avoided emissions.
Innovations and research opportunities
The LIFE Project yields an experimental component, which mainly covers many study fields. Besides that, the Projects offers a predisposition to further innovative solutions, as explained more in deep later. The Valentino e-boat is pictured in Figures 14 and 15. A PV roof makes the Valentino power its engine by solar energy (Figures 14 and 15).
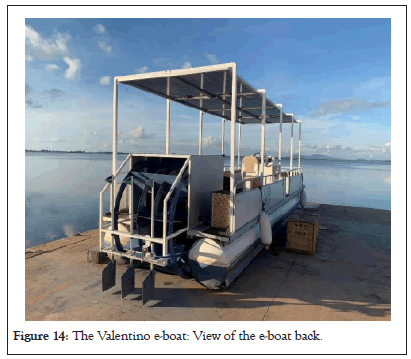
Figure 14: The Valentino e-boat: View of the e-boat back.
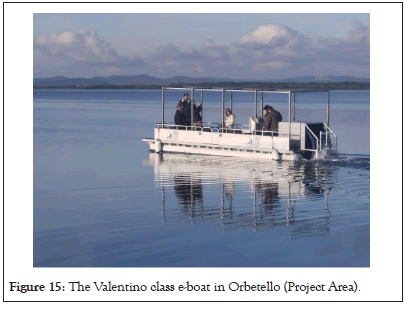
Figure 15: The Valentino class e-boat in Orbetello (Project Area).
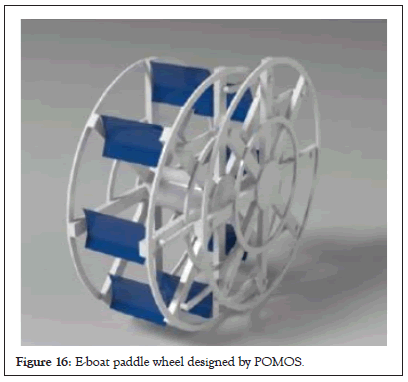
Figure 16: E-boat paddle wheel designed by POMOS.
Special design for paddle wheels: The e-boats paddle wheels (Figure 16). E-boat paddle wheel designed by POMOS, are shaped in a way that the engine expresses a consistent torque by maintaining a very low angular speed. That feature is very relevant for the preservation of the lagoon flora and fauna, since e-boats sail on shallow waters. This way, the lagoon ecosystem is untouched by maintaining a reasonable commercial speed of the boat (of about 4 km) anyway. Furthermore, the special paddle wheels design makes it possible to oxygenate the seabed flora and fauna even contributing to an enhancement of the lagoon ecosystem (Figure 16).
With the abovementioned equipment, a LIFE e-boat could be used for whatever application in sites that are unreachable for other means of transport, for example because of their naturalistic valence. In 2016, a prototype of the ‘Valentino I’ class e-boat was used to perform the sanitization of the artificial pond in Rome (IT) [16]. The purpose was to apply bioremediation (Figure 17). Bioremediation in EUR pond (Rome, 2016) has been applied to sanitize the pond while monitoring the flora and fauna state (Figure 17).
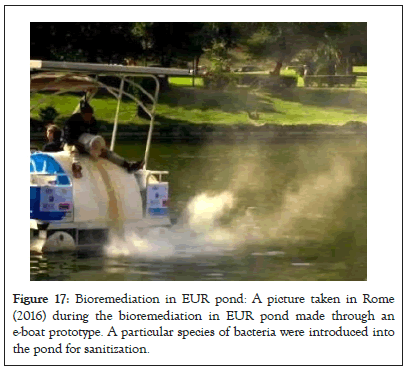
Figure 17: Bioremediation in EUR pond: A picture taken in Rome (2016) during the bioremediation in EUR pond made through an e-boat prototype. A particular species of bacteria were introduced into the pond for sanitization.
Autonomous driving: The longest e-boat, named “Valentino III” (Figure 18), is different from the other ones since it counts four paddle wheels. More precisely, each paddle wheel is moved by an independent electric engine. That means great maneuverability because the boat can turn quickly (even on himself) and with a small steering angle by activating only one contiguous engine couple (Figure 18).
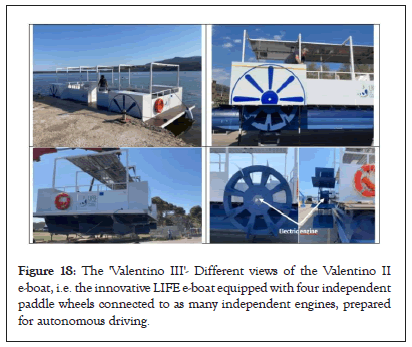
Figure 18: The 'Valentino III'- Different views of the Valentino II e-boat, i.e. the innovative LIFE e-boat equipped with four independent paddle wheels connected to as many independent engines, prepared for autonomous driving.
Moreover, the abovementioned design prepares the boat for autonomous driving experimentation, similarly to quadricopters as in Figure 19 [17], which POMOS carries out also with the use of Artificial Intelligence [18]. Some paths of a virtual e-boat with simulated autonomous driving system are pictured in Figure 20, where the boat avoids different types of obstacles to get to a pre-defined destination. Graphic representation of e-boat autonomous driving simulation results by POMOS. On the left, the virtual e-boat obeys to crisp logical rules for avoiding an obstacle. On the right, the same virtual e-boat refers to Fuzzy Rules and Machine Learning to perform its trip without incidents. (Figures 19 and 20).
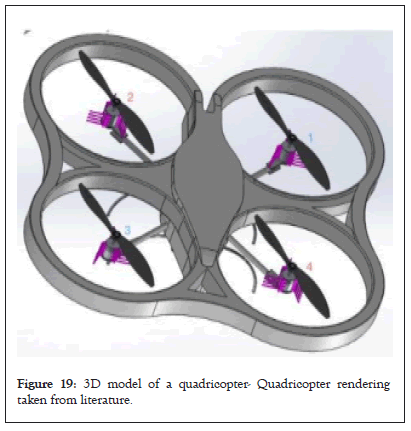
Figure 19: 3D model of a quadricopter- Quadricopter rendering taken from literature.
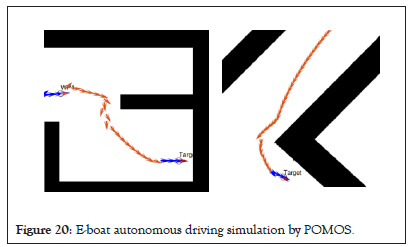
Figure 20: E-boat autonomous driving simulation by POMOS.
Research on energy management: The e-boat design makes it be very similar to a Micro Grid (MG), as shown in Figure 21, which is a local electric grid considered the fundamental element of a wider Smart Grid (SG). In fact, the load (the house in the figure) is the electric engine, the battery is on board and the Renewable energy generator is the PV roof. In the context of energy saving and Renewables, energy management by optimization of energy flows is essential, leading to efficient future Energy Communities (ECs). The structure of the e-boat itself makes it possible to try new software solutions (or Energy Management Systems) for energy optimization that could be scaled for ECs [19,20]. In addition, a real implementation of IT solutions for the Project Area could include the e-boats, their charging stations and other land nodes as PV generators and Energy Storage Systems (ESSs) aiming at the constitution of a future EC in the Project Area. The scheme of a basic Microgrid, equipped with wind turbine and battery. On the right, the connection to the Main Grid guarantees the energy needs fulfillment when, for example, both turbine and battery cannot provide enough energy to the house (seen as the electrical load). Since the house owner can both produce and absorb energy, it can be named prosumer rather than consumer (Figure 21).
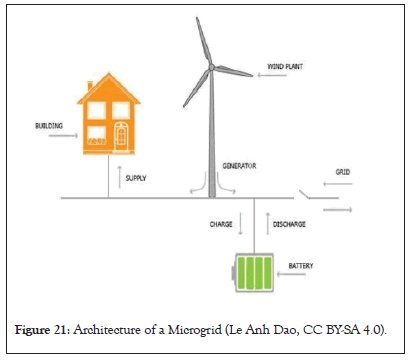
Figure 21: Architecture of a Microgrid (Le Anh Dao, CC BY-SA 4.0).
In (Capillo, 2022), with reference to Figure 22, a Multi-Objective energy flow optimization (Energy Management) is performed for a docked e-boat meaning that, when the e-boat is connected to the dock, it can exchange energy along with charging the battery, but considering some conditions:
1. The charging time has to be as short as possible
2. The battery wear has to be as little as possible
In the abovementioned figure, the PV roof is G’, the e-boat ESS is S’, the dock PV generator is G; the dock ESS is S and N is the Main Grid. Since the quicker is charging the higher is battery wear, the abovementioned targets are in contrast such that a Pareto Front Multi-Objective optimization is performed. The evaluative optimization paradigm is applied for avoiding local minima. To finish, the use e-boat fleets as energy hub for land Energy Communities is among the hypothesis for the post-project planning. Floating PV could be an added value. In the presented EMS scheme, solid lines represent energy flows while dotted lines information flows. Circle nodes are mono-directional, since they can only provide or absorb energy while square nodes are bidirectional. BMS is the Battery Management Systems that measures the State of Charge of the battery and also preserves their health (Figures 22 and 23).
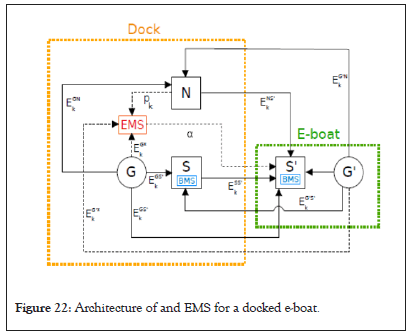
Figure 22: Architecture of and EMS for a docked e-boat.
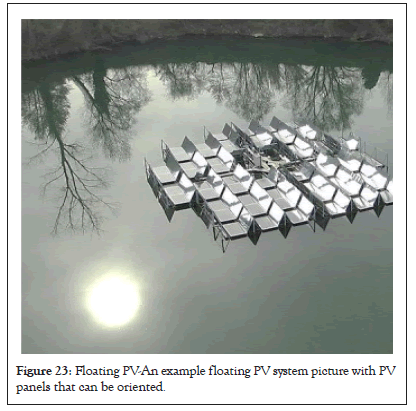
Figure 23: Floating PV-An example floating PV system picture with PV panels that can be oriented.
In this work, the main environmental preservation achievements of the’ Life for Silver Coast’ European Project are reported together with the main research contributions that made it possible to accomplish these goals. The Project, which aims at maintaining and enhancing air quality in the touristic area of the ‘Silver Coast’ (Italy) by developing a sustainable intermodal mobility system, has an experimental connotation. Thus, it involves Research and innovation, ranging from the special design of e-boats paddle wheels that preserves the flora and fauna in lagoon shallow waters to the four-independent-engines e-boat prepared for autonomous driving experimentation and to the development of energy management software. Thanks to the abovementioned features and to air monitoring and LCA analysis, the Project leads to a positive balance in terms of air quality for the Project Area, in terms of avoided emissions. E-boat fleets (also with floating PV) as energy hub for land Energy Communities is among the hypothesis for the post-project planning.
POMOS would like to thank the EU for financial support to environmental projects like “LIFE for Silver Coast” (LIFE-16 ENV/IT/000337), since it is prominent to achieve the natural and historical preservation of Italy, especially in touristic areas.
Citation: Capillo A, Mancini A, Joime GP, Mascioli FMF (2023) Air Quality Preservation through Innovative Solutions in the ‘LIFE for Silver Coast’ European Project. J Tourism Hospit.12:515.
Received: 27-Feb-2023, Manuscript No. JTH-23-21948; Editor assigned: 02-Mar-2023, Pre QC No. JTH-23-21948 (PQ); Reviewed: 16-Mar-2023, QC No. JTH-23-21948; Revised: 23-Mar-2023, Manuscript No. JTH-23-21948 (R); Published: 30-Mar-2023 , DOI: 10.35248/2167-0269.23.12.515
Copyright: © 2023 Capillo A. This is an open-access article distributed under the terms of the Creative Commons Attribution License, which permits unrestricted use, distribution, and reproduction in any medium, provided the original author and source are credited.