Enzyme Engineering
Open Access
ISSN: 2329-6674
ISSN: 2329-6674
Research Article - (2022)Volume 11, Issue 6
The need to upsurge potential sources of antioxidant foods on our table and as well point to better amino acid profile plant-based sources continue to expand and becoming an incremental challenge to food scientist. This study investigated amino acid profile and the antidiabetic properties of toasted seed from Balanites aeqyptiaca. The total phenolic content, flavonoid, amino acid profile and in vitro antioxidant properties of Balanites aeqyptiaca del Aduwa protein hydrolysates from two different proteases and same combine protease (pepsin and pancreatin) were investigated. The results revealed high total phenol (5.0 mg/100 g), EAA (28.08%), DPPH (80%), Superoxide (60%), FRAP (0.3%) and HRSA (58.0%) were high in APH (pa+pe) sample. However, Flavonoids (20 mg/100 g), NCAA (59.69%) and ABTS (22.0%) of APHpe were above the referenced standard. On the other hand, the APHpa sample has good flavonoids (13 mg/100 g), EAA (33.77%), ABTS (12%), metal chelating (72%), leucine (10.58%), Phenylalanine (2.96%) content and lipid peroxidation (0.04%) ability. The excellent ability of hydrolysate from combined protease APH (pa+pe) and pancreatin hydrolysate APHpa in preventing and scavenging free radical as well as the high spread of phenolics and flavonoids concludes that enzymatic hydrolysis of Aduwa seed could release potent bio actives and peptides that could quench free radical build up in human cells and system.
Aduwa hydrolysate; Total phenolics; Flavonoid; Amino acid profile; Antioxidant
Balanites aeqptiaca del, a desert plant. This desert resistance seed plant is widely neglected but the fruits are edible, the leaves and seed usually boiled as admix with cereal foods. The nutritional profile of the leaves, flower and seed has been studied [1]. Recent studies on the amino acid profile and antioxidant properties of the seed have been studied [2]. Plants, especially nuts are also potential sources of chelating and quenching free radicals even from its build up. The advocacy on the use of plants nuts to reduce disease that could risk life and populations are on the search. Phenolics have antioxidant potentials to mitigate lipid oxidation and to scavenge free radicals [3]. Although work on the use of hydrolysate from different proteases on the phenolic, flavonoid, antioxidant and amino acid profiles has not been carried out on the Aduwa seed. The use of Aduwa in an evolving society nowadays lacks the attraction as major food or staple because of the bitter astringency of the seed fruit especially in raw and semi edible forms as food. The aim of this work is to dive in to make Aduwa seed through hydrolysis a suitable alternative to family use and to express the amino acid and antioxidant properties of hydrolysates from desert date (Balanaites aeqptiaca del) toasted seed nuts for food systems and application.
Source of raw materials
The mature seeds of B. Aegyptiaca (Aduwa) used for this study were bought from Gashua market in Yobe State of Nigeria and were immediately transported to the biological science department for lot identification and then to biochemistry laboratory of the Federal university Gashua.
Aduwa seed processing and concentrate making: The seed kernels were subjected to toasting pretreatments before milling and oil extraction from meal cake by mechanical mean, leaving out the cake.
Preparation of Aduwa protein concentrate: Aduwa Protein Concentrate (APC) was prepared by a method modified by Gbadamosi, et al. [4]. A known weight (200 g) of the defatted flour were dispersed in distilled water (2,000 ml) to give final flour to water ratio of 1:10. The dispersion was then gently stirred on a magnetic stirrer for 10 min to form a suspension, after which the pH of the resultant slurry was adjusted with 0.1 M HCl to pH 4. The precipitation process was allowed to proceed with gentle stirring for 2 h keeping the pH constant. Soluble carbohydrates (oligosaccharides) and minerals were removed by centrifugation at 3,500 × g for 30 min using a centrifuge. The precipitate (concentrate) was washed with distilled water to remove the residual minerals and soluble carbohydrates and the pH is later adjusted with 0.1 M NaOH to 7.0 for neutralization and then centrifuged at 3,500 × g for 10 min. The resultant precipitate (concentrate) was collected and dried in an oven at 45°C for 8 h and kept in air-tight container for further analysis.
Total phenolic content of hydrolysates
TPC (Total Phenolic Content) was carried out using Folin-Ciocalteu’s phenol reagent reaction as described by Adhikari, et al. [5]. The protein samples were prepared to final concentration in water to 1.0 mg/ml and centrifuged to collect the supernatants. Calibration curve of solutions was prepared by pipetting 0.0, 0.2, 0.4, 0.6, 0.8, and 1.0 ml of gallic acid standard solution (1.0 mg/ml garlic acid) in triplicate into clean dried test tubes. About 1 ml of the sample and the standard was pipetted inside clean test-tubes in triplicate. In each of the test tube is added 1.5 ml of Folin-Ciocalteu’s reagent, incubated at room temperature for 5 min followed by the addition of 1.5 ml of 10% (w/v) NaHCO3 solution to give a total volume of 4.0 ml. The reaction mixtures were further incubated for additional one and half hours (90 min). The absorbance was read at 725 nm against blank. The standard curve is obtained by plotting absorbance against the concentration. The phenolics content in the samples was extrapolated from standard as milligram gallic acid equivalent per g of extract (mg GAE/g extract).
Determination of total flavonoid content of hydrolysates: The total flavonoid content of the Aduwa sample was determined using a slightly modified method reported by Meda, et al. [6]. 0.5 mL of sample was mixed with 0.5 mL methanol, 50 μL of 10% AlCl3, 50 μL of 1 mol/L potassium acetate and 1.4 mL distilled. This was allowed to incubate at room temperature for 30 min. The absorbance of the reaction mixture was subsequently measured at 415 nm in the Jenway UV-Visible spectrophotometer. The total flavonoid was calculated using quercetin as a control standard.
Amino acid profile determination of whole Aduwa meal, defatted Aduwa meal and concentrates
The amino acid profiles of samples were determined as described by AOAC in duplicate (two separately digested and fractionated samples) using an HPLC (High Performance Liquid Chromatography) system after samples was hydrolysed with 6 M HCl. The cysteine and methionine contents were determined after performic acid oxidation and tryptophan content was determined after alkaline hydrolysis [7].
Determination of in vitro antioxidant
2,2-Diphenyl-1-Picryl Hydrazyl (DPPH) scavenging activity: The DPPH scavenging activity of the protein meal defatted and concentrated was determined by the method of Brunner. The DPPH (0.02 mg/ml) was mixed (1:1 v/v) with various concentration of sample extracts (0-5 mg/ml) were dissolved in methanol. Thereafter, the mixture was made to stand for 60 minutes at 25°C, and the absorbance was read at 517 nm using a spectrophotometer. GSH Sserved as positive control served as the positive controls. The percentage inhibition was calculated using this formula:
% Inhibition=(A0-A1)/A0) × 100
Were,
A0=Absorbance of control
A1=Absorbance of sample
Superoxide scavenging activity: The superoxide scavenging activity methods described by Gao, et al. [8] and Marklund were used. An aliquot (80 µL) of the protein samples or glutathione, (control) both at a concentration of 1 mg/ml were mixed with 80 µL of 50 mM Tris-HCL buffer (pH 8.3) containing 1 mM EDTA directly into a clear bottom 96-well plate in the dark. Pyrogallol (1.5 mM) was dissolved in 10 mM HCl and 40 uL added to each well. For blank, Tris-HCl buffer was used. Absorbance was measured at 420 nm for 4 min at room temperature.

Metal ion chelating activity: The Fe2+ chelating ability of the three samples were determined using a modified method by Puntel, et al. [9]. Freshly prepared 500 molL-1 1 FeSO4 (0.15 mg) was added to a reaction mixture containing 0.168 mg of 0.1 molL-1 Tris-HCl (pH 7.4), 0.218 mg saline and the sample concentration (0-0.025 mg). The reaction mixture was incubated for 5 min, before the addition of 0.013 mg of 0.25% 1,10-phenanthroline (w/v). The absorbance was subsequently measured at 510 nm in a spectrophotometer. The Fe2+ chelating ability was subsequently calculated with respect to the GSH control.

Where, Abs control=Absorbance of the control (reacting mixture with-out the test sample)
Abs test sample=Absorbance of reacting mixture with the test sample.
Hydroxyl (OH) radical scavenging assay
The ability of the aqueous extract of the test Aduwa samples to prevent Fe2+ and hydrogen peroxide (H2O2) induced decomposition of deoxyribose was carried out using the method of Halliwell and Guttridge (1981). Briefly, freshly prepared aqueous sample concentration (0-0.10 mg) was added to a reaction mixture containing 0.120 mg 20 mM deoxyribose, 04 mg 0.1 M phosphate buffer, 0.040 mg 20 mM hydrogen peroxide and 0.040 mg 500 Mm FeSO4, and the volume made to 0.8 mgL with distilled water. The reaction mixture was incubated at 37°C for 30 min, and the reaction was stop by the addition of 0.5 mL of 2.8% TCA (Trichloroacetic Acid), this was followed by the addition of 0.4 mL of 0.6% TBA solution. The tubes were subsequently incubated in boiling water for 20 min. The absorbance was measured at 532 nm in spectrophotometer.

Where, Abs control=Absorbance of the control (reacting mixture with-out the test sample)
Abs test sample=Absorbance of reacting mixture with the test sample
Ferric reducing power
The reducing property of the Aduwa samples was determined by assessing the ability of the extract to reduce a FeCl3 solutions described by Pulido, et al. [10]. A 2.5 mL aliquot was mixed with 2.5 mL, 200 mM sodium phosphate buffer (pH 6.6) and 2.5 mL, 1% potassium ferricyanide. The mixture was incubated at 50°C for 20 min, and then 2.5 mL, 10% TCA was added. This was then centrifuged at 650 g for 10 min. A 5 mL of the supernatant was mixed with an equal volume of water and 1 mL, 0.1% ferric chloride. The same treatment was performed to a standard ascorbic acid solution and the absorbance taken at 700 nm. The ferric reducing power was then calculated and expressed as ascorbic acid equivalent.
Total antioxidant power ABTS
Total antioxidant power of the extracts was assessed using the ABTS radical model as described by Re, et al. [11]. The ABTS radical was generated by reacting 7 mmol/L of ABTS aqueous solution with 2.45 mmol/L of K2S2O8 solution in the dark for 16 h and adjusting the Abs 2734 nm to 0.700 with ethanol. Two hundred microliters of the appropriate dilution of the sample extracts were added to 2.0 mL ABTS radical solution and the absorbance was measured at 734 nm after 15 min. The Trolox equivalent antioxidant capacity was subsequently calculated.
Lipid peroxidation: The lipid peroxidation assay was carried out by the modified method of Ohkawa, et al. [12]. Briefly, 100 μL of sample fraction was mixed with a reaction mixture containing 30 μL of 0.1 M Tris-HCl buffer (pH 7.4), extract (0-100 μL) and 30 μL of the pro-oxidant (7 μM sodium nitroprusside). The volume was made up to 300 μL by water before incubation at 37°C for 2 h. The color reaction was developed by adding 300 μL of 8.1% sodium dodecyl sulphate to the reaction mixture containing S1, followed by the addition of 600 μL of acetic acid/HCl (pH 3.4) and 600 μL of 0.8% thiobarbituric acid. This mixture was incubated at 100°C for 1 h. The absorbance of thiobarbituric acid reactive species produced was measured at 532 nm in UV-visible spectrophotometer (Model 6305; Jenway, Barloworld Scientific, Dunmow, United Kingdom). Malondialdehyde (MDA) produced was expressed as % Control.
Data analysis: The result of three replicate experiments were analysed mean ± Standard Deviation (SD) A One-way Analysis of Variance (ANOVA) and the Least Significance Difference (LSD) were carried out. Significance was accepted at P ≤ 0.05.
Preparation of Aduwa protein hydrolysate using pepsin enzyme
Aduwa meal Protein Hydrolysate (APH) was prepared using pepsin enzymes in an optimum reaction condition. Acting on the isolate (Pepsin with pH 2 at 37°C), using the method of Omoni and Aluko. A 1:20 w/v Aduwa protein concentrate’s slurry was adjusted to pH 2.0 and incubated at 37°C followed by addition of pepsin (4% w/w, based on protein content of Aduwa protein isolate), The digestion was carried out for 4 h and the pH is maintained by adding 1 M NaOH or HCl when necessary. The digestion was terminated by adjusting the pH to 4.0 and then place the mixtures in boiling water for 30 min to inactivate the enzymes which ensure complete denaturation of enzyme protein and coagulation of undigested proteins. The mixture was allowed to cool to room temperature and later centrifuged and supernatant collected and freeze dried.
Preparation of Aduwa protein hydrolysate using pancreatin enzyme
Aduwa meal Protein Hydrolysate (APH) was prepared using pancreatin enzyme optimum reaction conditions acting on Aduwa concentrate. Pancreatin with pH 7.5 at 40°C using the method of Omoni and Aluko. A 1:20 w/v Aduwa seed protein isolate’s slurry was adjusted to pH 7.5 and incubated at 40°C followed by addition of pancreatin (4% w/w, based on protein content of Aduwa seed protein isolate) or pH 7.5 in and incubation at 45°C followed by the addition of trypsin enzyme (4% w/w, based on protein content of okra seed protein Concentrate) for pancreatin or trypsin, respectively. The digestion was carried out for 4 h and the pH is maintained by adding 1 M NaOH or HCl when necessary. The digestion was terminated by adjusting the pH to 4.0 and then place the mixtures in boiling water for 30 min to inactivate the enzymes which ensure complete denaturation of enzyme protein and coagulation of undigested proteins. The mixture was allowed to cool to room temperature and later centrifuged to get the supernatant and freeze dried.
Total Phenolic Content (TPC) of Aduwa protein hydrolysates
The total phenol content of the Aduwa protein enzymatic hydrolysate is presented in Figure 1. The result showed that the total phenol content in enzymatic hydrolysate contents ranged from 2.3 mg/100 g-4.5 mg/100 g. The enzymatic protein hydrolysate is higher in phenolic activities than the reference. Significance increase (p>0.05) was observed in APHpa+pe (4.5 mg/100 g), APHpe (4.4 mg/100 g) and APHpa (3.8 mg/100 g) compared to the reference. Thus, this study showed that the hydrolysates had the highest total phenol content; this study further revealed that there are strong correlations between the phenolics contents, and the biological remedies studied- antioxidants activities [6]. Therefore, phenolics in hydrolysates may be part of the active compound responsible for the antioxidant, anti-diabetic and possible antihypertensive activities envisage in Aduwa meals by folklore medicine.
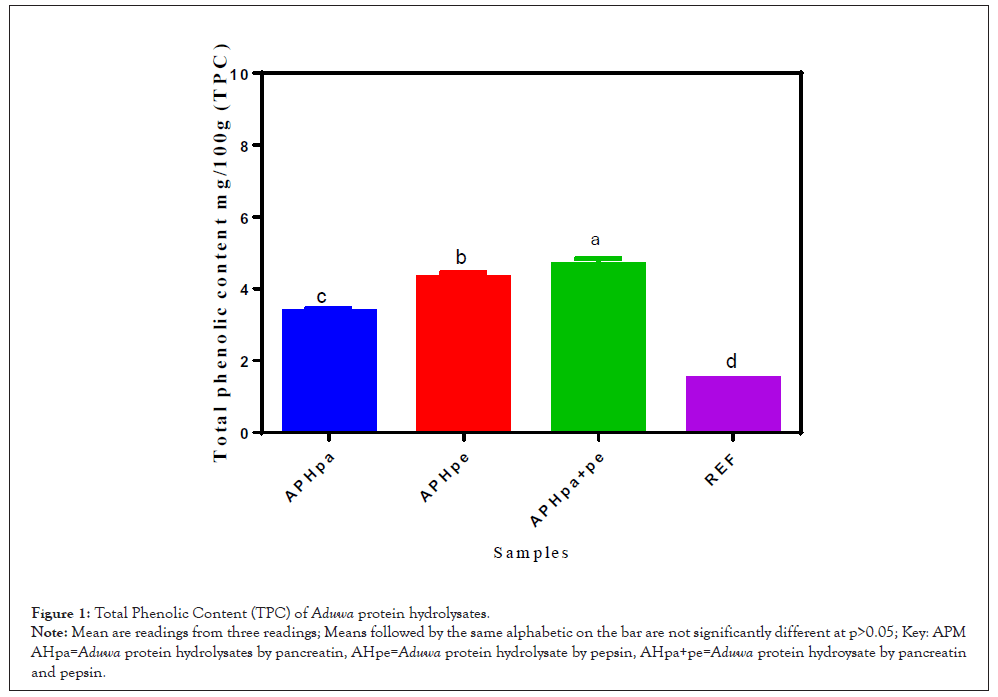
Figure 1: Total Phenolic Content (TPC) of Aduwa protein hydrolysates.
Note: Mean are readings from three readings; Means followed by the same alphabetic on the bar are not significantly different at p>0.05; Key: APM AHpa=Aduwa protein hydrolysates by pancreatin, AHpe=Aduwa protein hydrolysate by pepsin, AHpa+pe=Aduwa protein hydroysate by pancreatin and pepsin.
Total Flavonoid (TF) of Aduwa protein hydrolysates
Total Flavonoid (TF) of Aduwa protein meal, defatted protein meal, protein concentrate, isolate and hydrolysates. Flavonoid in food system has been attributed to antioxidant and microbial inhibitory potential [13]. Flavonoid content in the sample increased significantly as sample has been resolved to protein hydrolysates. High flavonoid content were observed in APHpe (20.0 mg/g), APH (pa+pe) (15.2 mg/g) and this was followed by APHpa (13.0 mg/g) however there existed significant differences at p>0.05 with APHpe (20.0 mg/g) .The amounts of flavonoids reported by Ogori, et al. [13] in soaked and boiled Balanites Aeqyptiaca cake samples were (13.40 mg/100 g) and (12.40 mg/100 g) respectively, but differ from the values under study . Since the antioxidant capacity is an index of the free radical scavenging ability like flavonoids, it can be concluded that APHpe and APHpa+pe samples could have antioxidant competency in Figure 2.
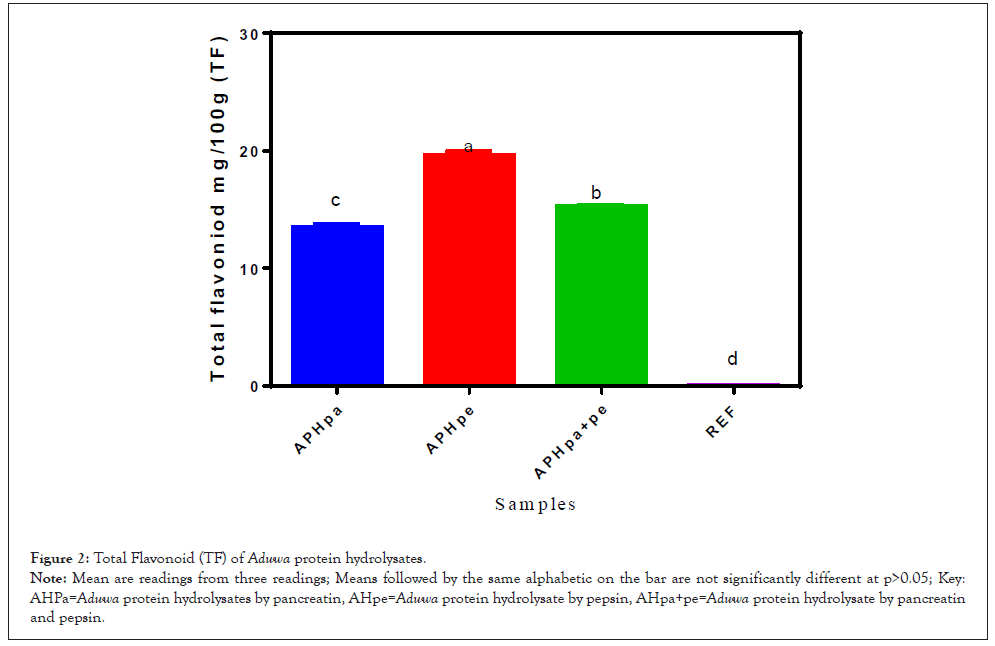
Figure 2: Total Flavonoid (TF) of Aduwa protein hydrolysates.
Note: Mean are readings from three readings; Means followed by the same alphabetic on the bar are not significantly different at p>0.05; Key: AHPa=Aduwa protein hydrolysates by pancreatin, AHpe=Aduwa protein hydrolysate by pepsin, AHpa+pe=Aduwa protein hydrolysate by pancreatin and pepsin.
Amino acid profile of Aduwa enzymatic hydrolysates
Table 1 shows the amino acid composition of Aduwa protein hydrolysates. The Essential Amino Acid (EAA) ranged between (28.08-33.37%), with highest value in APHpa, and slightly, followed by the APHpe and the least was obtained in combined enzyme hydrolysates. This suggests that Aduwa protein hydrolysates are good quality source of protein. In a similar manner, the aromatic amino acids (3.21-4.82%), hydrophobic amino acids (25.43-32.7%) positively charged amino acid (10.05-11.65%). The high concentrations of the hydrophobic amino acids in the APHpa followed by APHpa+pe may implicate the structural behaviour of the sample proteins [14].
| Amino acid | APHpa | APHpe | APHpa+pe |
|---|---|---|---|
| Leucine | 10.58 | 5.57 | 5.41 |
| Lysine | 5.59 | 3.79 | 3.05 |
| Isoleucine | 2.86 | 2.08 | 2.34 |
| Phenylalanine | 2.96 | 1.55 | 1.51 |
| Trytophan | 0.3 | 0.23 | 0.3 |
| Valine | 2.1 | 1.73 | 2.76 |
| Methionine | 2.32 | 2.5 | 2.82 |
| Proline | 1.35 | 1.44 | 1.55 |
| Arginine | 3.2 | 3.53 | 4.18 |
| Tyrosine | 1.56 | 1.44 | 1.69 |
| Histidine | 2.87 | 3.21 | 2.82 |
| Cystine | 0.64 | 0.58 | 0.78 |
| Alanine | 8.05 | 8.32 | 7.84 |
| Glutamic acid | 10.56 | 12.03 | 14.39 |
| Glycine | 3.78 | 4.35 | 3.82 |
| Threonine | 4.11 | 8.59 | 7.36 |
| Serine | 8.14 | 11.44 | 9.81 |
| Aspartic acid | 29.06 | 27.62 | 27.55 |
| AAA | 4.82 | 3.21 | 3.5 |
| BCAA | 15.54 | 9.38 | 10.51 |
| HAA | 32.71 | 25.43 | 27.01 |
| PCAA | 11.65 | 10.53 | 10.05 |
| NCAA | 51.86 | 59.69 | 59.12 |
| SCAA | 2.96 | 3.08 | 3.61 |
| EAA | 33.37 | 29.01 | 28.08 |
Note: Aromatic Amino Acid (AAA)=phenylalanine, tryptophan and tyrosine; Branched Chain Amino Acids (BCAA)=leucine, isoleucine, valine; Hydrophobic Amino Acids (HAA)=alanine, valine, isoleucine, leucine, tyrosine, phenylalanine, tryptophan, proline, methionine, and cysteine; Positively Charged Amino Acids (PCAA)=arginine, histidine, lysine; Negatively Charged Amino Acids (NCAA)=aspartic, glutamic, threonine, serine; Sulphur Containing Amino Acids (SCAA)=methionine, cysteine; Essential Amino Acids (EAA)=histidine, isoleucine, leucine, lysine, methionine, phenylalanine, threonine, tryptophan, and valine. AHpa=Aduwa protein hydrolysates by pancreatin, AHpe=Aduwa protein hydrolysate by pepsin, AHpa+pe=Aduwa protein hydrolysate by pancreatin and pepsin.
Table 1: Amino acids composition (%) of Aduwa protein hydrolysates.
The values obtained for the sulphur containing amino acid ranged between (2.96-3.61%), with APHpa+pe having the highest value. The trend of the sulphur amino acid also dictates the antioxidant properties of peptides samples. The tryptophan content of the samples ranged between (0.23-0.3%), and the values were higher when compared with (0.1-0.12%) reported for okra hydrolysate samples [15]. Similarly, the histidine content of the samples ranged between (2.82-3.21%), with APHpa and APHpe having the highest values. However, the differences in the amino acid contents of APHpa, and APHpe when compared with those of APHpa+pe could be attributed to either small or smaller sized peptides released [16].
DPPH of Aduwa enzymatic protein hydrolysates
The DPPH of Aduwa Protein Meal, Defatted Protein Enzymatic Protein Hydrolysates are presented in Figure 3. DPPH is widely used to evaluate the antioxidant activity of natural compounds [17]. The DPPH indicates the ability of the antioxidant substances to donate electrons or hydrogen atom, converting free radical to a more stable species. Thus APHpa+pe and APHpa showed the strongest activity significantly different at (p>0.05) in comparison to referral GSH. The radical scavenging activity of APHpa is significantly similar with APHpa+pe but higher (p>0.05) than APHpe. Moreso, APHpa+pe and APHpa have similar DPPH scavenging activity slightly below the GSH, which indicates that these three-protein meal and hydrolysate fractions contributed to most of the DPPH scavenging activity observed for the Aduwa protein seeds samples. The ability of APHpa to scavenging similar with APHpa+pe and could be due to synergistic protein interaction with possible hydrophobic amino acids dominance in the samples [17].
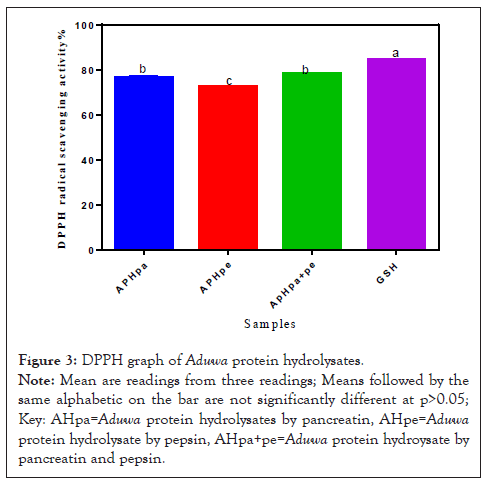
Figure 3: DPPH graph of Aduwa protein hydrolysates.
Note: Mean are readings from three readings; Means followed by the same alphabetic on the bar are not significantly different at p>0.05; Key: AHpa=Aduwa protein hydrolysates by pancreatin, AHpe=Aduwa protein hydrolysate by pepsin, AHpa+pe=Aduwa protein hydroysate by pancreatin and pepsin.
Metal ion Chelating (MCA) of Aduwa protein hydrolysates
Figure 4 shows the Metal ion Chelating (MCA) of Aduwa Protein Hydrolysates. The antioxidant chelates the Fe2+ by reducing the ions and reduces the triggers of OH radical distorting the propagation of hydroxyl ions into delicate cell system. In Figure 4, GSH (80%) was significantly p>0.05 higher than APHpa (70%) APHpe (63%) and APHpa+pe (65%) respectively. APHpa and APHpa+pe revealed higher MCA (63-65%) compared with APHpe (60%). The decrease in MCA activity in APHpe may be due to presence of histidine in the pepsin hydrolysate samples [17].
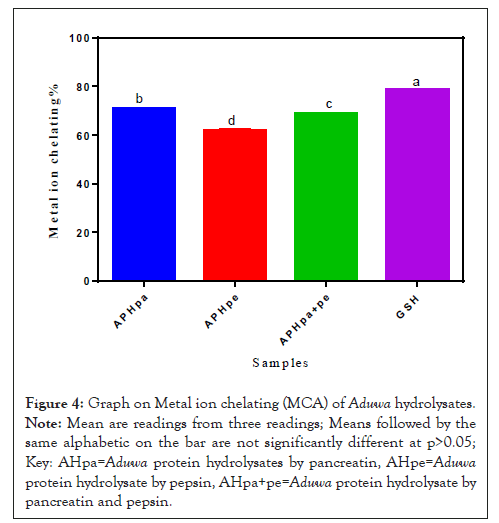
Figure 4: Graph on Metal ion chelating (MCA) of Aduwa hydrolysates.
Note: Mean are readings from three readings; Means followed by the same alphabetic on the bar are not significantly different at p>0.05; Key: AHpa=Aduwa protein hydrolysates by pancreatin, AHpe=Aduwa protein hydrolysate by pepsin, AHpa+pe=Aduwa protein hydrolysate by pancreatin and pepsin.
Hydroxyl Radical Scavenging Activities (HRSA) of Aduwa protein hydrolysates
Figure 5 showed the hydroxyl radical scavenging activity. The HRSA of Aduwa protein hydrolysate by pancreatin APHpa and pepsin APHpa+pe are not significant but (p>0.05) low (55%) compared to GSH. APHpe (50%) sample had the least percentage absorbance. The HRSA of APHpa and APHpa+pe were above (50%) suggesting their better HRSA but not comparable with the reference control. The high HRSA observed in APHpa and APHpa+pe might be due to the high concentration of hydrophobic amino acids. Li, et al. [18] reported that phenylamine can increase HRSA because phenylaniline can react with hydroxyl ions to form stable para, meta and ortho substituted hydroxyl derivatives of phenylaniline.
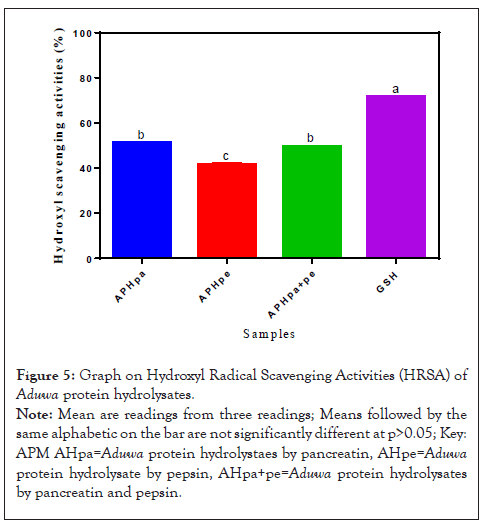
Figure 5: Graph on Hydroxyl Radical Scavenging Activities (HRSA) of Aduwa protein hydrolysates.
Note: Mean are readings from three readings; Means followed by the same alphabetic on the bar are not significantly different at p>0.05; Key: APM AHpa=Aduwa protein hydrolystaes by pancreatin, AHpe=Aduwa protein hydrolysate by pepsin, AHpa+pe=Aduwa protein hydrolysates by pancreatin and pepsin.
Superoxide Radical Scavenging Activities (SRSA) of Aduwa protein meal, hydrolysates
Superoxide Radical Scavenging Activities (SRSA) of Aduwa Protein Hydrolysates is presented in Figure 6. Superoxide radicals are concerned because they are precursors to hydroxyl and hydrogen peroxide radicals. These radicals target DNA protein and lipid cells. Aduwa protein hydrolysate by pancreatin and pepsin APHpa+pe (55%) exhibited significant (p>0.05) higher SRSA when compared with GSH (70%) control standard. The Aduwa protein concentrate APC and Aduwa protein isolate API in this study had low SRSA which ranged from 22-10% when compared to APHpe and APHpa, might be due to the presence peptides. According to Tang, et al. [19], the presence of lye, leu would have enhanced hydrolysate significant increase in SRSA under this study.
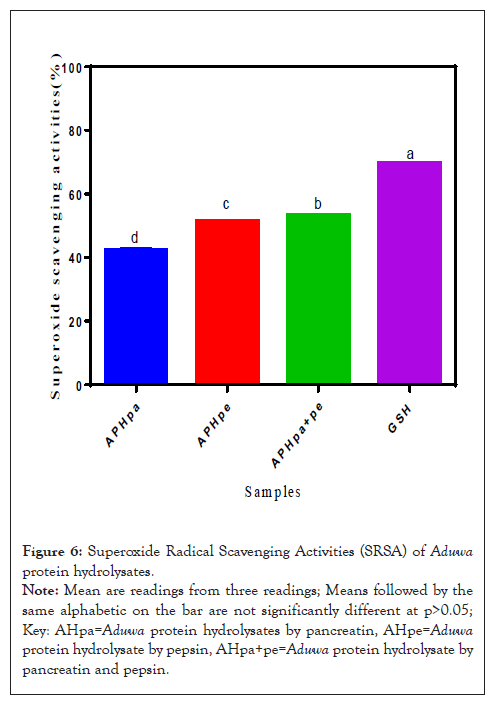
Figure 6: Superoxide Radical Scavenging Activities (SRSA) of Aduwa protein hydrolysates.
Note: Mean are readings from three readings; Means followed by the same alphabetic on the bar are not significantly different at p>0.05; Key: AHpa=Aduwa protein hydrolysates by pancreatin, AHpe=Aduwa protein hydrolysate by pepsin, AHpa+pe=Aduwa protein hydrolysate by pancreatin and pepsin.
Ferric Reducing Antioxidant Power (FRAP) of Aduwa protein hydrolysates
Ferric reducing auto oxidation power breaks chain reactions by donating hydrogen atom. The ability to donate hydrogen atom to reduce or form stable product measures ferric reducing auto oxidation potency of materials as shown in Figure 7. All the sample under this study revealed higher FRAP (0.23-0.25%) compare with the FRAP reference standard (0.44%). FRAP from APH (pa+pe) (0.25%) is significantly (p>0.05) high compared to APHpa and APHpe samples under study. The APH (pa+pe) (0.25%) exhibited better FRAP activity however lower than the reference.
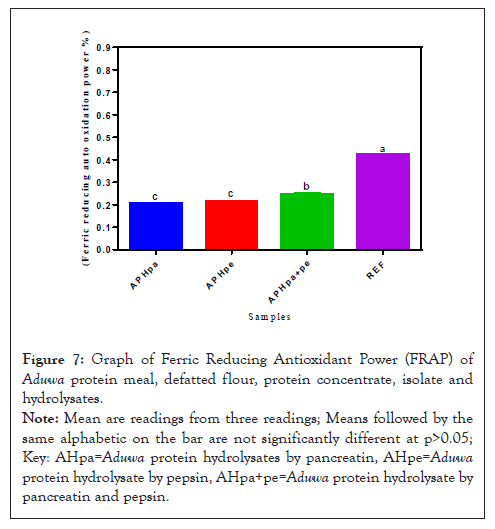
Figure 7: Graph of Ferric Reducing Antioxidant Power (FRAP) of Aduwa protein meal, defatted flour, protein concentrate, isolate and hydrolysates.
Note: Mean are readings from three readings; Means followed by the same alphabetic on the bar are not significantly different at p>0.05; Key: AHpa=Aduwa protein hydrolysates by pancreatin, AHpe=Aduwa protein hydrolysate by pepsin, AHpa+pe=Aduwa protein hydrolysate by pancreatin and pepsin.
Total antioxidant power (ABTS) of Aduwa protein meal hydrolysates
The ABTS scavenging ability of the Aduwa protein hydrolysates sample presented as TEAC in Figure 8 revealed that all the hydrolysate scavenged ABTS. However, the pepsin protein hydrolysate APHpe sample (22.4 mmol TEAC/mg) had significantly (P>0.05) higher ABTS scavenging ability compared to its corresponding APHpa+pe (8.5 mmol TEAC/mg), APHpa (14.5 mmol TEAC/mg) samples. These values disagreed with ABTS value from Aduwa leaves and gall reported by Meda, et al. [6] there exist no significance difference at (p>0.05) in ABTS value in APHpa+pe but these values are greater than the reference. Total radical scavenging activities in enzymatic hydrolysate are significantly higher than reference.
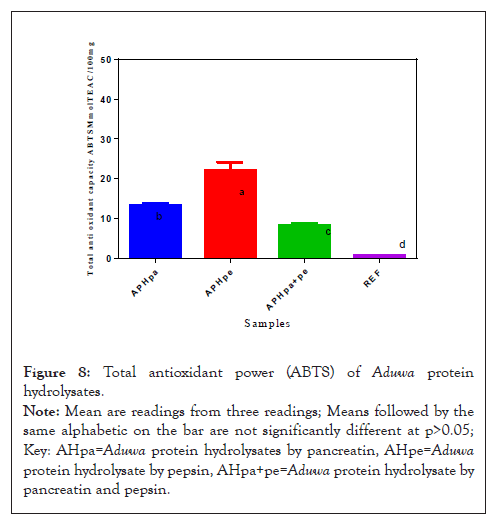
Figure 8: Total antioxidant power (ABTS) of Aduwa protein hydrolysates.
Note: Mean are readings from three readings; Means followed by the same alphabetic on the bar are not significantly different at p>0.05; Key: AHpa=Aduwa protein hydrolysates by pancreatin, AHpe=Aduwa protein hydrolysate by pepsin, AHpa+pe=Aduwa protein hydrolysate by pancreatin and pepsin.
Lipid peroxidation or Malondialdehyde (MDA) of Aduwa protein hydrolysates
The Malondialdehyde (MDA) content of the Aduwa protein hydrolysate samples are presented in Figure 9. The result revealed a significant (P<0.05) increase in the MDA content of hydrolysate from pancreatin was significantly (p>0.05) higher than APHpe but lower than APHpa and APHpa+pe samples, respectively. This could be attributed to the breakdown and use of carbonyl and aldehyde compounds. This may be the reason for high MDA in APHpa and APHpe however less than hydrolysate of combined enzymes samples. Aldehydes unsaturation in Aduwa may have undergone changes by enzymes producing other volatile compounds. Thus, APHpa and APHpe samples may have produced carbonyl peptides which might undergo cleavages for shorter chain aldehydes and peptides, and other bioactive, as well as Malondialdehyde (MDA).
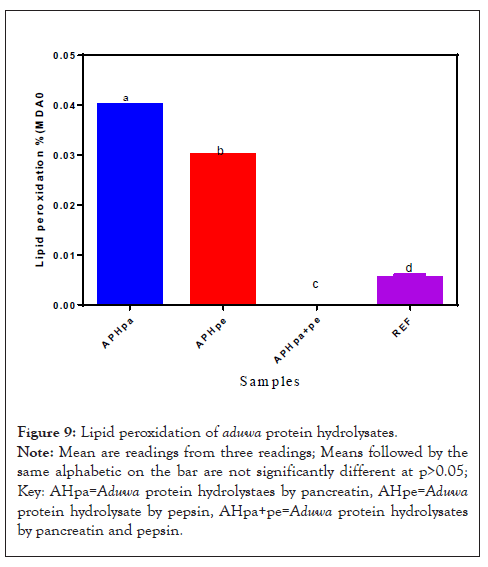
Figure 9: Lipid peroxidation of aduwa protein hydrolysates.
Note: Mean are readings from three readings; Means followed by the same alphabetic on the bar are not significantly different at p>0.05; Key: AHpa=Aduwa protein hydrolystaes by pancreatin, AHpe=Aduwa protein hydrolysate by pepsin, AHpa+pe=Aduwa protein hydrolysates by pancreatin and pepsin.
The process or the conversion of meal concentrate into hydrolysate improved Aduwa total phenolic content, Flavonoid, amino acid, and antioxidant properties. The APHpe displayed strong antioxidant activities due to histidine than APHpa and APH (pa+pe) which might have broken more bonds to release bioactive peptides. The ABTS stronger antioxidant property of APHpe could be attributed to high content of NCAA and ABTS which enhances metal chelation and metal scavenging activity. This similar attribute was also observed in APHpa+pe combine hydrolysate. Therefore, APHpe and APHpa+pe could be a potent functional ingredient in the future.
Citation: Friday OA, Ojotu EM, Abraham GT, Oneh AJ (2022) Amino Acid Profile and Antioxidant Properties of Hydrolysates from Desert Date (Balanaites aeqptiaca. del) Toasted Seed Nuts. Enz Eng. 11:197.
Received: 11-Nov-2022, Manuscript No. EEG-22-20073; Editor assigned: 15-Nov-2022, Pre QC No. EEG-22-20073 (PQ); Reviewed: 29-Nov-2022, QC No. EEG-22-20073; Revised: 06-Dec-2022, Manuscript No. EEG-22-20073 (R); Published: 13-Dec-2022 , DOI: 10.35248/2329-6674.22.11.197
Copyright: © 2022 Friday OA, et al. This is an open-access article distributed under the terms of the Creative Commons Attribution License, which permits unrestricted use, distribution, and reproduction in any medium, provided the original author and source are credited.