Journal of Pollution Effects & Control
Open Access
ISSN: 2375-4397
ISSN: 2375-4397
Research Article - (2023)Volume 11, Issue 1
The contemporary research study focused on the groundwater contamination due to cement industries, limestone mining and thermal power plant around Yerraguntla town, Kadapa district, Andhra Pradesh, India. An enormous ashes generated during coals Combustion in thermal plants and during manufacturing of cement are stored in ponds is major sources of environmental pollution caused potential water pollution of ground water, another reason for water pollution due to processing of limestone cutting and polishing involves consumption of huge water and an inevitable destruction to the environments, causes of biodiversity and water pollution. Chemical analysis caried out for the ground water samples collected from the affected areas at around subjected areas, shows that the water samples are enriched in the TDS, hardiness due to calcium, Magnesium, sodium, chlorides, fluorides, nitrates, and sulphates etc., heavy metal like Mercury, Lead, Chromium, Cadmium and Arsenic. Also samples were collected from different wells in vicinity of quarry and studied for various parameters like pH, temperature, turbidity, alkalinity, total hardness, and chlorides.
Ground water; Environment; Ash; Thermal power plant; Ponds limestone; Chemical analysis
Groundwater is a precious resource that many of Indian municipalities needs to utilize sustainably to meet the growing demands in its domestic, agricultural, and industrial divisions, many article describes about the importance of water [1-3] In the recent past, water demand of the river basin has been raised hastily by rising population and industrial activities; and it has led to serious exploitation of the available water resources. Meanwhile, the unplanned disposal of the anthropogenic wastes has resulted an undue accumulation of pollutant into waterway and terrain surface, and the successive leaching of the pollutants has caused the significant degradation of water quality of surface and shallow groundwater of the river basin. As a result, there is increasing trust to the depth groundwater resource as an option, safe, and consistent water source. However, knowledge on deep groundwater quality is limited and there is a lack of complete study on deep groundwater quality [4-5]. Water is essential for life, Sustainable management of this scarce resource has become a challenge nowadays owing to increased demands of increasing population, growing urbanization and rapid industrialization combined with rising agricultural production. The assessment of ground water resources is carried out at periodic intervals to determine the ground water scenario in the country. Country wide assessment of ground water resources poses challenges in terms of data availability, acquisition and maintaining uniformity and comparability of the results. There is a strong link between the assessment and management which require continuous refinements in the ground water resources assessments. Ground water plays a vital role in providing food and water security to the nation [6-8] and its management is the most challenging issue and fluoride issues the country faces now [9-10]. The number of bore wells servicing agriculture is increasing at alarming rate now. The current trend of chasing the declining water table in search of deeper water bearing zones has entailed high risk of drilling dry or very low yielding wells, especially in the Hardrock terrain. Ground water pumping is determined by private decisions; withdrawals are not subjected to any regulation. The present multidisciplinary study wherein a combination of geological, hydrologic and hydro chemical information is applied to characterize the quantity, quality and sustainability of aquifers [11-13] It necessitates a need for scientific planning in the development of ground water under different Hydro geological environs and to evolve effective management practices with the involvement of community for better ground water governance. As India is the largest user of ground water in the world, there is an urgent need for an accurate and comprehensive picture of available ground water resources, through aquifer mapping in different hydro-geological settings to enable the preparation of robust groundwater management plans for this common pool resource [14-17].
The present invention related to thermal power plant using coals Combustion is major sources of environmental pollution due to generation of enormous amounts of ashes and these are disposed in bulky ponds near the plants and there by potential possibilities of ground water contamination of the surrounding areas , cement industries and limestone mining also is one among the activities that effect environment and ecosystem, during the processing like stone cutting and polishing consumption of water is very huge and an inevitable destruction to the environments, loose of biodiversity and water pollution. An attempt has been made to carry out research study the extent of water contamination around thermal power plants, cement industries and Lime stones mines located at Yerraguntla, Kadapa district, Andhra Pradesh. Google earth location map shown in (Figure 1).
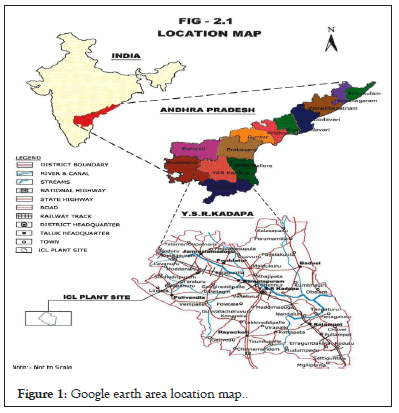
Figure 1: Google earth area location map.
Apparatus
Measuring cylinder, Pipette with elongated tip, standard flask, conical flask, Burettes, beakers, burette stand, DO bottle and wash bottle etc.
Chemicals
Silver nitrate, potassium carbonate, sodium chloride, sulphatic acid, manganese sulphate, Ethylenediamine tetraacetic acid (EDTA), sodium hydroxide and phenolphthalein indicator etc.
Study area
Kadapa district is situated in south India of Andhra Pradesh state. The stone quarry is situated on 14.6454N latitude and 78.513 E longitude in Kadapa dt. the collection of samples is done by using judgmental and stratified method. The plain covers an area of 17.7 km2 (Figure2). The area has tropical wet and dry climate, and the air temperature varies from 40- 45 °C with an average rainfall of 645mm.
Water sampling
To get the most accurate results, samples need to be collected properly and every lab may have their own set of sampling Standard Operating Procedures (SOP), there are some common best practices for collecting samples. Some basic type of collecting samples like bottle type, holding times, sampling techniques, sampling points and documentation. Before getting into sample collection and field practices, determine if samples need to meet regulatory requirement. If samples are to meet regulatory requirement, the method to be used may be dictated by the regulation. It’s important to get a good idea of the scope of the project, including sampling location/conditions and what methods will be used, because this will usually dictate how many bottles will need to be filled and what time constraints you are dealing with is important.
Sample collection bottles and materials
Before collecting samples, make sure to have all the equipment’s are like bottles, field equipment’s are proper and cleaned. There is nothing worse than being unprepared in the field, so plan as much as possible. It’s best to obtain sampling bottles from the lab running the analysis, as some not cleaned bottles used can differ slightly.
Holding times
Storage and shipment of samples one place to another place for testing purpose is very much important since it is directly impact on end results. Temperature control can be tricky, especially when sampling in the heat of summer. In the summer, it becomes critical to sample as late as possible and have samples delivered as early as practical to minimize transit time.
Sampling techniques
When collecting samples must be representative sample, before collecting the sample bore well motor pump should running, rinse the collection bottles and collect the sample in between flow of water, avoid collection from storage tanks, remove any aerator from the spigot. A good way to determine quality is usage of running water is enough is to use onsite measurements like pH, temperature, and conductivity. Take measurements every two to three minutes, and once you get three consistent measurements in a row and ready to collect samples.
Sampling toolkit
If samplings are regular basis, put together a sampling kit. A good sample kit would include supplies and equipment to run any onsite analysis, such as meters to measure pH, temperature and conductivity as well as standard solutions to properly calibrate equipment. Carrying tools, including a wrench for removing difficult aerators, screwdrivers and a flashlight, can be helpful in some situations. Supplies, such as gloves and alcohol swabs, can also be stored along with sampling equipment.
Sampling points
Collection of samples will depend on the objective of the specific analysis. For instance, collecting a sample to establish a baseline of water quality for a private well, should gather the sample prior to any treatment devices. It’s important to inspect for treatment equipment because many homeowners will not recognize a sediment filter as water treatment. In most of the cases collecting a sample from the kitchen sink is recommended, unless there is a specific water quality issue being experienced at a different tap, like a bathroom sink. To determine if treatment equipment is functioning, may the need to collect “before” and “after” examples to get best idea of how the equipment is operating. To meet a particular regulation, where you obtained the sample is usually specified.
Sample location data
The samples are collected by stratified and judgmental methods and the study area is divided into four sub areas named Yerraguntla, Kadirivaripalle, Nidizevi and Chilamakuru regions.
Sampling zones
About 20 samples planned to collect Yerraguntla surrounding area, like Yerraguntla town, Kadirivari palli, Nidizevi and Chilamakuru. Sampling zone study areas google Map mentioned Figure 2.
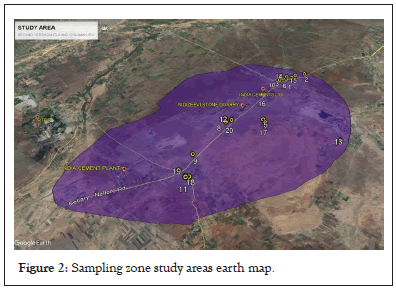
Figure 2: Sampling zone study areas earth map.
Yerraguntla area
Seven water samples were collected from different areas bore well and hand pumps around the Yerraguntla town, details mention in Table 1.
| Zone | Location | Latitude | Longitude | Source |
|---|---|---|---|---|
| 1 | Main bridge right side | 78.541344 | 14.637345 | Motor pump |
| 2 | Beside bus stand | 78.540266 | 14.635641 | Motor pump |
| 3 | Main bridge left side | 78.540794 | 14.64008 | Motor pump |
| 4 | Jyothi school | 78.547575 | 14.631164 | Motor pump |
| 5 | Urdu school | 78.538827 | 14.637951 | Hand pump |
| 6 | Church school | 78.541798 | 14.635024 | Motor pump |
| 7 | Near restaurant | 78.544211 | 14.634353 | Motor pump |
Table 1: Sample area details around Yerrlaguntla.
Kadirivari palli area
Three samples collected from different areas bore well and hand pumps around the Kadirivari palli village area, details are mentioned in Table 2.
| Zone | Location | Latitude | Longitude | Source |
|---|---|---|---|---|
| 1 | Rust bore | 78.507787 | 14.632191 | Hand pump |
| 2 | Main motor | 78.513016 | 14.60299 | Motor pump |
| 3 | School zone | 78.508898 | 14.633681 | Hand pump |
Table 2: Samples details around Kadirivaripalli area.
Nidizevi area
Five samples were collected from different areas bore well and hand pumps around the Nidizevi village area, details are mentioned in Table 3.
| Zone | Location | Latitude | Longitude | Source |
|---|---|---|---|---|
| 1 | Near bridge | 78.524164 | 14.640591 | Motor pump |
| 2 | Right of village | 78.537158 | 14.638972 | Motor pump |
| 3 | Temple 1 | 78.501546 | 14.647109 | Motor pump |
| 4 | Temple 2 | 78.499757 | 14.645809 | Motor pump |
| 5 | Main tank | 78.502006 | 14.644447 | Motor pump |
Table 3: Samples details around Nidizevi area.
Chilamakuru area
Five samples were collected from different area bore well and hand pumps Chilamakuru surrounding areas, details mention in Table 4.
| Zone | Location | Latitude | Longitude | Source |
|---|---|---|---|---|
| 16 | Center | 78.477858 | 14.6475 | Motor pump |
| 17 | Outside end | 78.468699 | 14.64739 | Motor pump |
| 18 | Sub station | 78.468102 | 14.642663 | Motor pump |
| 19 | Left area | 78.467813 | 14.64398 | Motor pump |
| 20 | Temple | 78.467335 | 14.643632 | Hand pump |
Table 4: Samples details around Chilamkuru area.
Water sample testing
After collection of samples and shipped with control room temperature to the laboratory to conduct the various experiments i.e. pH, Total Dissolved Solids (TDS), Conductivity, Hardness, Dissolved oxygen, Alkalinity and Chlorides. All tests were carried out with established standard operating procedures, Examination of Water and Wastewater’ 19th edition, APHA, BIS, World Health Organization (WHO). The below table shows the experimental methods and types of equipment’s used to conduct various experiments (Table 5).
| S.no | Parameter | Method | Equipment/instrument Used |
|---|---|---|---|
| 1 | Temperature | Laboratory method | Portable equipment |
| 2 | PH | Electrometric | Portable equipment |
| 3 | Conductivity | Electrometric | Portable equipment |
| 4 | Total Dissolved Solids | Electrometric | Portable equipment |
| 5 | Carbonate and non-carbonate,hardness | Laboratory method | Titrimetric |
| 6 | Chlorides | Laboratory method | Titrimetric |
| 7 | Dissolved oxygen | Laboratory method | Titrimetric |
Table 5: Equipment usage for different analytical tests.
Physical parameters
To evaluate the nature of ground water near the limestone quarry area, thermal power plant area and cement industries are physical parameters were analysed as per Standard Procedures (BIS and WHO). They had no odour and taste. The range of temperature measurement for the ground water samples investigated is found to be in the range of 21°C to 37°C presented in Table 6.
| Sampling points | Conductivity | pH | TDS | Chlorides (mg/L) | Hardness (mg/l) | DO (mg/L) |
|---|---|---|---|---|---|---|
| 1 | 1974 | 6.84 | 988 | 549.6 | 780 | 1 |
| 2 | 3947 | 7.25 | 1972 | 1595.7 | 470 | 2 |
| 3 | 2183 | 7.04 | 1092 | 478.7 | 530 | 2.9 |
| 4 | 1260 | 7.27 | 629 | 230.5 | 400 | 2.5 |
| 5 | 972 | 7.09 | 486 | 195 | 410 | 2.3 |
| 6 | 1120 | 7.23 | 558 | 266 | 1160 | 7.4 |
| 7 | 1958 | 6.87 | 981 | 496.4 | 700 | 3.5 |
| 8 | 954 | 6.84 | 477 | 248.2 | 470 | 3.6 |
| 9 | 830 | 6.85 | 413 | 1063.8 | 830 | 2.4 |
| 10 | 661 | 6.86 | 331 | 88.7 | 400 | 5 |
| 11 | 2092 | 7.04 | 1048 | 567.4 | 720 | 1.4 |
| 12 | 4000 | 6.86 | 2000 | 2234 | 560 | 2.6 |
| 13 | 1046 | 7.05 | 524 | 177.3 | 370 | 4.2 |
| 14 | 2713 | 7.03 | 1359 | 638.3 | 800 | 3.2 |
| 15 | 1493 | 6.92 | 747 | 407.8 | 570 | 3.3 |
| 16 | 1270 | 6.9 | 636 | 195 | 300 | 2.7 |
| 17 | 1687 | 6.97 | 843 | 301.4 | 540 | 5 |
| 18 | 4000 | 7.16 | 2000 | 2216.3 | 1970 | 1 |
| 19 | 3051 | 7.23 | 1499 | 904.2 | 580 | 1.4 |
| 20 | 3785 | 7.05 | 1893 | 141.8 | 400 | 1.5 |
Table 6: Physico-chemical characterization of ground water samples.
Chemical parameters
The results of the chemical parameters analyzed are mentioned in Table 6 and are compared with water quality standards of BIS. The highlighted zones are varies more compared to other zones with the standard values.
pH and conductivity
The pH of the water samples ranged between 6.8-7.27 and found within the permissible limits except for few which showed acidic nature. The conductivity values ranged between 661-4000 μs, wherein few samples showed the values beyond the permissible limits. Higher values suggest the presence of high amount of dissolved inorganic substance in ionized form. The samples collected from quarry sites showed higher electrical conductivity values probably due to the input of large amounts of salts and silts presented in Table 6.
Total dissolved solids
All sites sample except few samples showed with high concentration of Total Dissolved Solids (TDS). It is reported that high TDS content limits are determines the usage of ground water for any purpose, high dissolved solids generally having inferior palatability and may induce an unfavorable physiological reaction in the transient consumer. The TDS values ranged between 330 to 2000 mg/L of which few samples showed the values are boarder to the permissible limits shown in Table 6 and Figure 3.
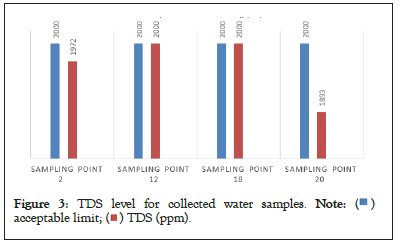
Figure 3: TDS level for collected water samples. 

Total hardness
The presence of carbonates and bicarbonates of calcium and magnesium, sulphates, chlorides, nitrates, influence the ground water to become hard. The hardness in the analyzed samples ranging between 300 to 1970 mg/L of which few samples exceeded the acceptance limits (500 ppm) presented in Table 6 and Figure 4.
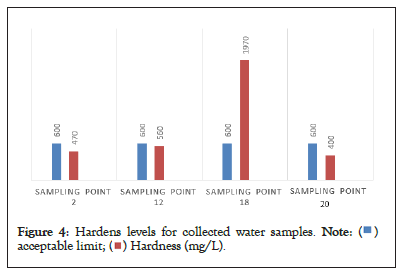
Figure 4: Hardens levels for collected water samples. 

Chlorides
Chloride is the most abundant anion in the human body. It is present in natural waters due to the dissolution of salt deposits and its concentration is high in ground waters. Soil porosity and permeability also play an important role in building up the chloride value, in the study area the chloride concentrations were observed that ranges from 88.70 mg/L to 2216.30 mg/L shown in Table 6, compared with the standards few samples were beyond the limits 250 mg/L as per WHO and BIS. Similarly study of Chemical characteristics of groundwater depicts that the chloride content is beyond the permissible limit, these two elements are directly added into the groundwater from industrial and domestic wastes and contribute salinity of water, and high chloride concentration indicates organic pollutants in the water. Excess of chloride in ground water imparts salinity in water and affects human biological system after consumption, results presented in Table 6 and Figure 5.
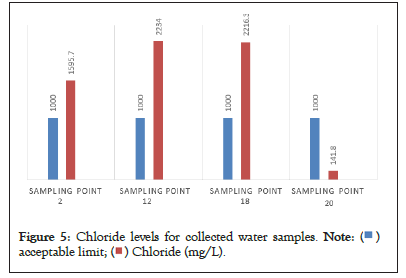
Figure 5: Chloride levels for collected water samples. 

Some samples were tested for ground water quality assessment like turbidity, hardness, pH, pesticides and many trace elements presence in collected samples at Pragati labs and consultants PVT limited, Hyderabad. Obtained results were tabulated in Table 7.
| Parameters | Units | Method of analysis | Detectable Limit | Yerraguntla | Limits | |
|---|---|---|---|---|---|---|
| Sample-1 | Sample-2 | |||||
| Color | Hazen | IS 3025 (PO4) | 2.0 | 5 | 6 | 5 to 25 |
| Odour | - | IS 3025 (PO5) | - | Unboj. | Unboj. | Unboj. |
| Taste | - | IS 3025 (PO7) | - | Agreeable | Agreeable | Agreeable |
| Turbidity | NTU | IS 3025 (PO10) | 1.0 | 6 | 7 | 5 to 10 |
| pH | -- | IS 3025 (PO11) | 0.5 | 7.2 | 7.7 | 6.5 to 8.5 |
| T-Hardness as CaCO3 | mg/L | IS 3025 (PO21) | 1.0 | 848 | 994 | 300-800 |
| Iron (as Fe) | mg/L | APHA | 0.03 | 0.2 | 0.15 | 0.3-1.0 |
| Chlorides as Cl | mg/L | IS 3025 (P32) | 0.5 | 462 | 686 | 250-1000 |
| Residual, free chlorine | mg/L | IS 3025 (P26) | 0.02 | 0.1 | 0.1 | 02 to NR |
| Total dissolved solids | mg/L | IS 3025 (P16) | 0.1 | 1440 | 1235 | 500-2000 |
| Calcium as Ca | mg/L | IS 3025 (P40) | 1.0 | 152 | 315 | 75-200 |
| Cooper as cu | mg/L | APHA | 0.02 | 0.05 | 0.06 | 0.05 to 1.5 |
| Manganese (as Mn) | mg/L | APHA | 0.02 | <0.1 | <0.1 | 0.1 to 0.3 |
| Sulphates as SO4 | mg/L | IS 3025 (P24) | 1.0 | 72 | 96 | 200-400 |
| Nitrate (as NO3) | mg/L | IS 3025 (P34) | 0.05 | 32 | 20 | 45-100 |
| Fluorides as F | mg/L | APHA | 0.1 | 1 | 1.1 | 1.0 to 1.5 |
| Phenolic compounds (as C6H5OH) |
mg/L | IS 3025 (P43) | 0.001 | <0.001 | <0.001 | 0.001-0.002 |
| Mercury (as Hg) | mg/L | IS 3025 (P46) | 0.001 | <0.001 | 0.002 | 0.001-NR |
| Cadmium (as Cd) | mg/L | IS 3025 (P41) | 0.005 | 0.01 | 0.01 | 0.01-NR |
| Selenium (as Se) | mg/L | APHA | 0.01 | 0.01 | 0.01 | 0.01-NR |
| Arsenic (as As) | mg/L | IS 3025 (P37) | 0.005 | <0.05 | <0.05 | 0.05-NR |
| Cyanide (as CN) | mg/L | IS 3025 (P27) | 0.005 | <0.05 | 0.05 | 0.05-NR |
| Lead (as Pd) | mg/L | IS 3025 (P47) | 0.05 | 0.05 | 0.05 | 0.05-NR |
| Zinc (as Zn) | mg/L | IS 3025 (P49) | 0.01 | 6 | 6 | 5 to 15 |
| Anionic detergents (as MBAS) |
mg/L | APHA | 0.01 | <0.2 | 0.3 | 0.2-1.0 |
| Chromium (as Cr6+) | mg/L | APHA | 0.05 | <.06 | 0.06 | 0.05-NR |
| Mineral Oil | mg/L | APHA | 0.001 | 0.01 | 0.01 | 0.01-0.03 |
| Pesticides | mg/L | APHA | 0.001 | Absent | Absent | Absent-0.001 |
| T. Alkalinity as CaCO3 | mg/L | IS 3025 (P23) | 1.0 | 730 | 1080 | 200-600 |
| Aluminum (as Al) | mg/L | APHA | 0.1 | 0.04 | 0.04 | 0.03-0.2 |
| Boron (as B) | mg/L | APHA | 0.1 | 2 | 1 | 1 to 5 |
| Total coliforms | MPN/100 ml | APHA | 2.0 | 3 | 6 | 3 |
| Magnesium as Mg | mg/L | IS 3025 (P45) | 0.5 | 86 | 124 | 30-100 |
Table 7: Water samples complete testing results.
Ground water quality is dependent on the type of the pollutant, and it is also based on the nature of mineral found at specific space of bore well or ponds. Ground water quality monitoring is done by collecting ground water samples at different locations at Yerraguntla surrounding area and carried out the physicochemical characteristics analysis of collected water samples. The groundwater assessment was satisfying for domestic purpose but not for drinking since the water containing the TDS and Hardness. Hardness due to chlorides of calcium and magnesium, which will build up lime scale inside of the pipe and causing blockage. By the long-term water-rock interaction within the stone quarries the percentage of tested parameters will rise and the region will not be suitable for human habitant. This area water should be either filtered or boiled to decrease the TDS and hardness before utilization of domestic purpose. To avoid further water contamination of subjected area must be taken some measures like open quarry should be covered with vegetation to reduce the contamination, fly ashes from thermal power plant should be covered with low fore size nets to control the spreading and cement manufacturers must be in closed condition. These industries around Yerraguntla area must be improved their capabilities to Zero Liquid Discharge (ZLD) treatment procedure of wastewater which is generating their manufacturing process.
[Google Scholar] [PubMed]
Citation: Kalpana A, Puppala RK, Maheswaramma KS (2023) An Assesment of Ground Water Contamination Due to Heavy Metals and Fly Ash around Yerraguntla Town, Kadapa District, Andhra Pradesh, India. J Pollut Eff Cont. 11: 356.
Received: 11-Jan-2023, Manuscript No. JPE-23-21371; Editor assigned: 13-Jan-2023, Pre QC No. JPE-23-21371 (PQ); Reviewed: 27-Jan-2023, QC No. JPE-23-21371; Revised: 03-Feb-2023, Manuscript No. JPE-23-21371 (R); Published: 10-Feb-2023 , DOI: 10.35248/2375-4397.23.11.356
Copyright: © 2023 Maheswaramma KS ,et al. This is an open-access article distributed under the terms of the Creative Commons Attribution License, which permits unrestricted use, distribution, and reproduction in any medium, provided the original author and source are credited.