Journal of Theoretical & Computational Science
Open Access
ISSN: 2376-130X
ISSN: 2376-130X
Research Article - (2024)Volume 10, Issue 2
For water at atmospheric pressure, in the temperature range from 0°C to 100°C, the specific heat at a constant pressure shows a constant value of approximately 4.2 J/(gK), the density reaches its maximum at 3.98°C and the isothermal compressibility reaches its minimum at approximately 46°C. However, the mechanisms underlying these anomalous thermodynamic phenomena in water remain unclear. However, the thermodynamic mechanism that causes negative thermal expansion of water has recently been elucidated by the present author in relation to the functional shape of the interactions between water molecules. In this study, we further elucidate the mechanisms underlying the changes in the specific heat at constant pressure and isothermal compressibility with temperature by relating these changes to the functional shapes of intermolecular interactions. We also showed that the anomalous thermal behavior of water is produced by the anomalous thermodynamic properties of the interactions between water molecules. The same can be inferred for the ice. The experimental verification of these issues is strongly desired.
Liquid water; Anomalous thermodynamic properties; Water molecules; Intermolecular interactions
When the Pressure (P) is 1 atm and the Temperature (T) is 3.98°C or higher, water expands when heated and contracts when cooled (positive thermal expansion). However, at temperatures below 3.98°C, water contracts when heated and expands when cooled (negative thermal expansion). The measured values of the change in the water density (mρ) with temperature are shown as black circles in Figure 1. Here, m represents the mass of one water molecule and ρ represents the number of water molecules per unit volume (Figure 1).
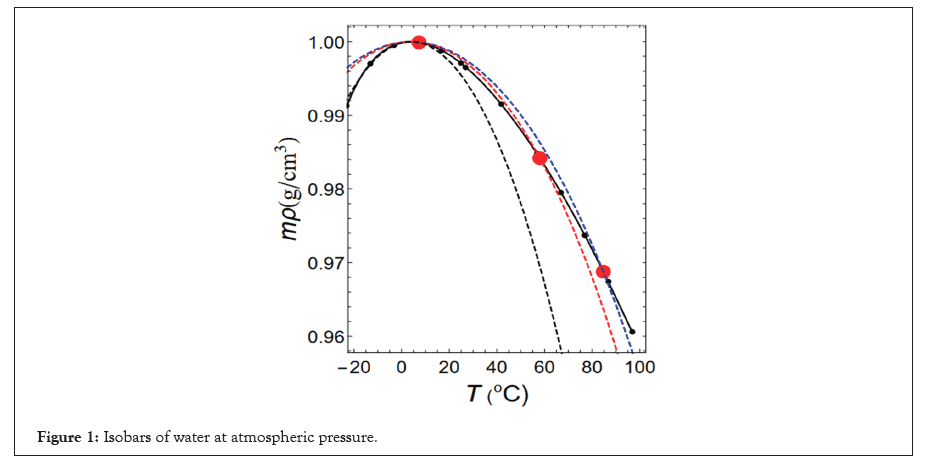
Figure 1: Isobars of water at atmospheric pressure.
The black circles indicate the experimental results [1]. The red circles represent the theoretical isobars obtained in this study. The solid black line represents measured value of mρ. The blue, red and black dashed lines represent isobars obtained by fixing the functional shape of the intermolecular interactions shown by the solid blue, red and black lines respectively.
The isothermal compressibility k is defined in Equation (1)

Where v denotes the volume of the system under consideration. The temperature dependence of k is shown in Figure 2, k reaches its minimum at approximately 46°C (Figure 2).
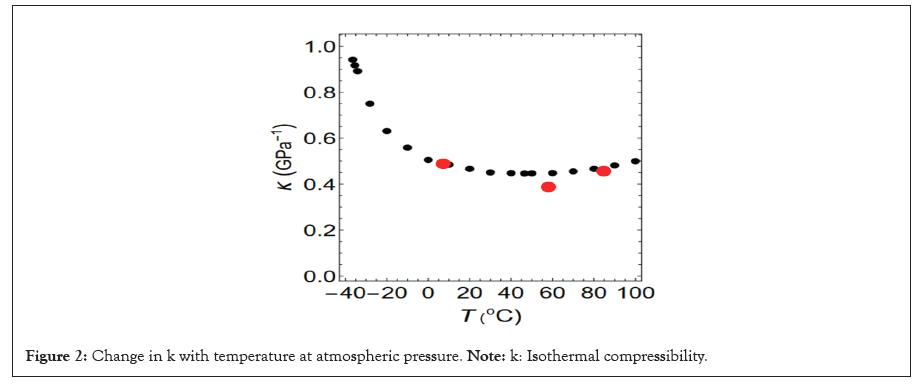
Figure 2: Change in k with temperature at atmospheric pressure. Note: k: Isothermal compressibility.
The black circles represent the experimental results [2]. The red circles indicate the theoretical results of this study.
Furthermore, the measured value of the isobaric specific heat cp of water nearly remains constant at 4.2 J/(gK) in the temperature range 0<T (°C)<100.
Thermodynamic physical parameters, such as water density, isothermal compressibility and specific heat at constant pressure, exhibit unexplained changes with temperature. For centuries, numerous scientists have conducted research to elucidate the mechanisms by which such unusual phenomena occur and various theories have been proposed [3-18]. Although none of these theories have solved these issues, Yasutomi [19-22], recently solved the mystery of the unusual change in density with temperature by relating this change to the functional shape of the interactions between the water molecules. In this study, we identify intermolecular interactions that can reproduce the measured results of changes in specific heat at constant pressure and isothermal compressibility, in addition to density and temperature and explain the unusual thermal behavior of water. We show that these changes are caused by unusual thermodynamic properties of the molecule.
Unraveling the mystery of related phenomena in relation to the shape of the interactions between molecules has been a traditional and fundamental method in physics since Newton’s time.
Isobaric specific heat capacity and excess internal energy
The measured value of mρ shown in Figure 1 can be reproduced using the following Equation (2)

Here, the unit of T is degrees Celsius. In addition, (c0,c1-c7)=(0.99984, 6.7403 × 10⁻⁵, -9.0917 × 10⁻⁶, 1.1429 × 10⁻⁷, -2.1114 × 10⁻⁹, 3.1712 × 10⁻¹¹, -2.6661 × 10⁻¹³, 8.9058 × 10⁻¹⁶).
The thermal expansion coefficient αp is defined in Equation (3)

The results obtained by substituting Equation (2) into Equation (3) are shown in Figure 3.
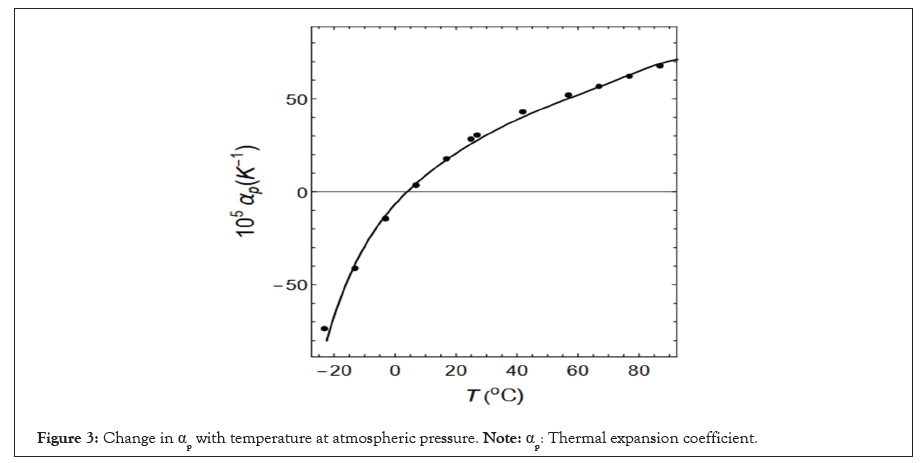
Figure 3: Change in αp with temperature at atmospheric pressure. Note: αp: Thermal expansion coefficient.
The black circles indicate the experimental results [1]. The solid line represents Equation (3). The potential energy u per unit volume of the system is called the excess internal energy and is expressed in Equation (4).

Here, U is the total potential energy of the system, g(r) is the two-body distribution function of the water molecules and ϕ(r) is the intermolecular interaction. The isobaric specific heat capacity cp of water is expressed in Equation (5)

Where, k is Boltzmann’s constant. To calculate αp in Equation (5), we use Equations (2) and (3), which are justified by the identification of the intermolecular interactions that can reproduce Equation (2) with high accuracy.
If we set cp=4.2 J/(gK) and substitute Equation (3) into Equation (5), we obtain a first-order differential equation for u(T) with respect to T. If we solve this equation numerically, we obtain the u(T) indicated by the solid line. There are an infinite number of such u(T) curves because they contain an integration constant. However, we adopt u(0°C)=-2096.66 J/cm³. Therefore, we reproduce cp(T)=4.2 J/(gK) and the u-T relationship shown by the solid line in Figure 4.
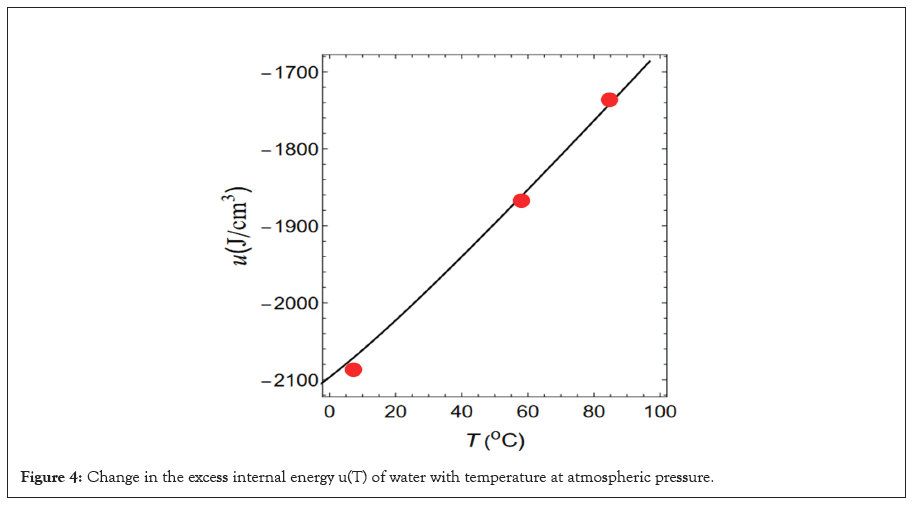
Figure 4: Change in the excess internal energy u(T) of water with temperature at atmospheric pressure.
In this study, we aimed to identify the interactions between the water molecules that reproduce the solid line in Figure 4 and the experimental results shown in Figures 1 and 2. Furthermore, we clarified the relationship between the functional shapes of the interactions and these thermodynamic phenomena. Therefore, a suitable water model must be developed.
Water model
Various thermodynamic physical quantities can be derived from the thermodynamic potential u defined in Equation (4). Because the relationship between u and ϕ(r) is clear compared to other thermodynamic potentials, our method is convenient for this type of research. ‘u’ can be obtained by numerically solving the following equation using the Self-Consistent Ornstein-Zernike Approximation (SCOZA) in Equation (6) [23-29].

The red circles indicate the theoretical results of this study.
Here, β=1/kT and Xred is the reduced isothermal compressibility defined by the following Equation (7)

The intermolecular interaction ϕ(r) of water in thermal equilibrium comprises three parts: the hard-core potential, soft-repulsive tail and attractive tail and is expressed in Equation (8).

Here, a2 is normalization constant with a potential depth of 1 and a3/a2, Z2 and Z3 are the free parameters. In addition, the hard core diameter (σ) is a unit of length and the potential depth (ε) is a unit of energy.
Calculation method
If the thermal equilibrium state of water changes, then the structure, coordination and orientation of the water molecules and the shape of the electron wave function around each water molecule will change accordingly. Therefore, the functional shape of the interaction between water molecules constantly changes as the thermal equilibrium state changes. In this study, we considered these effects in our calculations.
In SCOZA, we performed calculations using water vapour in thermal equilibrium at atmospheric pressure and infinite temperature as the initial conditions and then gradually lowered the temperature.
Thermal equilibrium has been thermodynamically proven independent of the path through which it is achieved. Therefore, calculations can be performed using the functional form of fixed intermolecular interactions. At a certain temperature, if the experimental and theoretical values of the density and isothermal compressibility agree and if the theoretical value of the excess internal energy matches the u shown in Figure 4 by the solid line, then this intermolecular interaction can be considered to be the interaction between water molecules in a state of thermal equilibrium at that temperature.
Calculation results in the range of 0<T (°C)<100
The physical quantities that are reproduced are the changes in three quantities with temperature, density, isobaric heat capacity and isothermal compressibility. However, the measured values of the specific heat at constant pressure were only obtained for the temperature range 0<T (°C)<100; therefore, we discuss the thermodynamic phenomena within this temperature range.
The interaction between water molecules defined by Equation (8) includes four parameters (a2, a3 and Z2, Z3). However, because a2 is normalization constant, the interaction is specified by a combination of the three remaining free parameters (a3/a2 and Z2, Z3) ∞³ combinations exist. We identified three sets of combinations that reproduced the experimental results. There were three temperature values, expressed in degrees Celsius: T1=84.69, T2=58.05 and T3=7.25.
Z2 and Z3 with respect to temperature are listed in Table 1. The values of a2, a3/a2, σ and ε are listed in Table 2. The tails of the intermolecular interactions with respect to the temperature Tj (j=1-3) are shown in Figure 5.
| T | T1 | T2 | T3 |
|---|---|---|---|
| Z2 | 39 | 49 | 99.9 |
| Z3 | 40 | 49.1 | 110 |
Note: Z2 and Z3 are free parameters.
Table 1: Values of Z2 and Z3 with respect to Temperature (T).
| T | a2 (ε) | a3/a2 | σ (A) | ε (10-20 J) |
|---|---|---|---|---|
| T1 | 126.399 | -1.00347 | 3.081952 | 2.19461 |
| T2 | 1612.13 | -1.00034 | 3.09656 | 2.39083 |
| T3 | 37.092 | -1.02672 | 3.06838 | 3.20971 |
Note: a2: Normalisation constant; a3/a2: Free parameter; (σ): Units of length; (ε): Units of energy.
Table 2: Values of a2, a3/a2, (σ) and (ε) with respect to Temperature (T).
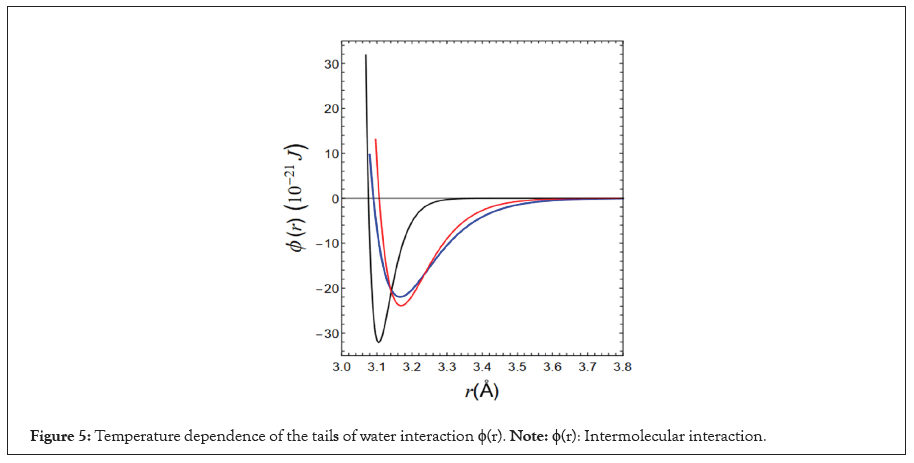
Figure 5: Temperature dependence of the tails of water interaction ϕ(r). Note: ϕ(r): Intermolecular interaction.
The tails of the three intermolecular interactions are indicated by blue, red and black lines in Figure 5. The isobars obtained by fixing the shapes of these functions are shown as blue, red and black dashed lines in Figure 1. The dashed lines indicate the maximum density. For the isobars, if we implement the condition that the theoretical and experimental maximum densities match at 1 atm and 3.98°C, then the values of the length-unit (σ) and the energy-unit (ε) are obtained from the following Equations (9-11) [23].


Where ρmd is the theoretical value of the maximum density, Tmd is the theoretical value of the temperature at the density and Pmd is the theoretical value of the pressure at ρ=ρmd and T=Tmd. The values of ρmd, Tmd and Pmd obtained from the three dashed isobars in Figure 1 are listed in Table 3.
| Blue line | Red line | Black line | |
|---|---|---|---|
| Pmd (10-5) | 13.53 | 12.61 | 9.138 |
| ρmd | 0.9794 | 0.9934 | 0.9665 |
| kTmd | 0.1743 | 0.16 | 0.1192 |
Note: ρmd: Theoretical value of maximum density; Tmd: Theoretical value of the temperature at the density; Pmd: Theoretical value of the pressure; k: Isothermal compressibility.
Table 3: Values of Pmd, ρmd and Tmd with respect to the theoretical isobars.
The theoretical isobar, shown as the blue dashed line in Figure 1 coincides with the experimental isobar, shown as a solid line, at the points of maximum density. The blue dashed line deviates from the solid line as the temperature increases, but it intersects the experimental isobar again at the red circle point T=T1 shown at the right end of the figure. The same is true for the isobars indicated by the red and black lines, which intersect the experimental isobar at the red circle points T=T2 and T=T3, respectively. Therefore, the experimental and theoretical values of temperature and density determined by fixing the three intermolecular interactions relative to atmospheric pressure agree with high accuracy.
The excess internal energies obtained from these three interactions are indicated by red circles in Figure 4. As shown in the Figure 4 these models reproduce the excess internal energy indicated by the solid line with high accuracy. The process for reproducing the u(T) shown by this solid line is the same as that for reproducing the isobaric specific heat capacity of cp=4.2 J/ (gK). However, when calculating αp, ρ is assumed to change along the isobar indicated by the solid line in Figure 1 because the real water changes along the isobar shown as the solid line and not along the isobars shown as broken lines.
In addition, the isothermal compressibility k obtained for the three interactions mentioned above is indicated by red circles in Figure 2. The isothermal compressibility’s k (T1) and k (T3) obtained from the tails indicated by the blue and black dashed lines in Figure 5 reproduced the experimental values with high accuracy. However, k (T2) obtained from the tail indicated by the red broken line does not agree well with the experimental value, although we believe that it is within the allowable range.
Figure 6 shows the radial distribution functions g(r) of the water molecules for each thermal equilibrium state at temperatures T1-T3.
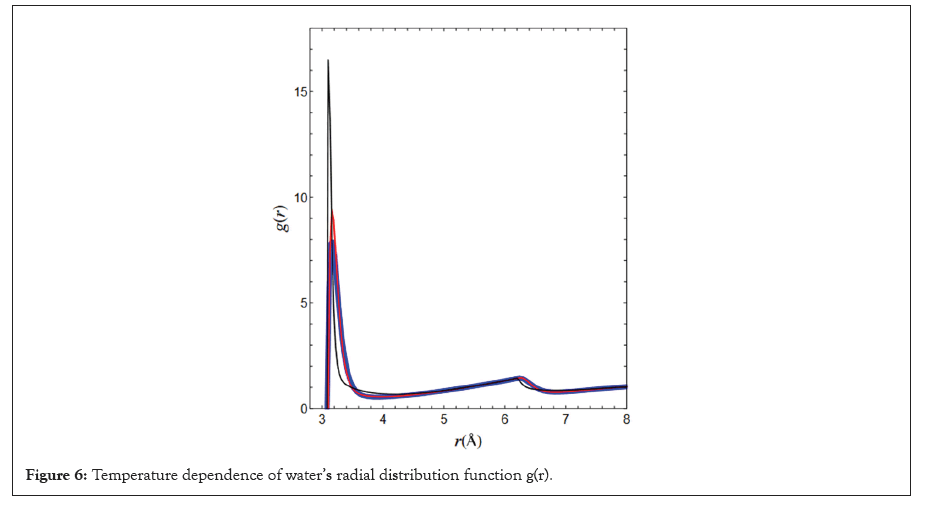
Figure 6: Temperature dependence of water’s radial distribution function g(r).
As the temperature decreased, the principal maximum of g(r) increased and the position r decreased monotonically, which is likely a reflection of the fact that in this temperature range, the density increases monotonically with decreasing temperature due to positive thermal expansion. Similarly, below 4°C, it is inferred that the principal maximum of g(r) decreased and the position r increased monotonically as the temperature is cooled because of the negative thermal expansion. From this temperature dependence of g(r), it is easy to understand the temperature dependence of the density, but it is difficult to elucidate the relationship between the isobaric specific heat and the thermal behaviour of isothermal compressibility. The author believes that the temperature dependence of intermolecular interactions is more important in unravelling the mysteries of the thermodynamic behaviour of water.
The results shown in Figure 6 do not seem to have very good reproducibility when compared to the actual measurements. However, considering the current general precision of liquid physics, we believe that our results are acceptable.
Water exhibits mysterious thermodynamic properties. Numerous scientists have attempted to unravel this mystery and various theories have been proposed.
However, none of these theories have resolved this issue. Recently, the author of this paper solved the mystery of negative thermal expansion exhibited by water by relating this phenomenon to the functional shape of intermolecular interactions. Furthermore, in this study, we identified intermolecular interactions for three temperatures (T1, T2 and T3)=(84.69, 58.05 and 7.25) that can reproduce the experimental results of changes in three thermodynamic quantities with temperature in the temperature range of 0<T (°C)<100, specific heat at constant pressure, isothermal compressibility and density. These three intermolecular interactions are shown in Figure 5.
In addition, the excess internal energy u(T) is indicated by red circles in Figure 4. These red circles reproduce the u-T relationship shown by the solid black line with high accuracy. The energy u(T) indicated by the solid black line is the excess internal energy, which yields cp=4.2 (J/gK). However, there are countless other u(T) curves owing to their integration constant. The solid line in Figure 4 is an example. In addition, because of this indeterminacy, the functional shape of the intermolecular interactions shown in Figure 5 is not unique at a given temperature and numerous other shapes may exist. Therefore, in the future, we must devise a method to eliminate this uncertainty.
The change in density with temperature is indicated by the red circles in Figure 1 and the experimental values were reproduced with high accuracy. This justifies the use of Equation (2) when calculating αp.
The change in isothermal compressibility with temperature is indicated by the red circles in Figure 2. The experimental values of k for 84.69°C and 7.25°C are accurately reproduced. However, although the reproducibility of k at 58.05°C cannot be considered highly accurate, we believe that it is within the acceptable range.
Currently, the amount of theoretical data is insufficient; therefore, we need to increase the amount of theoretical data to reproduce experimental values with high accuracy. However, the anomalous thermodynamic behavior of water is caused by complex changes in the interactions between the water molecules as the temperature changes. The same can be inferred from the thermodynamic properties of the ice. The experimental verification of these issues is strongly desired. Furthermore, interesting changes in the density and isothermal compressibility with temperature were experimentally obtained at temperatures below 0°C and to unravel the mystery of this behavior, measurements of the isobaric specific heat at temperatures below 0°C are required. In addition, researching the properties of liquids that do not exhibit negative thermal expansion, as in this study and comparing them with those of liquids that exhibit negative thermal expansion are important for understanding the thermodynamic properties of liquids as a whole. We also believe that by numerically calculating the changes in the electron wave function around water molecules with temperature, we will gain deeper knowledge about the temperature dependence of the intermolecular interactions.
[Crossref] [Google Scholar] [PubMed]
[Crossref] [Google Scholar] [PubMed]
[Crossref] [Google Scholar] [PubMed]
[Crossref] [Google Scholar] [PubMed]
[Crossref] [Google Scholar] [PubMed]
[Crossref] [Google Scholar] [PubMed]
[Google Scholar] [PubMed]
[Crossref] [Google Scholar] [PubMed]
[Crossref] [Google Scholar] [PubMed]
Citation: Yasutomi M (2024) Anomalous Thermodynamic Properties of Water and Water Molecules. J Theor Comput Sci. 10:217.
Received: 24-May-2024, Manuscript No. JTCO-24-31668; Editor assigned: 27-May-2024, Pre QC No. JTCO-24-31668 (PQ); Reviewed: 11-Jun-2024, QC No. JTCO-24-31668;; Revised: 18-Jun-2024, Manuscript No. JTCO-24-31668 (R); Published: 25-Jun-2024 , DOI: 10.35248/2376-130X.24.10.217
Copyright: © 2024 Yasutomi M. This is an open-access article distributed under the terms of the Creative Commons Attribution License, which permits unrestricted use, distribution and reproduction in any medium, provided the original author and source are credited.