Journal of Geography & Natural Disasters
Open Access
ISSN: 2167-0587
+44-77-2385-9429
ISSN: 2167-0587
+44-77-2385-9429
Research Article - (2024)Volume 14, Issue 3
Flood Frequency Analysis (FFA) is an important component of flood risk mitigation and preparedness. It shows where floods might happen, and provides vulnerability data needed for response and preparedness. However, in developing countries like Malawi, there are limited studies that integrate FFA to understand the spatiotemporal characteristics in flood risk analysis. This informed the need to undertake this study in rural areas of Traditional Authority (T/A) Kilupula in Karonga District (KD) and Mtandire Ward in Lilongwe City (LC). The study utilized hydrological streamflow, Geographical Information System (GIS), and disaster profile data for the Lufilya and Lingadzi catchments in KD and LC respectively. Baseline data was collected from the Departments of Water Resources and Disaster Management Affairs in the Ministries of Water and Sanitation and Natural Resources and Climate Change respectively. Statistical methods and ArcGIS 10.8 were used to analyze data. The results found a higher expected flood for Lingadzi compared to Lufilya catchments in LC and KD respectively at different return periods. Spatiotemporal characteristics such as increased volume of water in the channels due to short lag time resulting from sealing of land surface and loss of agricultural land due to changes in river channels, human occupancy along the river channels and poor catchment management contribute to high household flood vulnerability. This study provides a basis for integrating FFA into FVA (Flood Vulnerable Areas) in any region in the world because all the input data is globally available.
Vulnerability; Floods; Mtandire; Kilupula; Karonga; Lilongwe city; Malawi
The frequency of floods is increasing across the world, resulting in the most serious and devastating natural threats to lives, properties, and living environments [1-3]. Flood hazards are associated by spatial characteristics such as nature (types of forces associated with it), intensity (potentially destructive), extent (geographical distribution), predictability (ability for reduction, mitigation, prevention of impact), and manageability (ability to reduce and manage the impacts). The temporal characteristics of flood hazards include frequency, duration, speed of onset, and forewarning systems. Therefore, understanding these characteristics in flood vulnerability assessment is a crucial step to reducing the impacts of flood risks [4].
A flood is the overflowing of the normal confines of a stream or other body of water, or the accumulation of water over areas that are not normally submerged. Floods include river (fluvial) floods, flash floods, urban floods, pluvial floods, sewer floods, coastal floods, storm surges, and glacial lake outburst floods [5]. The main causes of floods are intense and/or long-lasting precipitation, snow/ice melt, a combination of these causes, dam break (e.g., glacial lakes), reduced conveyance due to ice jams or landslides, or a local intense storm. The shocks arising from flood hazards are felt by the poor. Poor households are more unable to cope than non-poor households [6]. The poor own fewer productive assets, are more likely to reside in hazardous locations and substandard housing, and are primarily dependent on their labor to meet their livelihood needs [7]. For many years, these conditions were attributed to rural people. Yet today, floods and risks with limited institutional support mostly affect urban informal settlements [2].
Floods are the manifestation of the increased total volume of water due to high rainfall. It occurs when a body of water rises to overflow some land that is not usually submerged. As such, water has a negative vulnerability face and consequently a threat to life [8]. The increased people’s vulnerability patterns generate flood hazards to have a higher impact on human life and their livelihoods [1]. Munyani et al., state that floods have caused losses to various communities around the world [9]. Flood hazards are a global issue that must be planned and prepared for at international, national, and local level [1,9]. A flood is further understood from the perspectives of geomorphology, water resources management, and hydrology. While these disciplines look at floods with different insights, there exists commonality within the term. All the disciplines attribute floods to the overflow of water in the riverbanks. This study, however, relies much on the hydrological definition of a flood, defined as an upward condition of water levels in coastal areas, reservoirs, streams, and canals [10].
In the current period, climate change has induced the occurrence and magnitude of floods across the globe [1]. Their impacts linked with conditions of societal poverty and powerlessness have accelerated and raised the vulnerability of people. This has resulted in widespread destruction in all aspects of human life such as the physical, social, economic, environmental, and cultural domains [11,12]. Rajan et al., in a study of the geospatial approach for assessment of vulnerability to floods, maintain that the increase in occurrence of floods necessitates undertaking flood vulnerability assessment to identify flood mitigation strategies [13]. A study on the impacts of floods worldwide showed that the number of floods occurring worldwide is increasing [14]. For instance, from 2000, 2007, 2014, and 2015, this catastrophic natural hazard has struck many people worldwide [15]. It is further indicated that between 2010 and 2020, floods affected almost 3.6 billion people comprising 56 percent of the world's total population [15]. Other findings indicate that more flood-related deaths arise not due to flood intensity but due to flood frequency [14]. The term “flood” is listed more frequently in the international database than any other hazard. For example, in Taylor and Francis Journal, the term appears 160,247 times; Springer Link 83157, Science Direct 244,408, Sage Journals 39319 and JSTOR 399,417 [14]. Floods can destroy critical infrastructure, buildings, roads, and bridges; Tear out trees; Devastate agriculture; Cause mudslides; and threaten human lives [16]. Africa is exceptionally vulnerable to climate variability and change compared to many other regions [17]. Floods represent a major natural hazard in Africa and have strong impacts on the population and their activities, claiming a large toll in terms of fatalities and economic damage [18,19]. EM-DAT data revealed over 32,000 deaths and approximately 8.7 million affected people in over 1 to 100 flood events from 1927 to 2022. The negative impacts of floods, as evidenced in the literature remain critical indications that floods are frequent natural event that calls for serious interventions to minimize their impacts on people and their belongings. The mitigation of the effects of floods requires monitoring of the location, extent, time, and depth of the floods. To achieve this, applying FFA to understand spatiotemporal FVA is a necessity for developing successful flood mitigation measures. Therefore, this study was premised on this necessity to compare the spatiotemporal characteristics of household flood vulnerability in rural and urban informal settlements of Karonga District and Lilongwe city respectively.
Conceptualizing the flooding situation in Malawi
Extreme climatic and weather events such as floods, cyclones, and dry spells are frequently affecting various parts of Malawi. Rural and urban are equally devastated by the impacts of these climatic-related events. The country has experienced over twenty-five disasters associated with severe rainfall events in the last decade [20]. For instance, between the periods of 2015-2023, about four major floods induced by tropical cyclones have affected communities. The most destructive was the floods of 11-13 March 2023, influenced by Tropical Cyclone Freddy (TCF), which killed about 679 people, injured 2178 people, displaced about 563,602 people, and about 511 people were reported missing, including causing several other damages and loss in sectors such as agriculture, infrastructure, food security and health [20]. A “state of disaster” was declared on the 13th of March in the districts that were affected by the cyclone namely; Blantyre City and District, Chikwawa District, Chiradzulu District, Mulanje District, Mwnza District, Neno District, Phalombe district, Nsanje district, Thyolo district and Zomba city and district. Relatedly, in January 2022, the passage of a tropical storm named “Ana” over southern Malawi with heavy rainfall caused river overflow, floods, and landslides. The flooding affected 19 districts in the southern region and among the heavily affected districts were Chikwawa, Mulanje, Nsanje, and Phalombe. The event caused 46 deaths and 206 injuries, and 152,000 people were displaced with several infrastructural damages. The country also experienced the worst cyclone Idai which originated from Mozambique in 2019. This cyclone induced floods which killed 60 people as well as affected 975,000, displaced 86,976, and injured 672 people [21]. In January and February 2015, over 1 million people were affected and about US$ 335 million was incurred on infrastructural damage [22]. The Sentinels-4-African DRR rank Malawi position 11 out of 53 African countries affected by floods from 1927-2022 with statistics of 42 events, 948 deaths, and 3,531, 145 people affected. Similarly, the 2011 climate change vulnerability index by the British risk analysis Firm Maplecroft ranks Malawi 15 out of 16 countries with extreme risks to climate change impacts in the world. It is one of the only four African countries classified in this category. Floods have been categorized as occurring widespread in terms of geographical area. For instance, the Malawi National disaster profile that dates from 1946 indicates frequent severe floods occurring in the country.
DoDMA indicates that floods cause huge loss of life, damage, and destruction of the environment, property, and agricultural and livestock systems [23]. For instance, DoDMA reported that the damage and loss resulting from floods induced by TCF had the highest impact on the agricultural sector with a total of 2,267,458 people equivalent to 523,564 households lost their crops and livestock [24]. It was further found that food security was the second highest impacted sector with 901,466 households being food insecure. Shelter came third with 882,989 households that had their houses either partially or completely damaged. Looking at all the consequences that floods have on people, the Malawi Government in partnership with local and international developmental organizations (such as the World Bank (WB) and the United Nations Development Programme (UNDP) developed policies that incorporate risk information. This is done as a way of reducing risks from disasters on the rate of development. There are some efforts taken by the Government of Malawi and stakeholders to reduce the impacts of flood disasters. For instance, the Disaster Preparedness and Relief (DPR) Act (1991) aimed at promoting a proactive approach as a transition from a reactive approach to addressing disaster issues in the country. However, the DPR Act has been reactive in dealing with disaster issues in the country. The Act mainly focused on response and relief activities rather than on DRR. At the time of this study, the new Bill was published on 5th March 2023 as “Bill No.9” of Disaster Risk Management in a “Gazette Extraordinary Supplement” in Parliament. The Disaster Risk Management Bill seeks to repeal the DPR Act and replace it with a new Act (DRM Law 2023) to align the law with developments in the area of disaster preparedness, risk reduction, and response and recovery [7]. While the Bill (now the new DRM Act 2023) has incorporated issues of risk reduction that were missing in the DPR Act, the process of disaster risk management policy formulation would still be attributed as a “centric symbol of disaster enterprise”. This is because the first Act was formulated after the Phalombe flood disaster 1991, and this new bill (now DRM Act) has been influenced by the 2023 floods induced by TCF. Yet stakeholders and experts called for this Act to be operational for a long time. Therefore, this study through FFA, is setting a proactive pace in which future Disaster Risk Management (DRM) policies and Acts must be formulated.
Flood frequency analysis
FFA through spatiotemporal analysis is an appropriate method of assessing flood risk. It studies past flood events and finds the frequency and probability of flood events for a particular area [25]. As such increase in flooding events necessitates the application of FFA to understand the spatiotemporal behavior of the catchments to determine household flood vulnerability. FFA provides better practices for flood prevention, protection, and mitigation [26]. It assists in designing hydraulic structures and estimation of flood hazards [27]. It is also important for evaluating design flows in ungauged basins, and can complement existing time series in gauged sites and transfer them to ungauged catchments [28]. FFA can be done through statistical analysis from data obtained on stream discharge at a gauged station for a specific period [29]. The analysis of this data is subjected to different techniques such as Geographic Information System (GIS), Soli and Water Assessment Tool (SWAT) [26]. Various studies that have conducted flood frequency analysis exist in the literature [26,28,30]. However, most of them have used specific single data or analysis. One example of this is a spatial-temporal study done on flooding in Shanghai [31]. The researchers used data from 251 to 2000, and it was event-based data. Another example is a study on the drainage basin of the Pinios River in Thessaly, Greece. This study also used historical flood events as the basis for their research. Machado et al., also used historical data in their research to analyze flood frequency [28].
Ngongondo et al., carried out a study on an evaluation of the integrated impacts of climate and land use change on the river regime in the Wamkulumadzi river basin in Malawi [30]. This study assessed how the CC and LUC affect the flow regime of Wamkulumadzi. The study used both remotely sensed imagery using a supervised image classification system and the Soil Water Assessment Tool (SWAT). The study used images from 1984 to 2015 as part of understanding land use changes and gauged data on the same years to understand the hydro climatology. The results of the supervised classification of Landsat images from the years 1989, 1999, and 2015 demonstrated a lot of land use changes in the Wamkulumadzi catchment. The results showed that agricultural land had covered 30.66% in 1989 but had decreased to 7.62% in 1999 before increasing to 15.14% [30]. It further revealed that urban areas increased rapidly between 1989 and 1999 followed by a slight decrease in 2015 [30]. What is not clear in this analysis is whether the changes in land use are due to flooding. The paper attributes the main cause of this change to rapid population growth. However, the paper did not highlight any influence of the floods on land use change and other human displacement within the area.
To fill the gap in the aforementioned studies, this study focused on understanding the spatiotemporal flood vulnerability in the Lufilya and Lingadzi catchments using baseline gauge hazard data, and field survey data, collected by GPS receivers from the catchments. The use of field survey (location points) collected in the catchments provided a good visualization of what exactly is happening in the context of flooding in the area of study rather than depending on image satellites and existing hydroclimatology data which may give results of some parameters based on assumptions. Relatedly, the above studies did not link properly how flood trends impact people surrounding the catchment. This means that there is limited knowledge to realize from the study in terms of the mitigation and preparedness strategies that authorities can take to assist people surrounding the catchments. Noting this gap, this study therefore used GPS to collect the coordinates of the catchments. This was to ensure that recent and updated information was collected to profile the river catchments to see the changes that have occurred on a spatiotemporal scale [32]. Hence, this study quantified the land gained/lost through floods in the catchments of the studied area. Further, this study predicted future profiles or trends of the river regimes. In this case, the study provides a tool for flood warning in terms of evacuation and relocation. Finally, this study provides a basis for understanding the amount of harvests that people in the area lose through floods because of the loss of agricultural land as well as the amount of land lost for settlement with time. Further to this, the study conducted flood frequency analysis using return periods, flow rate, runoff, and precipitation from the river catchments to show the flood risks in the catchments.
Introduction
To undertake FFA to determine the spatiotemporal characteristics for comparing household flood vulnerability in rural and urban informal settlements, three assessments were conducted namely, Hydrological Assessment (HA), GIS and field survey, and remote sensing.
Study
This study was carried out in Karonga District and Lilongwe City in the central and northern regions of Malawi respectively. The target catchments were the Lufilya and Lingadzi rivers in KD and LC respectively as shown in Figure 1. The target population was the households in Group Village Headman Matani Mwakasangila of T/A Kilupula in KD and Mtandire Ward, Senior Chief Chigoneka in LC as shown in Figure 2.
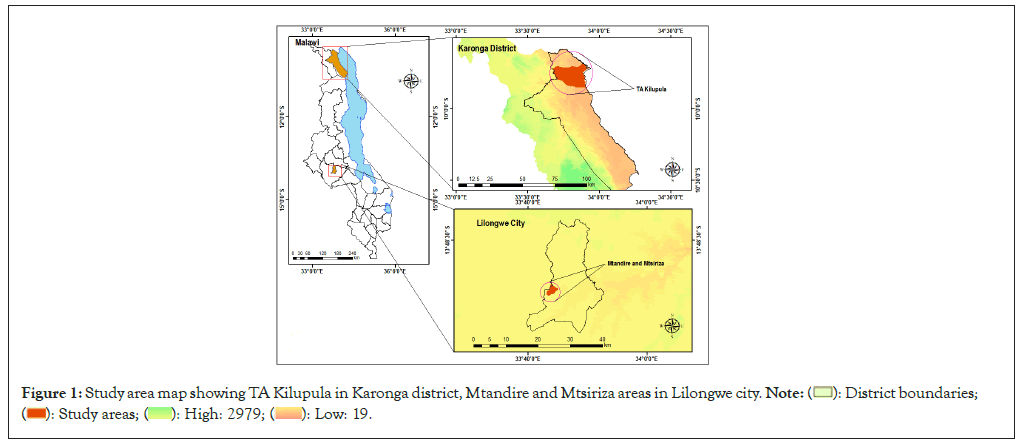
Figure 1: Study area map showing TA Kilupula in Karonga district, Mtandire and Mtsiriza areas in Lilongwe city. 

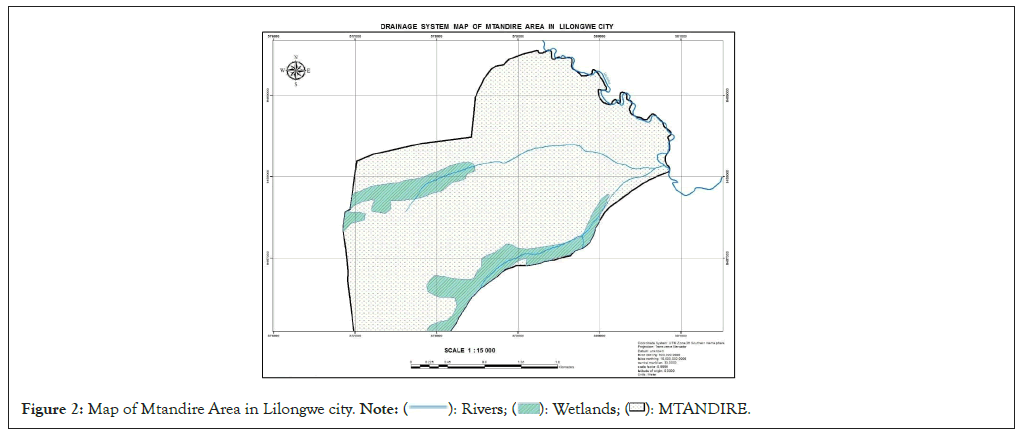
Figure 2: Map of Mtandire Area in Lilongwe city. 
Karonga district: This study targeted Group Village Headmen (GVH) Mwakasangila in T/A Kilupula of the Northern part of Karonga district. Though flooding is not limited to a particular geographic area, the areas hardest hit by floods in KD include those of T/A Kilupula and Paramount Chief Kyungu [24]. Karonga town is also the hardest hit by flooding in the jurisdiction of Paramount Kyungu [33]. However, this study considered T/A Kilupula because of its historical background in terms of flood occurrence which provided a good comparison between a rural area and an urban informal settlement. The fact that the definition of what is rural depends on perception, this study defined the area as rural, based on the district council classification system. As such in this study, “rural” means an area that by geographical demarcation has been administratively designated as a rural area and looks upon the district council/authority to provide the needed resources and support to the citizenry. On the contrary, an urban area looks upon the city council/authority to get the needed resources and support.
Karonga district, in particular T/A Kilupula, has a wide range of river networks. This means that the swelling of rivers due to heavy rains has devastating effects on the livelihoods of the people living close by. The trend of floods from 1974 to 1992 shows that T/A Kilupula experienced much flooding as shown in Figure 3.
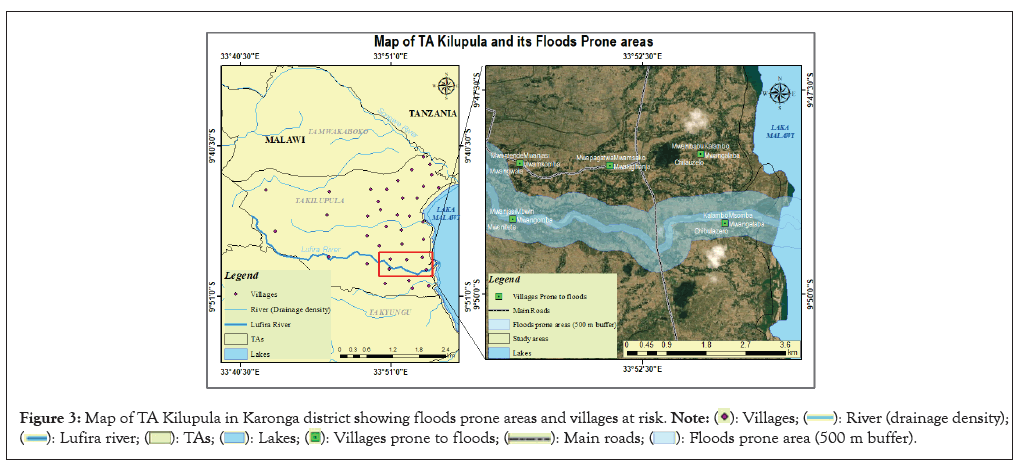
Figure 3: Map of TA Kilupula in Karonga district showing floods prone areas and villages at risk. 

The area of GVH Matani Mwakasangila is found in T/A Kilupula located about 16 km north of Karonga town. GVH Matani Mwakasangila has five Village Headmen (VH) namely Eliya Mwakasangila, Matani Mwakasangila, Chipamila, Shalisoni Mwakasangila and Fundi Hamisi. The greater part of the area-Eliya Mwakasangila, Chipamila, and Matani Mwakasangila, is bounded by Lake Malawi to the eastern side and the M1 road-Songwe-Tanzania border to the Western side. The other two villages Shalisoni Mwakasangila and Fundi Hamisi are to the Western side of the M1 road. The area has numerous networks of rivers such as Lufilya, Kasisi, Fwira, Ntchowo, and Kasoba. The area has two primary schools (Maro and Ntchowo) and one health post at Miyombo in VH Fundi Hamisi. The main hospital for the area is Kaporo Rural Hospital located at latitude (0595943) and longitude (8920187) in GVH Gweleweta. Serious cases are referred from Kaporo Rural Hospital (KRH) to Karonga District Hospital (KDH), which is the referral hospital in the district. The area has no flood evacuation centre such that during floods, victims are forced to camp in classroom blocks and sometimes others temporarily stay on the main road and churches.
Lilongwe city: This research study was carried out in the Mtandire ward (area 56). This area was selected because it is an informal settlement. Being an informal settlement, it possesses multiple existing vulnerability conditions that have the potential to put households at risk of flood hazards risks as shown in Figure 4.
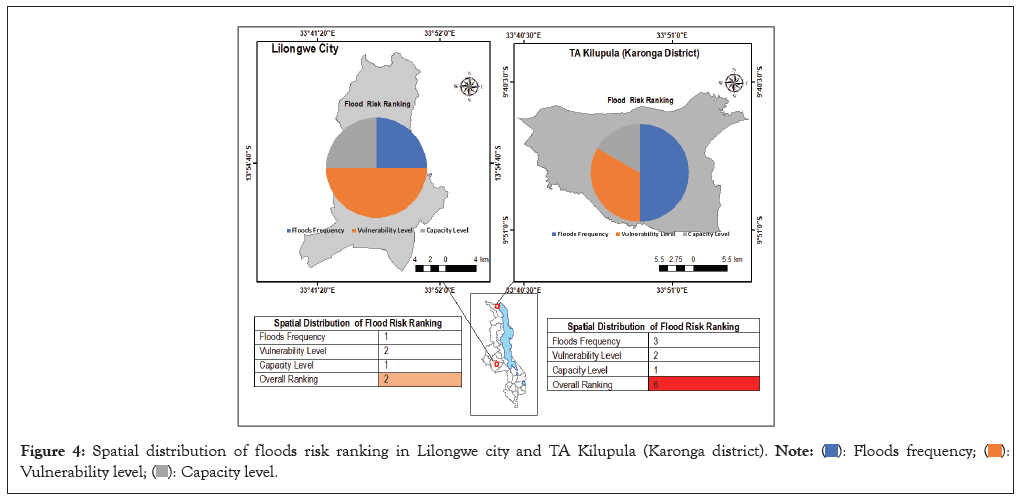
Figure 4: Spatial distribution of floods risk ranking in Lilongwe city and TA Kilupula (Karonga district). 

Mtandire Ward in Lilongwe City was chosen because it is an informal settlement. Therefore, this study targeted households in Senior Chief (SC) Chigoneka of Mtandire Ward. The area of SC Chigoneka is bounded by the Lingadzi drainage system as shown in Figure 2. This river system is prone to flooding, making the residents susceptible to disasters.
Data collection
Hydrological assessment: Hydrological assessment to analyze household flood vulnerability used baseline hydrological and disaster profile data. Hydrological data was collected from the Department of Water Resources in the Ministry of Water and Sanitation from 1980 to 2006 (Lingadzi River) in LC and 1980-2006 (Lufilya River) in KD. The data that was collected included annual water flow rate, annual discharge, and annual precipitation from the gauging stations of Lingadzi and Lufilya Rivers. The collected data was used to work out the return period, annual peak discharge, expected floods, probabilities of flood occurrences, and trends in the hydrologic parameters such as annual precipitation, flow rate, and run-off. Kissi et al., state that insights into flood frequency are provided by the return period analysis [34]. Disaster profile data was used to determine flood risk ranking. This was carried out to determine the vulnerability and capacity of households to floods. The ranking was done based on flood frequency using baseline data from 1934-2021. This baseline data was collected from the Department of Disaster Management Affairs (DODMA) in the Ministry of Natural Resources.
Geographical Information System (GIS) and remote sensing: Geographical Information Systems (GIS) provide powerful tools for dealing with space data. They are very effective for archiving, displaying, analyzing, and modeling geographic data. These tools are useful for supporting decision-making processes [35]. GIS analysis can be used for modeling the magnitude of flood risk areas with rainfall, elevation and slope, drainage network and density, land use, land cover, and soil types [36]. The technique can help to build strong preparedness and mitigation measures during flood events, and pre and post-stage hazard control.
Realizing this significance, this study collected spatial data using Geographic Positioning (GPS) from the Lingadzi and Lufilya catchments. 21 location points, 9 from Lingadzi and 13 from Lufilya were collected using a GPS receiver. The use of the Digital Elevation Model (DEM) in ArchGIS with Geospatial Stream Model Extensions such as HEC GeoHMS provides a powerful strategy for flood mapping as well as river profiles. However, this study used GPS receivers to collect information relating to profiles of Lingadzi and Lufilya rivers within their catchments to show evidence of flooding for vulnerability prediction. The spatial data (coordinates) were collected at each point of the river meander. The difference between selected location points in Lufilya and Lingadzi was based on the size of the distance covered by the households that were selected during the survey. In addition, the chairperson of the Village Civil Protection Committee (VCPC) and Ward Civil Protection Committee (WCPC) helped to locate the profiles where the river was passing by in the past years as shown in Table 1. Furthermore, observation was used to crosscheck the profiles of the river to collect coordinates in the proper location for analysis and interpretation. Google Earth was used to download the base map image (OpenStreetMap) of the old profiles of Lingadzi and Lufilya rivers. The image used was a baseline polyline of the rivers. From the polyline image, coordinates were collected in all the profiles that were created by the flooding events.
| Point target | Selection method | Data source | Data collection tool |
|---|---|---|---|
| River meander | Transect walk | Field survey | GPS |
| VCPC guides | OpenStreetMap | - | |
| Profile of a river | - | - |
Table 1: Sample matrix used to collect location points.
A remote sensing technique was used to understand the catchment morphology of the Lufilya and Lingadzi rivers. The technique involved using datasets like Landsat images, administrative boundaries for Malawi, and other shapefiles, in particular, rivers. 30 m spatial resolution satellite images of the study were obtained from USGS Earth Explorer under Landsat Collection 1 Level 1 archive. The USGS provides some satellite image archives free of charge ranging from the 1970s to the present [37]. The vector shapefiles of the study area were downloaded from the MASDAP website and the pen-source website respectively. The method involved the use of supervised image classification. The satellite images downloaded were from the same season of the year and with the same spatial resolution for the study periods 1990, 2006, and 2021. Thus, images ranging from September to November were obtained for the reason that a couple of images from this period had little or no clouds. The images were extracted to Tiff formats for processing and the details of image properties were acquired as shown in Table 2 and Figure 3.
| Year | Satellite | Acquisition date (yyyy, mm, dd) |
Path/row | Spatial resolution | Study extent/subset |
|---|---|---|---|---|---|
| 1990 | Landsat 5 TM | 1990-10-06 | 169/067 | 30 m | TA Kilupula |
| Landsat 5 TM | 1990-10-15 | 168/070 | 30 m | Mtandire ward | |
| 2006 | Landsat 5 TM | 2006-09-16 | 169/067 | 30 m | TA Kilupula |
| Landsat 5 TM | 2006-08-24 | 168/070 | 30 m | Mtandire ward | |
| 2021 | Landsat 8 OLI | 2021-11-12 | 169/067 | 30 m | TA Kilupula |
| Landsat 8 OLI | 2021-10-04 | 168/070 | 30 m | Mtandire ward |
Table 2: Utilised metadata of the satellite images.
Data analysis: Flood estimation provides better practices for flood prevention, protection, and mitigation [27]. It can be useful for designing hydraulic structures and estimating the magnitude of possible future floods (flood design) [30]. Therefore, applying modern methods to establish and estimate floods has been recommended as a practical solution to estimate floods [26,28,29].
Hydrological data: Rainfall analysis in the catchments of Lufilya and Lingadzi was performed using Excel to determine descriptive statistical values of mean, maximum, minimum, and median in the category of averaged annual precipitation, flow rate, and run-off for the period of 1980-2006 in both catchments (Lufilya and Lingadzi). The determination of higher or lower precipitation and flow rate was based on the Modified Fournier index (MFI), which expresses the sum of the average monthly rainfall aggressiveness index at a location. The MFI uses the scale of low to high rainfall aggressiveness in the catchment as follows: <100, moderate aggressiveness: 100–300, high aggressiveness: 300–400, and very high aggressiveness: >400. Therefore, this study checked the averaged summation of precipitation, flow rate, and run-off to determine the catchment with higher rainfall aggressiveness. Run-off was calculated based on the Curve Number Method (CNM). The CNM is based on the recharge capacity of the watershed. The recharge capacity is determined by antecedent moisture conditions and by the physical characteristics of the watershed.
FFA was used to determine flood vulnerability trends for Lingadzi and Lufilya catchments in LC and KD. FFA was done using the Gumbel statistical distribution test [38]. The test is used to obtain flood return periods, discharge, and exceedance probability [39,40]. The test is further used to obtain the mean, variance, standard deviation, probability (percentage), and discharge [41,42]. Similarly, this study used the test to calculate return periods employing 2, 5, 10, 25, 50, 100, and 500 years to forecast expected floods in LC and KD using Lufilya and Lingadzi river catchments. Machado et al., stressed that FFA improves the estimates of the probabilities of rare floods by using interval return periods [28]. Though literature presents varied methods of undertaking FFA Jian et al., this study applied the statistical methods using the Gumbel statistical distribution model [26-28,38].
In Gumbel statistical distribution, the calculation of return periods (T) corresponding to the exceedance probability is calculated as follows [38]:

Where, T=return period (years) and P= exceedance Probability
Samantaray et al., further highlight that predicted discharge ( Qn ) in the Gumbel method is calculated with a standard normal distribution formula for different return periods expressed as [38]:

Where, Qp = Predicted discharge, μ = standard mean ϕ = standard deviation
Furthermore, the exceedance probability ( qi ), probability was evaluated in percentage using the Gringorten plotting position formula:

Where, qi = Exceedance probability association with a specific observation
N Number of annual maxima observations (in this case 37 for Lingadzi catchment and 35 for Lufilya catchment)
i = Rank of specific observation with i = 1 being the largest to i = N being the smallest.
a = constant for estimation=0.44 using Gringorten’s method.
This study used Microsoft Excel to determine the return period, exceedance probability, and discharge by applying the Gumbel statistical formulas mentioned above. Furthermore, excel was used to draw tables and graphs that showed the expected floods, exceedance probabilities, and discharge. Also, graphs of flood trends for discharge (Q), flood peaks, and return periods for specific years (1980-2006) in Lingadzi catchment and (1980-2006) in Lufilya catchment were plotted in Microsoft Excel. According to Machado et al., the use of long historical records is an important source of information about extreme events [28]. It establishes a reliable flood return frequency [28]. The correlation was observed between monthly discharges. Salgueiro et al., propose that a strong correlation (r) should be observed between negative monthly NAO index and flood discharges above 400 m3s-1 [43]. Finally, graphs for annual average precipitation, flow rate, and run-off were plotted for Lingadzi and Lufilya catchments. All these helped to determine the nature of floods to predict flood vulnerability in the studied areas.
Flood risk ranking: The hazard (flood) exposure to the assessed areas was ranked based on the adopted and modified scale of Hing et al., of less frequent (1), frequent (2), and more frequent (3) [44]. A less frequent flood was determined with a frequency of less than 10 times in terms of occurrence in the area. A frequent flood was determined with a frequency of ≥ 10 ≤ 30 in terms of occurrence. A more frequent flood was determined with a frequency of ≥ 30 times. All the ranges were determined at the time interval of 10 years for the baseline data collected from DoDMA. Then, the final determination was interpreted as 1-2.9 (low flood risk) 3-5.9 (medium flood risk), and 6-9 (high flood risk) in the categories of less frequent, frequent, and more frequent.
GIS field data: GIS field spatial data of location points collected from the Lingadzi and Lufilya catchments as shown in Table 3, focused on the analysis of river profiling (Lingadzi and Lufilya), land use change due to floods and changes in settlement patterns due to floods. All these were determined using GIS Desktop 10.8 as outlined in Table 3. GIS helped to model hydrological parameters such as river morphology, incWahabg properties such as distance of households from rivers, stream profiling, and loss of land due to floods.
| Point target | Data | Analysis focus | Data source | Analysis tool |
|---|---|---|---|---|
| River Meander | Spatio | Catchment profiling | Field survey (GPS) | GIS desktop 10.8 |
| Land patterns in the catchment | ||||
| Flooding and changing settlement patterns |
Table 3: Analysis matrix of GIS field survey for Lingadzi and Lufilya river catchments.
The spatial data was entered in Arch GIS desktop 10.8 to create a Geodatabase using the Arch catalog. Then tables were created for the entered data. The database contained four tables and four profiles for the Lufilya catchment and two tables and two profiles for the Lingadzi catchment. Then data from the database was displayed using Arch Map as points. The points were converted from polylines. Later on, the polylines were converted into line features using geoprocessing features. This process was followed by the displaying of the base map (open street map) to check if the points landed in the actual location of the catchments from which they were obtained. Using this base map (open street map) satellite image, all the points were digitized. Then the geoprocessing tasks like area of profiles, distances of households to the river profiles (both current and old profiles), land gained or lost, and extent of settlement displacement were calculated. The significance of knowing these parameters is that they can inform flood responders to plan for relocation in terms of the available land that people need to get where they are being relocated [44]. Furthermore, it assists in checking the amount of land that people lose from floods, thereby providing insights into the amount of yields that are lost in the process.
Under supervised image classification, training samples, also known as Areas of Interest (ROIs), were gathered for each image, followed by post-classification smoothing methods to provide accurate and precise land cover maps for the research periods. The land cover classes used for supervised classification are summarized in Table 4.
| Land cover class | Description |
|---|---|
| Built-up area | Consists of urban, industrial, commercial, and transport units, dump, and construction sites |
| Bare land | Open spaces with little or no vegetation, beaches, dunes sands, bare rocks, sparsely vegetated areas |
| Vegetation | Forests, shrubs and herbaceous vegetation association, arable land, permanent crops, pastures, and heterogeneous agricultural areas |
| Water bodies | Watercourses, dam areas |
Table 4: Land cover classes and its description.
Study limitations
Largely, this study provides comprehensive metrics that can be applied to mitigate flood risks and support the decision-making process in rural and urban informal settlements. These metrics can also be used by future researchers to replicate vulnerability assessments at all levels in the country. However, the lack of current data on flow rate, precipitation, and run-off from the Water department, meant that the study used old baseline water resources data between 1984-2006 in Lilongwe City and 1984-2006 in Karonga District. Despite this challenge, the data was justified to meet the purpose of this study because the intention was to show evidence of flood trends in the area so that household flood vulnerability could be predicted. Disaster profile data collected from DoDMA complimented this flow rate and precipitation data to show evidence of flooding.
Hydrological regime assessment
The hydrological assessment was performed at two levels. The first level involved rainfall analysis in the catchments using basic descriptive statistics. The second level used flood frequency analysis through return periods and exceedance probability.
Rainfall analysis in the catchments: The results in Tables 5-7, show that the sum of annual precipitations, flow rates, and run-off are on the scale of “very high aggressiveness”>400 in both catchments. However, the results are very much higher for the Lufilya catchment compared to the Lingadzi catchment. The results indicate that the Lufilya catchment receives a higher amount of water compared to the Lingadzi catchment.
| Statistic category | Precipitation (mm) | Flow rate (cumecs) | Run-off (mm) |
|---|---|---|---|
| Sum | 2549.31 | 6660.84 | 4698.27 |
| Mean | 98.05 | 256.17 | 180.72 |
| Maximum | 182.35 | 475.95 | 337.55 |
| Minimum | 32.29 | 84.25 | 59,75 |
| Median | 86.07 | 256.17 | 159.05 |
Table 5: Basic statistics of precipitation, flow rate, and run-off for Lufilya (1980-2006).
| Statistic category | Precipitation (mm) | Flow rate (Cumecs) | Run-off (mm) |
|---|---|---|---|
| Sum | 940.24 | 2252.32 | 2478.49 |
| Mean | 36.16 | 86.63 | 95.33 |
| Maximum | 110.87 | 284.65 | 306.73 |
| Minimum | 2.43 | 6.38 | 6.87 |
| Median | 38.87 | 90.66 | 100.07 |
Table 6: Basic statistics of precipitation, flow rate, and run-off for Lingadzi (1970-2006).
| Category | Flood peak of Lingadzi Catchment (LC): (1970-2006) | Flood peak Lufilya catchment (KD): (1980-2006) |
|---|---|---|
| Mean | -73.67 | -189.32 |
| Standard deviation | -36.68 | -127.09 |
| Discharge (Q (cumecs)) of Lingadzi | Discharge (Q(cumecs)) of Lufilya | |
| Minimum | 11.8 (2001) | 26.9 (1992) |
| Maximum | 166.0 (1970) | 480 (1984) |
Table 7: Hydrological assessment for Lingadzi and Lufilya catchments.
The results show that Q for both rivers increased during the years 1970 and 1984 for the Lingadzi and Lufilya catchments in LC and KD respectively. In terms of flood peak, Lufilya has both a higher mean and standard deviation compared to Lingadzi River. The results demonstrate that the catchment of Lufilya receives higher water compared to the catchment of Lingadzi which eventually contributes to higher flood peak.
Flood frequency analysis: The results show the trend of a higher return period (T in years) corresponding to higher expected flood floods (Cumecs/s) for the Lingadzi river catchment of LC as shown in Figure 5a. The results indicate that at a return period of 500 years, the expected flood is at 825.24 cumecs/s while at a return period of 2 years, the expected flood is 169.69 cumecs/s as shown in Figures 5b. The results further show that the higher the return period, the lower the probability for the flood to occur in the catchment as shown in Figure 5b. The result revealed that at a return period of 500 years, the exceedance probability for the flood to occur is 0.2% and vice versa. The results show the trend of a higher return period (T in years) corresponding to higher expected flood floods in the Lufilya catchment of KD as shown in Figure 5c. At the return period of 500 years, the expected flood is at 258.64 cumecs/s while at the return period of 2 years, the expected flood is 67.97 cumecs/s as shown in Figures 5d. The results further show that the higher the return period, the lower the exceedance probability for the flood to occur in the catchment as shown in Figure 5d. The probability of flood occurrence is higher at a return period of 2 years (50%) while lower at a return period of 500 years (0.2%) as shown in Figure 5d. However, the results in Figures 5a and 5c, show that the Lingadzi River catchment has higher expected floods for all the return periods compared to the Lufilya River catchment. The results show that a return period of 5 years has an expected flood of 296.77 m3/s for the Lingadzi River catchment greater than the expected flood of 258.64 m3/s for a return period of 500 years for the Lufilya River catchment.
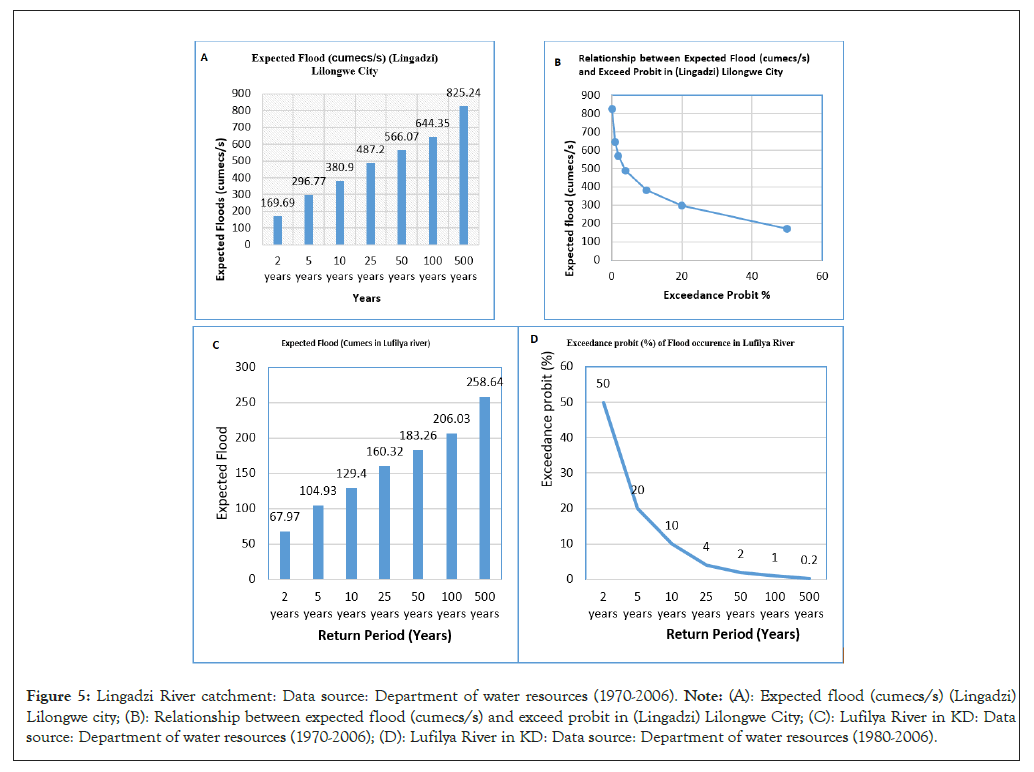
Figure 5: Lingadzi River catchment: Data source: Department of water resources (1970-2006). Note: (A): Expected flood (cumecs/s) (Lingadzi) Lilongwe city; (B): Relationship between expected flood (cumecs/s) and exceed probit in (Lingadzi) Lilongwe City; (C): Lufilya River in KD: Data source: Department of water resources (1970-2006); (D): Lufilya River in KD: Data source: Department of water resources (1980-2006).
Hydrological regime trends for Lingadzi and Lufilya river catchments: The results in Table 8, further show that the trends in terms of the relationship between discharges (Q), return period (T), and flooding peak are decreasing (1980 to 2006) for the Lingadzi catchment. The results also show that (T) was very low in 2006 compared to 1980. This result depicts that there is more likelihood for floods to occur in recent times compared to past years (1980s). The results in Table 8, further show that discharge (Q) increased from 1980 to 2006, flooding peak and return period decreased between the same years in the Lufilya River catchment. The results also show that T was very low in 2006 compared to 1980. This result depicts that there is more likelihood for floods to occur in recent times compared to past years (1980s). The results in Tables 8, reveal that there is no difference in the livelihood of flood occurrence during the selected years in the Lingadzi and Lufilya river catchment. However, the Lingadzi River catchment experienced higher Q and flood peaks compared to the Lufilya River catchment.
| Year | Qmax (cumecs) | Flooding peak | Return period (T) |
|---|---|---|---|
| Lingadzi catchment | |||
| 1980 | 480 | 480 | 38 |
| 1981 | 164 | 442 | 19 |
| 1982 | 185 | 434 | 12.7 |
| 1983 | 320 | 409 | 9.5 |
| 2006 | 71 | 11.8 | 1 |
| Lufilya catchment | |||
| 1980 | 41.6 | 166 | 38 |
| 1981 | 44 | 153.4 | 19 |
| 1982 | 127 | 127 | 12.7 |
| 1983 | 166 | 112.9 | 7.6 |
| 2006 | 61.3 | 27 | 1.4 |
Table 8: Flood trends in Lingadzi and Lufilya catchment.
The result shows that the discharge of Lingadzi and Lufilya river catchment is very high with a value of R2 = 0.9694 for Lingadzi river catchment in LC and R2 = 0.992 for Lufilya river catchment in KD. The results further show that the Lingadzi River catchment recorded a higher APD from 1970-1988 with high flood peaks (1970-1992) as shown in Figures 5a and 5b. These results also show the corresponding decrease in annual precipitation as shown in Figure 6a, annual flow rate, and annual run-off. However, in the Lufilya River catchment, the results show high flood peaks from 1980-1986 with a high Q around 1982, 1984, 1989-2000 and 2003 as shown in Figure 6b. The results further show that run-off and flow rates increase and decrease based on the trends of precipitation in the catchment areas as shown in Figures 6a and 6b.
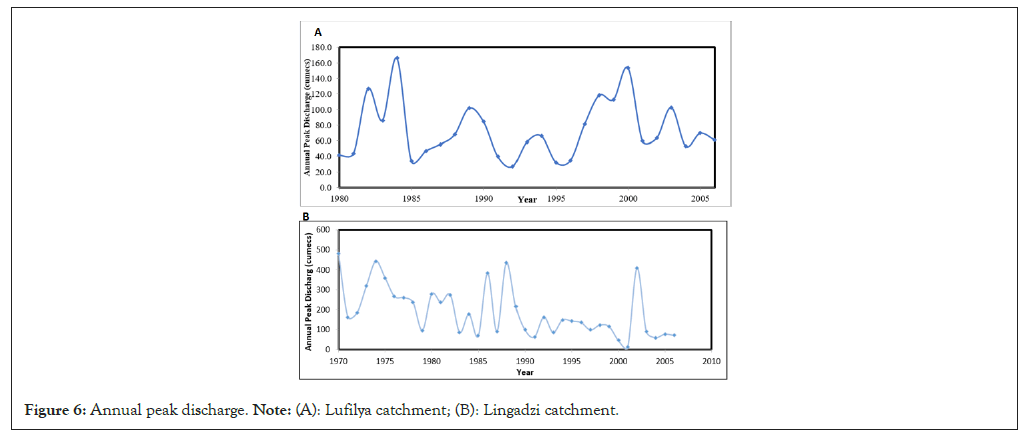
Figure 6: Annual peak discharge. Note: (A): Lufilya catchment; (B): Lingadzi catchment.
The results revealed that in the 10-year interval (1992-2001) Lilongwe City and Karonga district experienced flooding 20 and 31 times respectively. The result further revealed that between 2012-2021, Karonga district continued to experience more flooding events compared to Lilongwe City as shown in Figure 7. The results of the probability of flood risk in T/A Kilupula of KD in the category of high (6) compared to Mtandire ward of LC in the category of low (2) as shown in Figure 4.
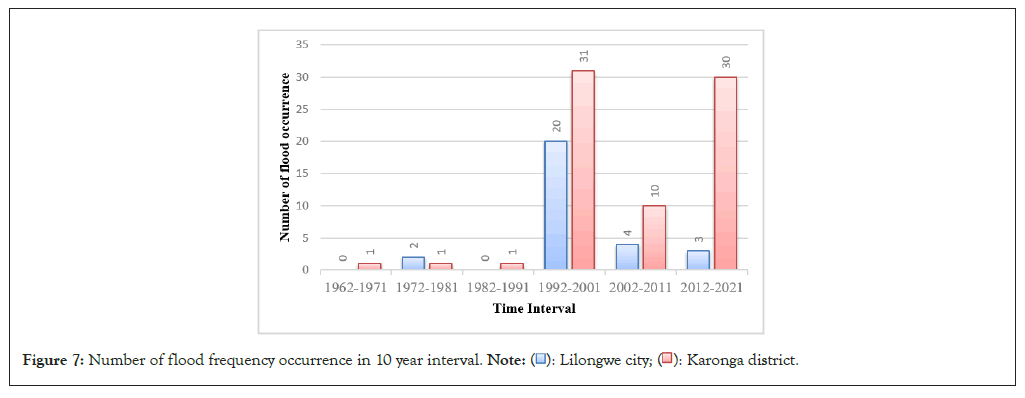
Figure 7: Number of flood frequency occurrence in 10 year interval. 
Morphology and land patterns in the Lufilya and Lingadzi River catchments
Catchment morphology of Lufilya and Lingadzi River: The results show that the profile of the Lufilya River catchment is not homogenous. Its channel is widened and has changed its direction into several river courses. The results show that the catchment has developed four profiles (channels) as shown in Figure 8, deviating from the original river profiles which were depicted by the based map of the “image satellite” (Profile 1). The results show that the river has changed its shape from the old profile portrayed by the satellite. The results further show that there is no main channel to direct proper water flow in the river.
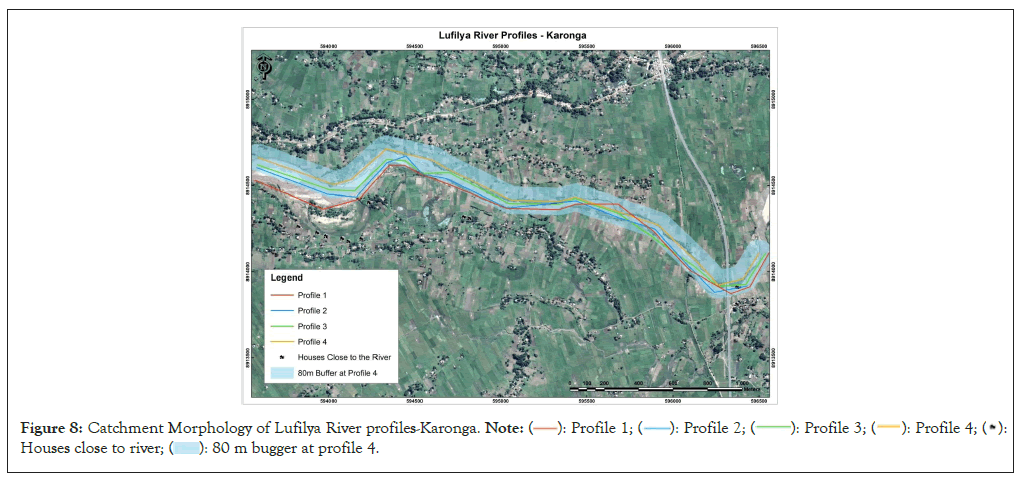
Figure 8: Catchment Morphology of Lufilya River profiles-Karonga. 

However, the morphology of the Lingadzi River catchment has maintained its channel with some minor modifications from the original points as depicted in the satellite image as shown in Figure 9a. In flood hazard assessment, key informants attributed the intense causes of catchment change to human settlements, brick making, and sand extraction. A member of the WCPC alluded that youths in Mtandire ward have nothing to do and thereby have resorted to brick-making and sand mining in the river.
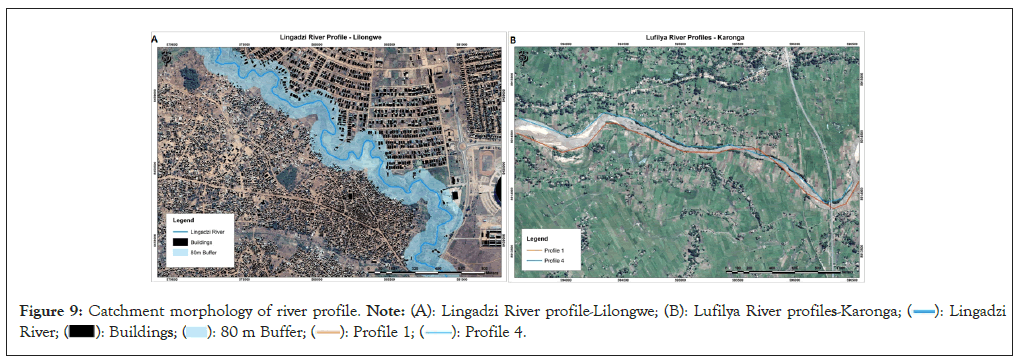
Figure 9: Catchment morphology of river profile. Note: (A): Lingadzi River profile-Lilongwe; (B): Lufilya River profiles-Karonga; 

Flooding and the changing land and settlement patterns: The geospatial analysis determined the area of the land that was available between the households and the image satellite of the Lufilya River before the river began changing from profile 4 (original channel) and profile 1 as shown in Figure 9b. The results show that about 0.920970 km2 or 920,970.180 m2 of land area was available before flooding events changed the profile of the Lufilya River in KD. The results also show that households’ settlements which were very far from the image satellite of the Lufilya River are now very close to the river as shown in Figure 9b. This was observed to be one of the main causes of households’ vulnerability to floods. The results further revealed that the changing river profile due to the flooding regime has contributed to the reduction of agricultural land where people used to cultivate maize, groundnuts, and pigeon peas. The calculated results show the available land of about 0.534148 km2 as shown in Figure 9b. The results revealed the loss of land due to flooding of about 0.386822 km2 (0.920970 km2-0.534148 km2). The results further revealed a distance of 84.64 m between profiles 1 and 4. This distance is an indication that the land that households use for other activities is being depleted thereby making people landless.
The results of the digitized flood maps overlayed with surveyed households’ showed that most houses that are highly vulnerable to floods are between a distance of 0.06-0.12 km to Lingadzi river in Mtandire ward of LC as shown in Figure 10, and 0.198 km to 0.317 km along the buffer zones of Lufilya river in T/A Kilupula of KD as shown in Figure 3.
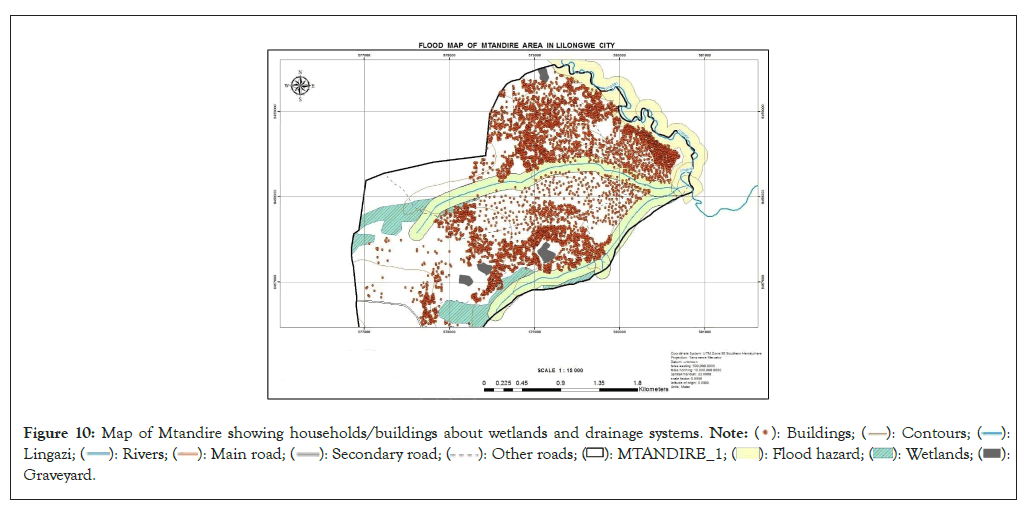
Figure 10: Map of Mtandire showing households/buildings about wetlands and drainage systems. 


Land Use Land Cover (LULC) classification: In Mtandire ward, the results show a total bare land loss of 32 km2 from 1990 to 2021 (representing 16% land loss) and 21 km2 from 1990 to 2006 (representing 11% land loss). The results of this trend indicate that between 2006 and 2021, bare land was lost by 11 km2 representing 5%. The results further show that the built-up area is gaining an area of 21 km2 in 2021 from 129 km2 in 1990. The results show that the area is losing vegetation by 10 km2 from 1990 to 2021. Finally, the results show water losing an area of land coverage by 10 km2 from 1990 to 2021 as shown in Figure 11a.
While in GVH Mwakasangila in T/A Kilupula, the results show a total bare land loss of 46 km2 from 1990 to 2021 (representing 20% land loss) and 35 km2 from 1990 to 2006 (representing 15% land loss). The results of this trend indicate that between 2006 and 2021, bare land was lost by 11 km2 representing 5%. The results further show that the built-up area is gaining an area of 45 km2 in 2021 from 24 km2 in 1990. The results show that the area is losing vegetation by 81 km2 from 1990 to 2021. Finally, the results show water gained an area of land coverage by 2 km2 from 1990 to 2021 as shown in Figure 11b.
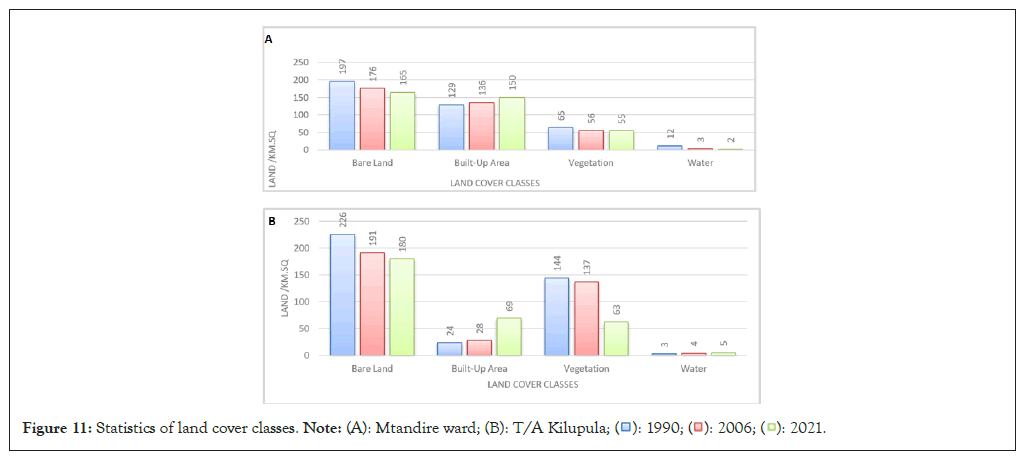
Figure 11: Statistics of land cover classes. 
The results revealed that there is a gain and loss of land in the studied areas. While the results showed that bare land, built-up areas, and areas covered by water and vegetation are being lost (decreasing) in LC, only areas covered by water in KD are gained (increasing), but the rest are decreasing. Significantly, the changes in the catchment of the Lufilya River in KD have resulted in the loss of household land. The total land area that was available to the households before the river changed its course was 0.920970 km2 (about 920,970.180 m2). The morphological changes of the river into different profiles covering a land area of 0.534148 km2 have resulted in a land reduction of about 0.386822 km2. This land was largely used for agriculture and partly for human settlement. The loss of this land means that people in the area are seriously affected in terms of food production and income levels since most of them depend on agriculture as a source of food and income. This is an indication that flooding is a pre-condition to famine disasters due to its impact on food security and low agricultural production. In the same manner, the loss in the food supply has an impact on the country’s Gross Domestic Product (GDP) and Gross national product (GNP) since agriculture is the main source of Malawi’s economy [45]. The findings of this study concur with the findings of Nazeer et al., which revealed that changes in river morphology strongly pose a disadvantage to conditions for people who rely on agriculture. The consequent result of this is that most households tend to live in absolute poverty [46].
The use of spatial-temporal data to understand floods trends provides an important element in understanding households’ vulnerability to a particular hazard [28]. It helps to identify best disaster risk reduction initiatives aimed at reducing human vulnerability [27]. The process helps to establish technocentric solutions of flooding in river catchments, and thereby bringing innovations in flood catchment management [26]. It further helps practitioners to identify best policies that can be employed to reduce household vulnerability to flood risks [27]. This process can further assist communities to understand their own risks by providing visual representations of the changes that occur in their area due to flooding events. In so doing, decision makers and relevant stakeholders can utilize spatial- temporal data to identify and prioritize certain vulnerable areas and measures to mitigate existing vulnerabilities while preparing for future flood risk mitigation.
Hydrological assessment: The hydrological assessment reveals a high flood occurrence at a shorter return period (2 years) and vice versa in the Lufilya and Lingadzi catchments. The results also revealed that the Lingadzi river catchment has high expected floods compared to the Lufilya River catchment at different return periods while flood risk ranking is high in KD and low in LC. Households’ flood vulnerability in KD could be attributed to building close to the river due to changes in Lufilya river morphology. This finding concurs with Wahab et al., in which it was established that residents living close to the river were more vulnerable compared to those that live away from the river [47]. On the other hand, the high-expected flood from the Lingadzi basin at different return periods is an indication of the high likelihood for the floods to occur. This study attributes the high-expected floods in LC to, among other factors, rapid population growth caused by increased urbanization, sand extraction, brick making, and poor urban planning and development. These factors were also revealed by Ngongondo et al., who established that the flow regime of the Wamkulumadzi river basin in Malawi is affected by the rapid population growth and various land use changes in the catchment [30]. However, the results of Ngongondo et al., did not find issues of river morphology [30]. The difference could be because this study profiled the river using field data (coordinates) to determine the changes in time and space, while the previous study used secondary data [30]. The high flood peaks in both catchments indicate that the flow rate of the rivers has higher discharge (R2=0.994). In Lingadzi River, the high discharge can be attributed to increased human settlements along the catchment, which further contribute to short lag time thereby making the river flood. On the other hand, in Karonga (R2=0.9962), this could be attributed to poor agricultural practices, deforestation, and siltation of the catchment. These results are also consistent with the findings of da Silva et al,. in which they posit that urban drainage systems and poor zoning of urban settlements contribute to flood vulnerability [29]. Furthermore, poor land management practices, buffer zone degradation, deforestation, and depletion of marginal land are key to contributing to vulnerability in rural areas where the majority of the people depend on agriculture [29]. Villordon et al., confirm that living in or close to rivers increases households' vulnerability to floods [48]. Wahab et al., argue that the larger value of R2 indicates that the parameter under study is significant in explaining the variation of flood vulnerability [47]. However, despite the huge similarities of these findings, still, this study still argues that issues of river morphology about conditions of heterogeneous, homogeneous, lag time (short/long) and river profiling combined with existing household vulnerabilities have not been fully analyzed and linked in the understanding of households’ flood vulnerability in Malawi. Therefore, this gap has been filled in this study. As such, the study maintains that the use of real field data can provide a proactive and clear understanding of spatial and temporal flood characteristics in various river regimes and could be key for programming current and future flood risk reduction measures with clear informed knowledge at all levels.
Land Use and Land Cover (LULC): Land classification issues could be assumed as key factors making relocation problematic in T/A Kilupula and Malawi in general. For instance, many policy and decision makers incWahabg stakeholders as well as NGOs maintain that people in prone areas must relocate to safer places [49]. The question is it possible to relocate? Practically, not easy to yield tangible results. Despite the merit of relocation is that there is less upheaval in terms of activities and social relations, but, its setback is that there is no systematic movement of people [27]. The movement is centric of the people themselves, the government, and authorities’ resistance in the equation of the movement [49]. Kita also found that relocation/resettlement in Malawi is obscuring the key drivers of vulnerability while simultaneously exposing those left behind to further risks [50]. Therefore, this study maintains that relocation would be difficult in the event of not knowing the amount of land which is available for the households where they are told to relocate and the amount of land where they are supposed to relocate. Kita found that planning and execution of relocation are fraught with multiple challenges emanating from haphazard planning and lack of community participation [50]. Relatedly, Chawawa also found that smallholder farmers in Chikwawa and Blantyre districts in Malawi are not willing to relocate due to reasons such as land availability in the area they intend to settle [49]. People are just told to relocate without necessarily identifying the land where they need to relocate. In a few instances, where land is identified, the size of the land and other social services are not considered as a priority by the government and stakeholders initiating the relocation process. Furthermore, there is an oversight to know the productivity of the land the people had before, which would (would not) attract them to settle in the new areas. Therefore, the dynamic of land issues requires top prioritization in policy and decision-making processes to build on current and future flood risk reduction and mitigation strategies as well as respond to the requirements of the SFDRR (2015-2030). Chawawa also established that relocation is practically not possible in Malawi due to issues of land ownership because people are not ready to lose their land [49]. Similarly, various studies articulate that relocation is practically impossible due to a lack of willingness to settle, the level of participation to settle by those being resettled, and the size of land offered to households Kita [50]. In this case, this study highlights the significant need to undertake an evaluation of land dynamics and patterns as a critical component of providing insights to decision-makers and authorities on how the future programming of flood risk management strategies must be shaped and implemented.
Community myths and cultural beliefs: The cause of household’s vulnerability to floods in T/A Kilupula of KD is further heightened by community myths and cultural beliefs. It was noted that people hold the views that the morphological changes of Lufilya River are due to witchcraft. Indeed, change is gradual, but it can be controlled if appropriate and proper strategies are employed. However, due to cultural beliefs of witchcraft and myths, people have allowed Lufilya River in Karonga district to widen and change its channel and direction respectively now and again. In 2017-2018 season, the whole village turned against three males, “accusing” them of having bought traditional medicines locally called “nyanga” to widen the river course and change its directions. These three males were accused to have bought the traditional medicines to displace other people in the communities who lived along the river catchment. This situation became tense to the point that the Village Headman (VH) called for a community gathering to discuss the way forward on this matter. Then, a resolution at the chief’s council was made to identify and invite the “traditional doctor” to come and impound the said “nyanga” in the river at a cost of K200, 000 (equivalent to two cattle). Despite this effort, the river continued to increase in its channel and in 2018-2019, flooding from the said river rendered 250 households vulnerable and permanently displaced 60 households. This is a clear indication that decision-making of leaders in communities is often made under condition of limited information to hazardous events. As such these leaders must be strongly trained and engaged as key participants enterprises (actors) in the programming of current and future flood vulnerability mitigation and preparedness measures.
This is another clear indication that awareness on these flood events needs to be intensified. Nazeer et al., established that communities lack of awareness on flooding issues contribute to vulnerability because community tend to have limited strategies to deal with flood events [46]. Rana argues that lack of awareness, weak institutions, and poor infrastructure contribute to vulnerability because they make people have low information, low support and stay in substandard houses [32]. In KD, the witchcraft behavior is a clear indication that people lack awareness on floods and still look at hazards (like floods) as pure acts of nature. This could be due to lack of strong institutional support to promote awareness and sensitization on the understanding of hazards and disasters [45]. Other observed challenges impinging on the promotion of awareness could be limited staff in councils to undertake the awareness and sensitization exercises, lack of funding and negligence because of a culture of business-as-usual attitude. Unless, government take a full commitment to promote reasonable measures to guide Disaster Risk Reduction (DRR) and encourage participation of different enterprises in preparedness, mitigation and advocacy, then a full vulnerability reduction would be realized. Furthermore, this study has shown that the dynamics of beliefs and myths embedded in people’s culture contribute to increase vulnerability and therefore, these must be incorporated in the current and future flood risk awareness and communication strategies at all levels to minimize peoples’ vulnerabilities, especially those who lack knowledge on the occurrence and nature of flood hazards.
Human occupancy and land use planning: The results revealed that the risk of flood is accelerating due to human occupancy and land use planning. Particularly, the results showed that households’ vulnerability to floods in Mtandire ward of LC is due to construction of settlements along the Lingadzi catchment and land use activities such as sand extraction and brick making. These results are similar to the findings of Amrani et al., in Nador territory, Morocco in which the increased household’s vulnerability to flood risks was attributed to the development of human settlement in marshy and floodable zones [51-55]. The findings further agree with the study of Kita, in which building of settlements in high flood risk areas and poor construction practices are the cause of vulnerability experienced by the residents of Mzuzu city in Malawi [50]. Significantly, it was revealed that people especially those located in area 49 (New Gulliver) have constructed their houses and fences along the catchment areas of Lingadzi river. This condition has made the river to lose its marshes and swamps, which could control water flow. Furthermore, the activity has increase run-off due to the increase in concrete structures that reduce infiltration of water [56-60]. Therefore, due to low infiltration and that the houses are close to the river, it means that there is a shorter lag time. This short lag time implies that water from the building structures is flowing a short distance and increasing the volume of water in the Lingadzi River, thereby becoming more prone to flooding. This means that the river fails to contain the amount of water that enters into the catchment and thereby causing floods to Mtandire area [61-65]. It was observed during the interviews that people occupied land in area 49 which was allocated by the City Council (CC) through the Department of Lands (DL). What is worrisome in this is: what criteria did the CC use to distribute land to the inhabitants in the area? This question is not straightforward to be answered, because of land power dynamics [66-68]. Among other key factors that bring land governance problems include: Lack of full control over land by city councils, social political issues, local actors find it difficult to manage land, availability of local leaders in cities and democracy in terms of land use choices [50,69-73]. Therefore, this study portrays that land governance issues are fundamental factors influencing household flood vulnerability and are important for programming flood risk management strategies [74]. This study further shows that in the process of programming the flood risk reduction measures, officials must not make decisions and actions that violate the law, let alone increasing vulnerabilities of poor households [75].
The spatiotemporal characteristics depicting household flood vulnerability include increased volume of water in the channels due to short time lag resulting from sealing of land surface, loss of agricultural land due to changes in river channels, human occupancy in river channels, popular myths about the occurrence of floods and poor catchment management due to agricultural activities and other income generating activities such as sand extraction and brick making in the catchment areas. Some of the key issues that were revealed:
• High expected floods for Lingadzi catchment compared to Lufilya catchment at different return periods i.e. at a return period of 5 years in Lingadzi catchment, the expected floods were revealed to be 296.77 cumecs/s compared to 258.64 cumecs/s at a return period of 500 years in the Lufilya catchment;
• High flood risk in T/A Kilupula of KD (6) compared to Mtandire ward of LC
• High instability of river morphology for Lufilya catchment compared to Lingadzi catchment. This makes the households to be close to rivers and thereby become more vulnerable to floods;
• More probability of flooding occurrence for both catchments and;
• Karonga district experienced more flood events in a 10-year interval between 1992-2001 and 2012-2021 than Lilongwe city. This implies that T/A Kilupula is more vulnerable due to flooding frequency.
Household flood vulnerability is high in Mtandire Ward and T/A Kilupula of LC and KD respectively. This information is useful for stakeholders and decision-makers to understand flood risk mitigation and preparedness activities such as the installation of river gauging systems for flood monitoring in the catchments and the design of any hydraulic structures around the stream catchments. In this way, stakeholders can find these indicators useful for creating a public flood mitigation plan for the most vulnerable zones.
Integration of FFA into spatio-temporal flood vulnerability assessment through hydrological assessment, GIS, and remote sensing are significant data-driven tools necessary to provide data for the implementation of proper flood risk reduction and mitigation measures aimed at reducing household flood vulnerability. This study applied these tools only at the micro-scale level, using the Lufilya catchment in T/A Kilupula of Karonga District and the Lingadzi catchment in Mtandire of Lilongwe City. The findings reveal that the spatiotemporal characteristics in these catchments contribute to increased household flood vulnerability. As such, it is paramount that future research study should undertake a more integrated flood frequency analysis for multiple catchments in both Karonga District and Lilongwe City to provide an accurate estimation of design floods for programming current and future flood mitigation measures. This would assist in understanding flood vulnerability at the macro-scale level. More importantly, this study provides a basis for integrating FFA into FVA in any region in the world because all the input data is globally available. This information can further provide an accurate estimation of design floods for programming current and future flood mitigation measures and can be a component of proper planning for mitigating flood risk in the assessed areas and beyond.
Ethical approval was sought from the Mzuzu University Research Ethics Committee (MZUNIREC) with reference No. MZUNIREC/DOR/21/37. The MZUNIREC Permission was submitted to the Karonga District Council (KDC). Participants were assured of confidentiality.
The publication of this research received financial support from the NORHED Project on Climate Change and Ecosystem Management in Malawi and Tanzania (#63826) and the Centre for Resilient Agri-Food Systems (CRAFS) under the Africa Centres of Excellence (ACE2) programme.
The authors declare that they have no known competing financial interests or personal relationships that could have appeared to influence the work reported in this paper. Kadono Mwalwimba has a patent licensed to the Mzuzu University Research and Ethical Committee. The author Isaac Mwalwimba has no conflicts of interest to which this manuscript is submitted. If there are other authors, they declare that they have no known competing financial interests or personal relationships that could have appeared to influence the work reported in this paper.
Citation: Mwalwimba IK, Manda M, Ngongondo C (2024). Application of Flood Frequency Analysis to Examine Spatiotemporal Households Flood Vulnerability in Karonga District and Lilongwe City, Malawi. J Geogr Nat Disasters. 14:316.
Received: 03-Jul-2024, Manuscript No. JGND-24-32633; Editor assigned: 08-Jul-2024, Pre QC No. JGND-24-32633 (PQ); Reviewed: 29-Jul-2024, QC No. JGND-24-32633; Revised: 05-Aug-2024, Manuscript No. JGND-24-32633 (R); Published: 12-Aug-2024 , DOI: 10.35841/2167-0587.24.14.316
Copyright: © 2024 Mwalwimba IK, et al. This is an open-access article distributed under the terms of the Creative Commons Attribution License, which permits unrestricted use, distribution, and reproduction in any medium, provided the original author and source are credited.