Journal of Geology & Geophysics
Open Access
ISSN: 2381-8719
ISSN: 2381-8719
Research Article - (2024)Volume 13, Issue 3
3D seismic data have become the key tool used in the oil and gas industry to understand the subsurface. In addition to providing excellent structural images, the dense sampling of a 3-D survey can sometimes make it possible to map reservoir quality and distribution of oil and gas. However, it leads to good results in some areas and deteriorates at others. Seismic attributes are typically applied in such a case for extracting more valuable structural and stratigraphic information. The old Nile Valley is passing through the area of study cutting through the shallow horizons and then filled with accumulations of the eroded sediments (the ancestral Nile fills), these fill masks of the amplitude and frequency of the seismic data at the deeper horizons, which include the main reservoir of the area. Seismic attributes can help to study these fills and then enhance the interpretation and decrease the uncertainties and risk of dry holes, The results suggest that the application of seismic attributes methodology integrated with structure interpretation leads to quite good predictions of prospects and leads, enhancing the development plan within fields and reducing the drilling risk.
Nile fills; 3D Seismic data; Sediments; Fields
The study area WON-C field is located in the Northern Western Desert of Egypt, Southwest Beni Suef Basin, south of Beni Suef concession and West of Qarun oil field. It was discovered in 2011 when the first well WON-C-1x drilled. The study applied in an area of about 42 Km2 (Figure 1) [1].
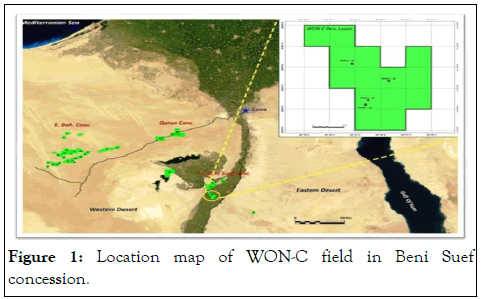
Figure 1: Location map of WON-C field in Beni Suef concession.
It is noted that the stratigraphic column of the Beni Suef Basin extends from the Pre-Cambrian granitic basement through the major cretaceous reservoirs and seals and up into the Eocene Apollonia carbonates (Figure 2). Late tertiary to recent deposition is also recorded within the ancestral Nile valley and along its margins.
Some uncertainty exists as to the age of inception of the Beni Suef Basin and the extent of sedimentation within the basin prior to the deposition of the lower Kharita shales. Current 3D seismic mapping is endeavoring to delineate more clearly these older sedimentary packages [2].
The most important tectonic event occurred during the late cretaceous and early tertiary and was probably related to the movement of the North African plate toward Europe. It resulted in the elevation and folding of major portions of the North Western Desert along east-northeast, West-Southwest trend (Syrian Arc system) and in the development of faults of considerable displacements.
The main productive reservoir of the study area is Abo Roash "G" member. So, this study focuses on it in addition to the deeper formations from early cretaceous reservoir’s which failed to produce till now and from which, we aim to add new undiscovered zones.
All the drilling activities in this area were drilled according to conventional work which based on choosing the highest structural traps. The use of unconventional methods could lead to achieving significant results that reduce both exploration and development risk [3].
3D seismic attributes have proven to be amongst the most useful geophysical techniques for enhancing the subsurface geological view alongside the traditional seismic interpretation. In this study, we applied some seismic attributes with the seismic interpretation trying to find a relation between the presence of hydrocarbon and any other attribute, hence; we can detect the areas of the same effect away of drilled wells.
The available data for this study were post-stack seismic data, well logs data and formation tops. The seismic volume was fullstack seismic reflectivity volume. On the other side, the well logs data comprising P-wave velocity and density.
In Figure 2, the workflow composed of four main steps. The first step is collecting and loading the data then, QC for the input seismic and well data. The second step is to interpret seismic data for multi horizons, in order to create structure contour maps which used in building the structural model then applying some seismic attributes on the zone of interest [4].
Based on seismic interpretation ten horizons were picked, as shown on the seismic cross-section, from the basement to the base-edge of the ancestral Nile fill.
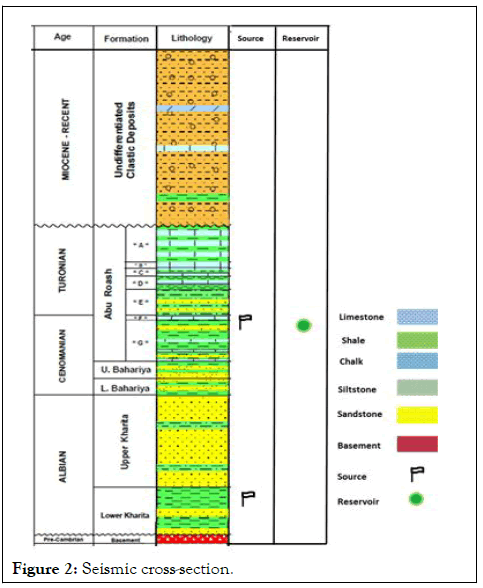
Figure 2: Seismic cross-section.
Structure contour maps of the main reservoir and other formations in the area were constructed. ARG structure contour map showing the structure of the WON-C field where all wells targeted these closures, producing from this thin sand bed which ranges from 25 ft to 30 ft.
So we resorted to the application of some other uncommon method rather than seismic interpretation trying to find an answer to any questions or enhancing the final image that would help in the development plan and reduce the risks that may found in the future, this technique is the application of seismic attributes (Figure 3) [5].
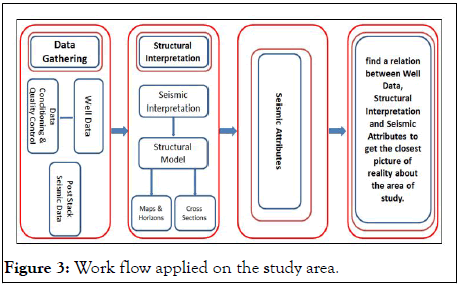
Figure 3: Work flow applied on the study area.
Accurate interpretation of geophysical data-in particular, reflection seismic data-is one of the most important elements of a successful oil and gas exploration program.
Despite technological advances in data acquisition and processing, you still face a tremendous challenge each time you begin to reconstruct the geologic story contained in a grid or volume of seismic data that is, to interpret the data. In occasion, this interpretive tale can be clearly told; but most of the time, each page of each chapter is slowly turned and rarely is the full meaning of the story completely understood [6]. The attributes can be derived from the seismic volume itself, such as the amplitudes of the seismic traces or the instantaneous phase, instantaneous frequency and derivatives of the seismic trace. Attributes also can be inversionderived such as P-impedance, S-impedance and density (Figures 4 and 5).
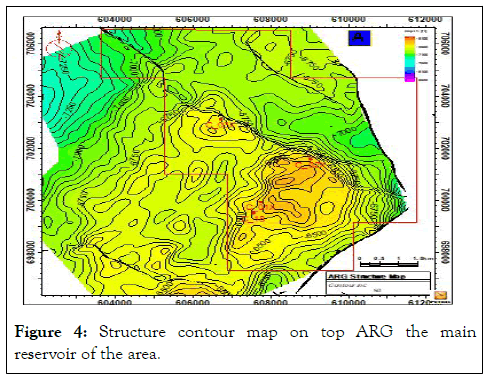
Figure 4: Structure contour map on top ARG the main reservoir of the area.
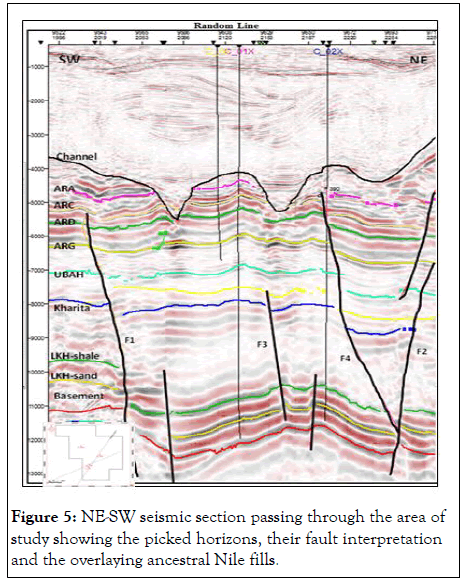
Figure 5: NE-SW seismic section passing through the area of study showing the picked horizons, their fault interpretation and the overlaying ancestral Nile fills.
After completing the regular structural seismic interpretation and applying some seismic attributes on the main area of interest, ARG the main reservoir, to enhance the structural interpretation.
The first extracted attribute was variance attribute, (Figure 6A and 6B) showing the variance attribute maps for ARG surface and overlaid by the fault polygons from the conventional structure interpretation to show that this attribute is very useful in fault detection and structural adjustment [7].
The second attribute was the RMS (Root Mean Square) attribute. Figure 6C shows another feature not related to the structure of the area of interest reflected as a contrast in color from cold (blue) to hot (red). Understanding these features, we have three hypotheses, the first one was that all the structures like faults were represented by very low RMS values, the second was that all the drilled wells were located in areas where the RMS values were low with a high structure contour points.
The third was there is a relation between the image resulted from the RMS attribute and the map resulted from the picking of the lower edge of the ancestral Nile fill, they similarly have the same trend, but with high RMS values [8].
The third attribute was the trace envelope attribute. It can be used as an effective discriminator for some characteristics; bright spots, thin-bed tunning effects, unconformities, major lithology changes and lateral changes indicating faulting (Figure 6D).
No doubt that the image resulted from both the RMS and the trace envelope attribute-amplitude domain attributes-may be affected by the ancestral Nile fill, which appears clearly as a very high values of amplitudes and the occurred features is not found clearly on the variance attribute map, so it might be a result of a mask over the attributes run on the top reservoir, so we try to find any other method to find a relation between the images extracted from the attributes with the Nile fills, so we tracked the attributes that have a direct relation to the velocity change over the ARG surface (Figure 7C and 7D) [9].
After extracting the average velocity values over the surface of ARG surface a homogenous change all over the area has been noticed except an abrupt change across the area having the NESW trend which coincides to the same trend of the ancestral Nile fill (Figure 7D). So it does not give an answer to the doubt that this feature resulted from the ancestral Nile fill.
The third attribute was the spectral decomposition attribute. We made a scan of the spectrum of the seismic cube and we get three different frequency bands and displayed them over each other (Figure 8) [10].
After applying the spectral decomposition, the output image seemed to have the same behavior as well as the images resulted from the amplitude and velocity attributes on the surface of the area of interest we still have that feature that has the same shape of the ancestral Nile fill.
All the applied attributes showed that there is a different anomaly appeared over the surface of interest, so to leave no stone unturned, we resorted geological data for the drilled wells in the study area, as we took a seismic section that has a NE-SW direction passing through the drilled wells, but it is not a conclusive evidence for the presence of this feature, as there are no wells penetrating this anomaly so we cannot judge for its presence or absence.
This suspicion came from three reasons that the seismic reflector that representing the ARG member is not affected by any change over it and the second reason is that the trend of this anomaly or the feature is typically like the trend that came from the picking of the basal part of the surface channel filled with the ancestral Nile fills so it may act as a mask for the seismic behavior over all the subsurface members and formations, the third reason is that, there is no any well drilled over that feature to make us have the confirmation that if it is already found or it is just a fake feature and it is not real [11].
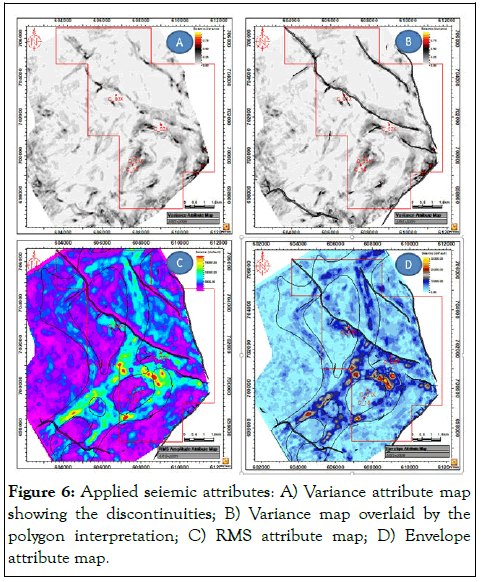
Figure 6: Applied seiemic attributes: A) Variance attribute map showing the discontinuities; B) Variance map overlaid by the polygon interpretation; C) RMS attribute map; D) Envelope attribute map.
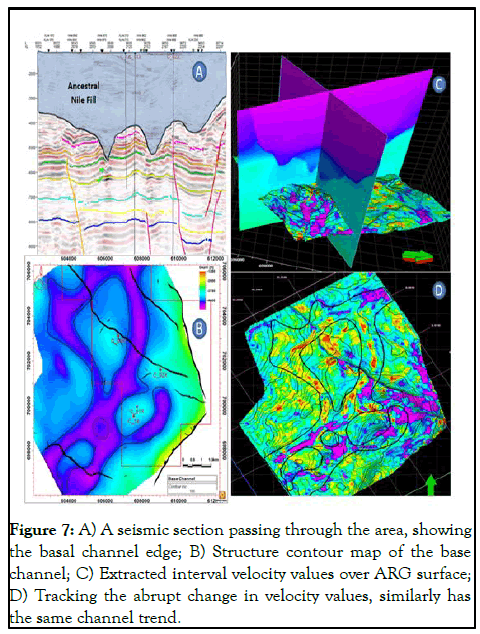
Figure 7: A) A seismic section passing through the area, showing the basal channel edge; B) Structure contour map of the base channel; C) Extracted interval velocity values over ARG surface; D) Tracking the abrupt change in velocity values, similarly has the same channel trend.
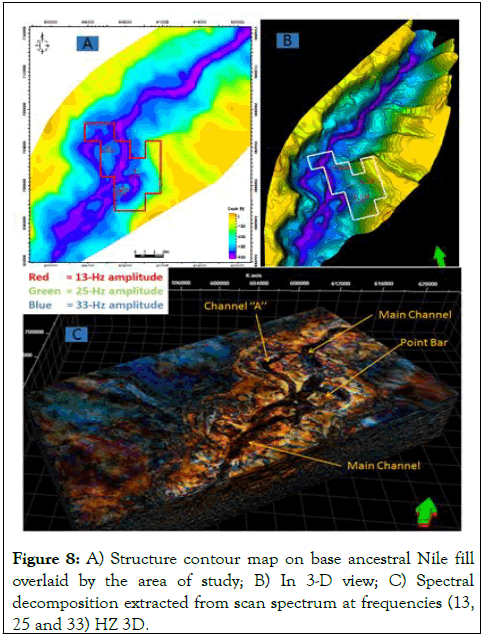
Figure 8: A) Structure contour map on base ancestral Nile fill overlaid by the area of study; B) In 3-D view; C) Spectral decomposition extracted from scan spectrum at frequencies (13, 25 and 33) HZ 3D.
From the previous work on seismic attributes some notes can be summarized as follows:
• Seismic attributes enable interpreters to extract more and
quick information from seismic data such as facies change,
reservoir thickness and lithology.
• Seismic attributes can be used in some applications include
hydrocarbon play evaluation, prospect identification, risk
reduction, reservoir characterization, well planning and field
development.
• Integration between structure and stratigraphic interpretation
is important in prospect identification, well planning and field
development.
• Integration between geophysical and geological intaerpretation
methods is very important in understanding the full
subsurface image that helps in development planning and risk
assessment.
• We recommend drilling a well that penetrates that feature, to
detect if that already found or not, so that we believe in
seismic data or it's affected by the masking caused by the
ancestral Nile fill.
Citation: Elbeheiry MG, Bakr A, Zaki M (2024) Application of Seismic Attribute for Enhancing Sub-Surface Seismic Interpretation, WON-C Fields, Beni Suef, Western Desert, Egypt. J Geol Geophys. 13:1173.
Received: 20-Jan-2020, Manuscript No. JGG-24-3157; Editor assigned: 23-Jan-2020, Pre QC No. JGG-24-3157 (PQ); Reviewed: 06-Feb-2020, QC No. JGG-24-3157; Revised: 03-Jun-2024, Manuscript No. JGG-24-3157 (R); Published: 30-Jun-2024 , DOI: 10.35248/2381-8719.24.13.1177
Copyright: © 2024 Elbeheiry MG, et al. This is an open-access article distributed under the terms of the Creative Commons Attribution License, which permits unrestricted use, distribution, and reproduction in any medium, provided the original author and source are credited.