Journal of Pollution Effects & Control
Open Access
ISSN: 2375-4397
ISSN: 2375-4397
Research - (2023)Volume 11, Issue 1
The research study is focused on ground water quality evaluation and current hydrochemical conditions by collecting various samples from different locations around rayalaseem thermal power plant, (RTPP) Muddanur and assessed different parameters like pH, electrical conductivity, total dissolved solids, hardness, levels of Ca, Mg, Na, K, HCO3, Cl, SO4, NO3,F and SiO2 as per standard guidelines laid down in APHA and suitability of ground water for drinking purposes is assessed as per BIS guidelines. The state of groundwater is mildly acidic to alkaline in nature with the pH range (5.76–8.01); Electrical Conductivity (380–7660 µS/cm), TDS (190–8830), Total Hardness (395-3900 mg/L),Na (27.47–1285.73 mg/L), K (0.73– 491.21 mg/L), Ca (7.30–167.57 mg/L), Mg (2.14–144.41 mg/L),HCO3(30.5–719.8 mg/L),F (0.199–1.45 mg/L), Cl (8.76–834.75 mg/L), NO3 (0.276–434.72 mg/L), SO4 (0.29–32.237 mg/L) and SiO2 (17.90–84.42 mg/L). The data established by spatial maps for respective contaminants and graphical trilinear Piper plot diagrams.
Ground water; Environment; Cement industries; Hardness; Total dissolved solids
Groundwater is the major reliable source for drinking and agriculture use all around the world since there is drastic change in climatic conditions and human intervention to the nature [1]. In India, many of the rural and urban population has been depending on ground water for domestic, agriculture and industrial purpose, several articles article were described about the importance of water [2,3]. In the recent past, enormous growth in the construction engineering, there by huge demand for cement industries and its expansion based on supply demand. Meanwhile, the unplanned dumping of the anthropogenic wastes has resulted an excessive accumulation of pollutant into waterway and terrain surface, and the successive leaching of the pollutants has caused the significant dilapidation of water quality of surface and shallow groundwater. However, knowledge on groundwater quality is limited and there is a lack of complete study on groundwater quality [4,5]. Majorly ground water composition is deteriorated due to the population explosion, urbanization, industrialization, rising demand agricultural production and the failure of monsoon and improper rainwater management [6].
The valuation of ground water resources is conducted out in periodically to determine the quality of ground water in the nation. Throughout the nation assessment of ground water resources poses challenges in terms of data availability, acquisition and maintaining consistency and comparison of the obtained results. There is a robust relation between the assessment and management which require continuous refinements in the ground water resources assessments. Ground water plays a vital role in providing food and water security to the nation [7,8] and its management is the most challenging issue and fluoride issues the country faces now [9,10]. The number of bore wells servicing agriculture is increasing at alarming rate now. The current trend of chasing the declining water table in search of deeper bearing zones has entailed high risk, especially in the Hardrock terrain. Ground water pumping is determined by private decisions, withdrawals are not subjected to any regulation. The present multidisciplinary study wherein a combination of geological, hydrologic, and hydro chemical information is applied to characterize the quantity, quality, and sustainability of aquifers [11-13]. It necessitates a need for scientific planning in the development of ground water under different Hydro geological environs and to evolve effective management practices with the involvement of community for better ground water governance. As India is the largest user of ground water in the world, there is an urgent need for an accurate and comprehensive picture of available ground water resources, through aquifer mapping in different hydro-geological settings to enable the preparation of robust groundwater management plans for this common pool resource [14,15] Physico and chemical characteristics are normally used for the characterization of the ground water. Ground water parameters changes from area to area due to various influences like pollution, seasonal fluctuation, groundwater extraction, etc. Hence, a continuous monitoring on groundwater becomes mandatory to minimize the groundwater quality pollution with the help of rapid water quality measurement techniques [16-18]. Defined guidelines are applied for the assessment of ground water quality during research work [19].
The present invention fussed on ground water contamination due to waste water disposed in bulky ponds around Rayalaseema thermal power plant situated in Muddanur town, Kadapa Dist , Andhra Pradesh, India. Limestone mining also is one among the activities that effect environment and ecosystem. An attempt has been made to carry out research study the extent of water contamination around Rayalaseema thermal power plant area between 14°35' to 14°45' North and 78°15' to 78°35' East, location map shown in Figure 1.
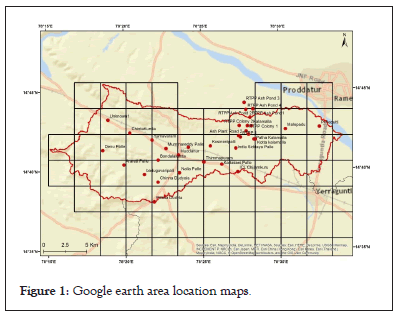
Figure 1: Google earth area location maps.
Study area
The study area lies between longitudes 14°35' to 14°45' North and 78°15' to 78°35' East. The climate of the study area is hot and semiarid. The monthly maximum, minimum and mean temperature as measured at Kadapa are 44°C, 14°C and 27°C respectively. The Kadapa district is aptly called the district of penna as almost the entire district is drained by the Penna River and its tributaries. Primarily the field investigations were carried out total of 27 ground water, 04 ash pond, 01 cooling tower water samples, 06 ash pond sediments and 02 coal samples are collected in and around Rayalaseema Thermal Power plant, Muddanur, Kadapa(Dt), Andhra Pradesh.
Apparatus
Measuring cylinder, Pipette with elongated tip, standard flask, conical flask, Burettes, beakers, burette stand, DO bottle and wash bottle etc.
Water sampling
To get the most accurate results, samples need to be collected properly and every lab may have their own set of sampling Standard Operating Procedures (SOP), there are some common best practices for collecting samples. Some basic type of collecting samples like bottle type, holding times, sampling techniques, sampling points and documentation. Before getting into sample collection and field practices, determine if samples need to meet regulatory requirement. If samples are to meet regulatory requirement, the method to be used may be dictated by the regulation. It’s important to get a good idea of the scope of the project, including sampling location/conditions and what methods will be used, because this will usually dictate how many bottles will need to be filled and what time constraints you are dealing with.
Sample collection bottles and materials
Before collecting samples, make sure you have all the equipment’s are like bottles, field equipment’s are proper and cleaned. There is nothing worse than being unprepared in the field, so plan as much as possible. It’s best to obtain sampling bottles from the lab running the analysis, as some not cleaned bottles used can differ slightly.
Sampling techniques
When collecting samples must be representative sample, before collecting the sample bore well motor pump should running, rinse the collection bottles and collect the sample in between flow of water, Avoid collection from storage tanks, remove any aerator from the spigot. A good way to determine quality is usage of running water is enough is to use onsite measurements like pH, temperature, and conductivity. Take measurements every two to three minutes, and once you get three consistent measurements in a row and ready to collect samples.
Instrumentation
The pH and EC (Electrical Conductivity), TDS (Total Dissolved Salts) as well as temperature were measured by a portable Combo pH/EC/TDS meter (Model No: HI98129 Hanna Company). The Dissolved Oxygen (DO) concentrations were measured by using portable DO meter (Model No: HI9146 Hanna Company). The Oxidation Reduction Potential was measured by using portable ORP meter (Model No: HI9820 Hanna Company). Metal content measured by using sophisticated instrument like Ion Chromatography (IC) and Inductively Coupled Plasma-Optical Emission Spectroscopy (ICP-OES).
Sampling plan
Collection of samples will depend on the objective of the specific analysis. For instance, collecting a sample to establish a baseline of water quality for a private well, should gather the sample prior to any treatment devices. Primarily the field investigations were carried out about total of 27 ground water, 04 ash pond, 01 cooling tower water samples, 06 ash pond sediments and 02 coal samples are collected. WHO guidelines and limitation of water were described in Table 1.
| Water quality parameters | Concentration | WHO guidelines | |
|---|---|---|---|
| Most desirable limit | Maximum permissible limit | ||
| Physicochemical parameters | |||
| pH | --- | 8.5 | 6.5 |
| EC | (µS/cm) | - | 1500 |
| TDS | mg/L | 500 | 1500 |
| Total Hardness | mg/L | 100 | 500 |
| Cations | |||
| Sodium | mg/L | - | 200 |
| Potassium | mg/L | - | 15 |
| Calcium | mg/L | 75 | 200 |
| Magnesium | mg/L | 50 | 150 |
| Anions | |||
| Bicarbonate | mg/L | - | 300 |
| Fluoride | mg/L | - | 1.5 |
| Chloride | mg/L | 250 | 600 |
| Nitrate | mg/L | 45 | 50 |
| Sulphate | mg/L | 250 | 500 |
Table 1: Groundwater sample of the study area exceeding the permissible limit prescribed by World Health Organization.
Water sample testing
After collection of samples and shipped with control room temperature to the laboratory to conduct the various experiments i.e. pH, Total Dissolved Solids (TDS), Conductivity, Hardness, Dissolved oxygen, Alkalinity and Chlorides. All test was carried out with established standard operating procedures, Examination of Water and Wastewater as per APHA, BIS and WHO guidelines. The below Table 2 shows the experimental methods and types of equipment’s used to conduct various experiments.
| S.no. | Parameter | Method | Equipment/instrument |
|---|---|---|---|
| Used | |||
| 1 | Temperature | Laboratory method | Portable equipment |
| 2 | PH | Electrometric | Portable equipment |
| 3 | Conductivity | Electrometric | Portable equipment |
| 4 | Total dissolved solids | Electrometric | Portable equipment |
| 5 | Carbonate and Non-Carbonate,Hardness | Laboratory method | Titrimetric |
| 6 | Chlorides | Laboratory method | Titrimetric |
| 7 | Dissolved oxygen | Laboratory method | Titrimetric |
Table 2: Equipment usage for different analytical tests.
Physical parameters
To evaluate the nature of ground water near the limestone quarry area, thermal power plant area and cement industries are physical parameters were analyzed as per Standard Procedures (BIS & WHO). They had no odour and taste. The range of temperature measurement for the ground water samples investigated is found to be in the range of 21°C to 37°C presented in Table 3.
| Water quality parameters | Concentration | Statistical data | |||||||
|---|---|---|---|---|---|---|---|---|---|
| Min | Max | Average | SD | Q1 | Q2 | Q3 | IQR | ||
| Physicochemical parameters | |||||||||
| pH | --- | 5.76 | 8.01 | 6.74 | 0.64 | 6.23 | 6.57 | 6.965 | 0.735 |
| EC | (µS/cm) | 380 | 7660 | 2156.67 | 2172.37 | 775 | 1290 | 2580 | 1805 |
| TDS | mg/L | 190 | 8830 | 1270.74 | 1780.25 | 380 | 650 | 1330 | 950 |
| Total Hardness | mg/L | 395 | 3900 | 1069.81 | 907.28 | 500 | 760 | 1107.5 | 607.5 |
| Cations | |||||||||
| Sodium | mg/L | 27.47 | 1285.74 | 249.14 | 334.77 | 60.88 | 128.74 | 212.32 | 151.44 |
| Potassium | mg/L | 0.732 | 491.21 | 23.62 | 95.51 | 2.20 | 3.36 | 6.88 | 4.68 |
| Calcium | mg/L | 7.30 | 167.57 | 32.07 | 35.98 | 0 | 11.23 | 34.55 | 34.55 |
| Magnesium | mg/L | 2.135 | 144.41 | 35.67 | 40.95 | 0 | 12.13 | 24.97 | 24.97 |
| Anions | |||||||||
| Bicarbonate | mg/L | 30.5 | 719.8 | 320.59 | 181.72 | 149.45 | 347.7 | 436.15 | 286.7 |
| Fluoride | mg/L | 0.20 | 1.45 | 0.70 | 0.40 | 0.318 | 0.656 | 0.96 | 0.64 |
| Chloride | mg/L | 8.76 | 834.75 | 231.96 | 258.48 | 44.72 | 120.70 | 394.94 | 350.23 |
| Nitrate | mg/L | 0.276 | 434.72 | 59.01 | 91.81 | 1.67 | 24.22 | 73.33 | 71.66 |
| Sulphate | mg/L | 0.29 | 32.24 | 253.61 | 613.41 | 0 | 0 | 0 | 0 |
| Silica | |||||||||
| Silica | mg/L | 17.90 | 84.42 | 42.21 | 18.09 | 26.41 | 43.34 | 50.10 | 24.59 |
Table 3: Physico-chemical characterization of groundwater samples.
Chemical parameters
The results of the chemical parameters analyzed are mentioned in Table 3 and are compared with water quality standards of BIS. The highlighted zones are varies more compared to other zones with the standard values.
pH and conductivity
The pHs of the water samples ranged between 5.76–8.01 and are found within the permissible limits except for few which showed acidic nature. The conductivity values ranged between 380-7660 μs, wherein few samples showed the values beyond the permissible limits. Higher values suggest the presence of high amount of dissolved inorganic substance in ionized form. The samples collected from quarry sites showed higher electrical conductivity values probably due to the input of large amounts of salts and silts presented in Table 3.
The physical, major and minor ion chemistry of surface water around the RTPP area was evaluated and the results were summarized by means of maximum and minimum ranges in Table 3. The results of analysis show an insignificant disparity of chemical composition in concentration. The respective ionic compositions with their ranges are pH (5.76–8.01); Electrical Conductivity (380–7660 µS/cm), TDS (190–8830),Total Hardness (395-3900 mg/L),Na (27.47–1285.73 mg/L), K (0.73– 491.21 mg/L), Ca (7.30–167.57 mg/L), Mg (2.14–144.41 mg/L), HCO3 (30.5 –719.8 mg/L), F (0.199–1.45 mg/L), Cl (8.76–834.75 mg/L), NO3 (0.276–434.72 mg/L), SO4 (0.29–32.237 mg/L) and SiO2 (17.90–84.42mg/L).
The piper diagrams are a graphical trilinear representation of the hydro-geochemical facies and classification of the water samples. These diagrams are useful in carrying out chemical relationships among water samples in more exclusively rather than with other plotting methods. These plots include two triangles, one for plotting cations and other for anions. The plotted classification of water shown in the diagrams shown in Figure 2 presents five main hydro chemical facies such as CaHCO3 (9.38%), NaCl (25%), Mixed Ca-Na-HCO3 (31.25%), CaCl2 (9.38%) and NaHCO3 (21.88%). The results of silicon dioxide (SiO2) representation of spatial maps showed in Figure 3 and concentration trends of sample shown in Figure 4.
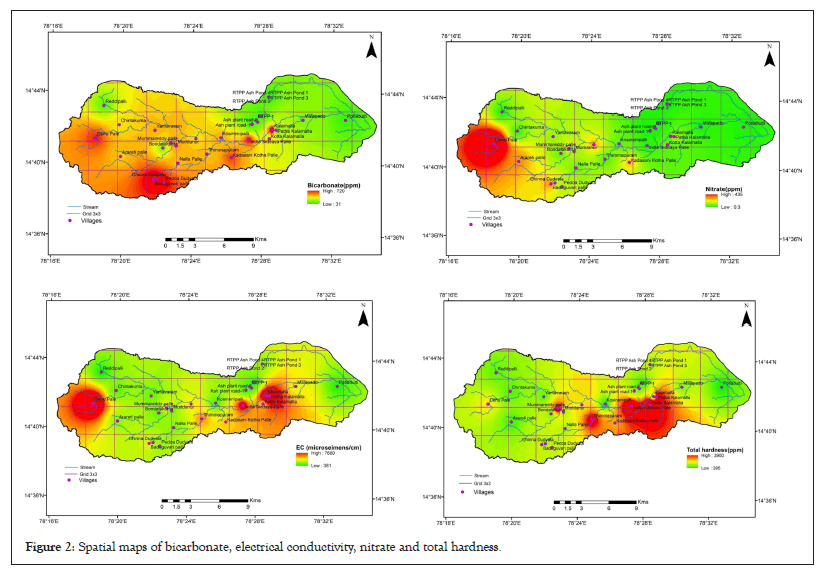
Figure 2: Spatial maps of bicarbonate, electrical conductivity, nitrate and total hardness.
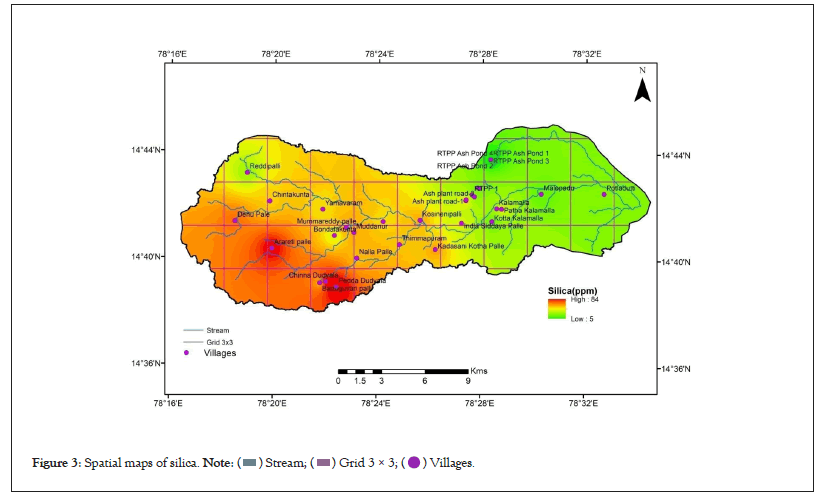
Figure 3: Spatial maps of silica. 
Figure 4: Silicon dioxide concertation around RTPP.
Moreover, to have a detail investigation on various hydrogeochemical mechanisms involved in the evolution of the water chemistry and quality around the area, the 1:1 ratio plots and cross plots for different elements were constructed which demonstrated a modest to weak correlation trends in the major and minor ions of water. Particularly, the plot of Cl and Na presented in Figure 5 and Na+ K and Ca+ Mg; presented in Figure 6, so on exhibit that the sample points are aligned to positive linear trend but are spread above and below the unit line though in different proportions, which suggests the contribution of several processes in ion enrichment of water. Thus the collective results of chemical analysis shows that small variation of all major and minor elements of water which are not poorly affected yet by the current activities of BTPP. These characteristics might be the primary indication of single source of recharge like rainfall where wide-ranging physico-chemical processes, intermixing, base-exchange, and other recharge processes may be absent or insignificant.
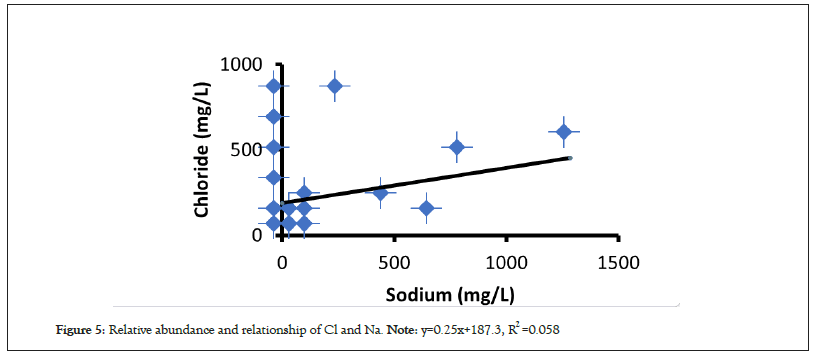
Figure 5: Relative abundance and relationship of Cl and Na. Note: y=0.25x+187.3, R2 =0.058.
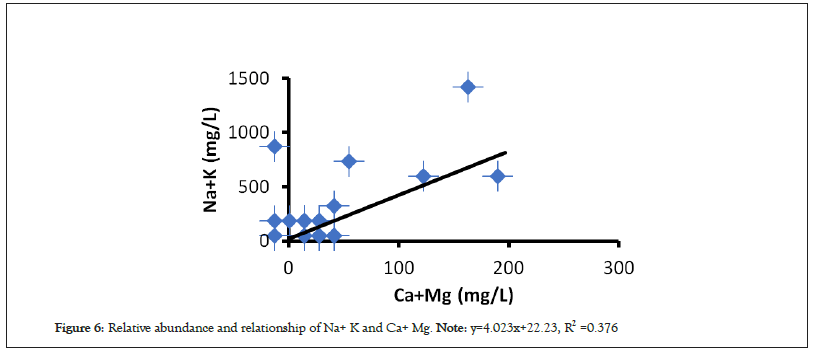
Figure 6: Relative abundance and relationship of Na+ K and Ca+ Mg. Note: y=4.023x+22.23, R2 =0.376.
Statistical analysis
Statistical analysis can be applied for understanding the characteristics and internal relations of different physicochemical parameters of waters. Currently many researchers preferred statistical application to achieve a sustainable development of surface and groundwater resources. In the present study, as primary part of statistical analysis, the maximum, minimum, mean, standard deviation, IQR (Interquartile Range)=Q3–Q1; Q1=First quartile and Q3=Third quartile, values of different parameters are calculated shown in Table 3. On the other hand, statistical correlation analysis also carried out which reflects a broad class of statistical relationship between two or more variables. Hence, it can be considered as a normalized measurement of covariance. The correlation study is useful to find a predictable relationship which can be exploited in practice. It is used for the measurement of the strength and statistical significance of the relation between two or more water quality parameters.
The multivariate statistical analyses have been used to simplified and organized data set to provide meaningful insight. The use of univariant and bivariant statistics are usually unable to implicate the complex interrelationships among the ionic components but multivariate statistical techniques are stronger and more useful for data treatment and for detecting anomalies. In reality, the elemental relations among dissolved ions can replicate the possible responsible ways of forming the investigated compositions of water Based on the maximum values, the relative abundance of major cations and anions in water are in the order: Na+>K+>Ca2+>Mg2+ and Cl->HCO3->NO3->SO42- respectively. The standard deviation and inter-quartile range levels of all the ionic components reflect more or less similar sharing to each other but the mineral component of SiO2 shows relatively higher standard deviation (19.67%) and IQR (32.88%) values which might be the signatures of mixing SiO2 rich fly ash with surface water around the RTPP. This graphical trilinear Piper plot diagrams is shown in Figure 7.
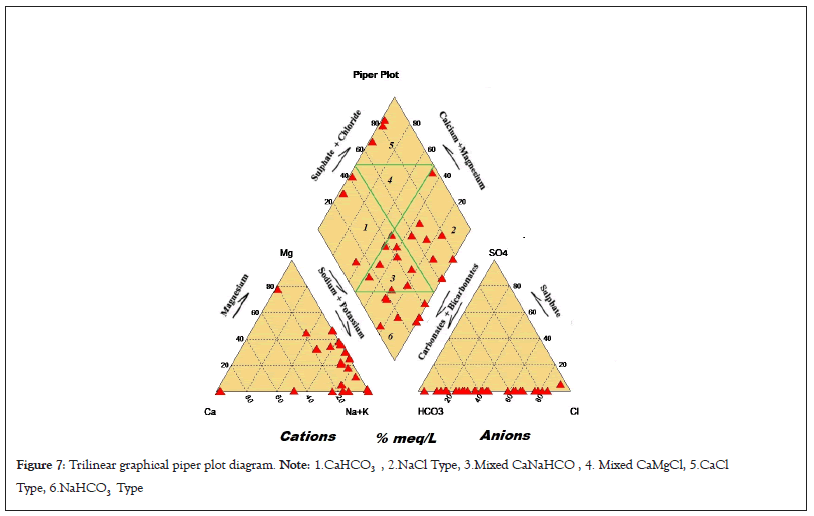
Figure 7: Trilinear graphical piper plot diagram. Note: 1.CaHCO3 , 2.NaCl Type, 3.Mixed CaNaHCO , 4. Mixed CaMgCl, 5.CaCl Type, 6.NaHCO3 Type.
The quality of ground water dependent on the type of the contaminants and also based on the nature of mineral found at specific sample points. Ground water quality monitoring is carried out by collecting ground water samples at different locations at Muddanur Thermal power plant surrounding area and analyzed for the physico-chemical characteristics of collected water samples. The groundwater assessment was satisfying for domestic purpose but not for drinking since the water containing the higher TDS and Hardness, also other containments like Ca, Mg, Na, K, HCO3, Cl, SO4, NO3, F and SiO2 concertation. This area water should be either filtered or boiled to decrease the TDS and hardness before utilization of domestic purpose. To avoid further water adulteration of subjected area must be taken some measures like wastewater from thermal power plant should be stored in proper manner and treated as per regulatory guidelines. These industries around Muddanur area must be improved their waste water treatment which has been utilized during their manufacturing process must be established treatment capabilities to Zero Liquid Discharge (ZLD) procedure and treated water should recycled to the subsequent activities.
The corresponding author is thankful to CSIR-NGRI for Instrumental support. Some Part of analysis work was carried out during Dr K.Sesha Maheswaramma as INSA Visiting Scientist fellowship under supervision of Dr K.Rama Mohan, senior principal scientist, Hydro-geo chemistry division, CSIR-NGRI, Hyderabad.
Data availability statement
Due to confidentiality agreements, supporting data can only be made available to bona fide researchers subject to a non-disclosure agreement.
The authors declare that they have no conflict of interest
[Crossref] [Google Scholar] [PubMed]
[Google Scholar] [PubMed]
Citation: Kalpana A, Puppala RK, Kurakalva RM, K Sesha Maheswaramma (2023) Assesment of Groundwater Quality in and around RTPP, Muddanur, Kadapa District, Andhra Pradesh, India: Using Multi Analytical and Statistical Techniques. J Pollut Eff Cont. 11:357.
Received: 20-Feb-2023, Manuscript No. JPE-23-21835; Editor assigned: 22-Feb-2023, Pre QC No. JPE-23-21835 (PQ); Reviewed: 08-Mar-2023, QC No. JPE-23-21835; Revised: 15-Mar-2023, Manuscript No. JPE-23-21835 (R); Published: 22-Mar-2023 , DOI: 10.35248/2375-4397.23.11.357
Copyright: © 2023 K Sesha Maheswaramma, et al. This is an open access article distributed under the terms of the Creative Commons Attribution License, which permits unrestricted use, distribution, and reproduction in any medium, provided the original author and source are credited.