Journal of Clinical and Experimental Ophthalmology
Open Access
ISSN: 2155-9570
ISSN: 2155-9570
Research Article - (2023)Volume 14, Issue 1
Aim: To assess the effect of Intravitreal Injection (IVI) of Ranibizumab on Central Choroidal Thickness (CCT) using Enhanced Depth Imaging Optical Coherence Tomography (EDI-OCT) and its correlation with Central Macular Thickness (CMT) and Best Corrected Visual Acuity (BCVA) in eyes with center involving diabetic macular edema.
Materials and methods: Prospective interventional study including 60 eyes with center involving diabetic macular edema which will receive three consecutive monthly IVI of Ranibizumab.
Results: Baseline CCT decreased from 256 µm-432 µm (Mean 322.1 ± 63.17 SD) to 227 µm-303 µm (Mean 271.6 ± 26.53 SD). Baseline CMT decreased from 401 µm-718 µm (Mean 526.45 ± 99.63 SD) to 248 µm-444 µm (Mean 382.85 ± 119.66 SD). Baseline BCVA improved from 0.4-1.0 logMAR (Mean 0.83 ± 0.22 SD) to 0.1-1.0 logMAR (Mean 0.45 ± 0.29 SD). We found a non-significant correlation between the percent reduction in CCT and the percent reduction in CMT as well as the percent improvement in BCVA over the entire study. However a statistically significant positive correlation was found between the percent reduction in CMT and the percent improvement in BCVA over the entire study.
Conclusion: IVI of Ranibizumab in the treatment of center involving diabetic macular edema results in reduction of the permeability of the choroidal blood vessels as well as the Sub-Foveal Choroidal Thickness (SFCT). However we could not establish a statistically significant correlation between the percent reduction in CCT, the percent reduction in CMT and the percent improvement in BCVA.
Central choroidal thickness; Central macular thickness; Diabetic retinopathy; Visual acuity; Choroid neovascularization; Blindness
The primary global factor contributing to vision impairment and blindness in persons of working age is Diabetic Retinopathy (DR) [1,2]. DR is a type of micro-angiopathy that is characterized by vascular hyper-permeability, pericyte loss, and the development of microaneurysms [3,4].
The development of Diabetic Macular Edema (DME) and Proliferative Diabetic Retinopathy (PDR), the most prevalent causes of vision loss in people with diabetes mellitus, is significantly influenced by Vascular Endothelial Growth Factor (VEGF) [5,6]. Diabetic Macular Edema (DME) is mostly brought on by microaneurysms and retinal capillary leakage [7,8].
The best way to detect DR is with a dilated slit lamp fundus examination [9,10]. Despite being more sensitive, Fluorescein Angiography (FA) is an invasive treatment that needs the administration of intravenous dye and may have some unfavorable side effects [11]. Hyperfluorescent spots are a sign of intra-choroidal vascular anomalies or choroidal vessel enlargement, according to indocyanine green angiography in individuals with non-proliferative diabetic retinopathy [12,13].
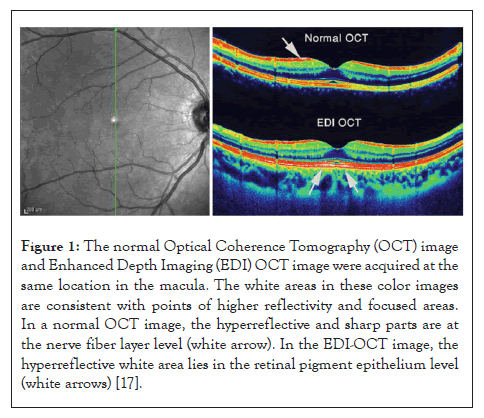
The measuring of Choroidal Thickness (CT) in a variety of ocular illnesses, which was previously unachievable, has become possible because of the development of Enhanced Depth Imaging Optical Coherence Tomography (EDI-OCT) [14]. Recent research using Enhanced Depth Imaging (EDI) OCT to measure choroidal thickness in diabetic retinopathy patients revealed aberrant choroid thickness in those with different stages of the disease (Figure 1) [15,16].

Figure 1: The normal Optical Coherence Tomography (OCT) image and Enhanced Depth Imaging (EDI) OCT image were acquired at the same location in the macula. The white areas in these color images are consistent with points of higher reflectivity and focused areas. In a normal OCT image, the hyperreflective and sharp parts are at the nerve fiber layer level (white arrow). In the EDI-OCT image, the hyperreflective white area lies in the retinal pigment epithelium level (white arrows) [17].
In individuals with DME, Bevacizumab, Ranibizumab, and Aflibercept dramatically increase visual acuity and decrease retinal thickness [18]. These studies demonstrated that Central Choroidal Thickness (CCT) in diabetic patients may fluctuate between decreasing and increasing, but there is currently no information on the relationship between changes in CCT, Central Macular Thickness (CMT), and Best Corrected Visual Acuity (BCVA) following Intravitreal injections of Ranibizumab (IVR) for the treatment of DME [19].
Our study's goal is to evaluate the impact of an intravitreal injection of Ranibizumab on changes CCT, CMT and BCVA in eyes with center-involving diabetic macular edema.
Our prospective interventional study involved 60 eyes with center involving diabetic macular edema >400 µm in patients with non-proliferative diabetic retinopathy that have not received any previous treatment.
We excluded patients with media opacities, uncontrolled glaucoma, intraocular pressure (IOP) >24 mmHg, vitreoretinal traction, proliferative diabetic retinopathy, history of the previous injection of anti-VEGF, previous laser therapy and any history of intraocular eye surgery. Patients with comorbidities such as iris neovascularization, high degenerative myopia, Age-related Macular Degeneration (AMD), and choroid neovascularization and those who have general contraindications to intravitreal anti-VEGF injections, such as stroke were also excluded.
Data collection
History: Demographic data (age, gender), general medical history (DM, hypertension), ophthalmologic history (previous cataract surgery or vitreoretinal surgery.
Examination: Best-corrected visual acuity (logMAR), examination of the anterior segment using slit-lamp biomicroscopy, fundus examination using indirect ophthalmoscopy or slit lamp using 90 D lens, measurement of IOP using Goldmann applanation tonometer, baseline fluorescein angiography. Enhanced depth OCT was performed on 60 eyes at Fayoum university.
Optical coherence tomography protocol: Optovue machine, manual assessment of Sub-Foveal Central Choroidal Thickness (SFCT) and macular thickness map and baseline OCT was done monthly after each injection for three consecutive injections.
Surgical procedure
All patients in this study underwent three consecutive monthly intravitreal injections of 0.05 ml Ranibizumzb (Lucentis) using a 27 gm needle after installing local anesthetic drops (Benox) and 5% povidone-iodine solution for disinfection of skin and conjunctiva. Paracentesis was done if Intraocular Pressure (IOP) increased after injection.
Follow-up
At the initial visit and each month following each injection Enhanced Depth Imaging Optical Coherence Tomography (EDI-OCT) scans were taken.
The study included 57 patients with 60 affected eyes. Males represented 33.3% of them and their ages ranged from 48 to 74 years with a mean of 63.32 years. Concerning the side of the lesion, 61.7% had Oculus Dexter (OD) and 48.3% had Oculus Sinister (OS) (Table 1).
| Parameter | N=60 | % |
|---|---|---|
| Age (year) | ||
| Mean ± SD | 63.32 ± 6.95 | - |
| Range | 48 – 74 | - |
| Gender | ||
| Female | 38 | 66.70% |
| Male | 19 | 33.30% |
| Side | ||
| OD | 37 | 61.70% |
| OS | 23 | 48.30% |
Note: SD: Standard Deviation; OD: Oculus Dexter; OS: Oculus Sinister.
Table 1: Distribution of the studied patients according to demographic data.
Outcomes
Baseline CCT ranged from 256 µm to 432 µm with a mean of 322.1 ± 63.17 SD, which significantly decreased in the first month where it ranged from 242 µm to 400 µm with a mean of 301.36 ± 65.68 SD, then it significantly decreased in the second month, as it ranged from 232 µm to 323 µm with mean 283.5 ± 26.18 SD. In the third month, it significantly decreased as it ranged from 227 µm to 303 µm with a mean of 271.6 ± 26.53 SD. On calculating the percent reduction in CCT at each point of time as regard baseline value, the median percent reduction in the first, second and third month were 5.13%, 10.42%, and 12.28%.
Baseline BCVA ranged from 0.4 to 1 logMAR with a mean of 0.83 ± 0.22 SD, in the first month BCVA ranged from 0.2 to 1 logMAR with a mean of 0.58 ± 0.23 SD, second month, it ranged from 0.2 to 1 logMAR with a mean of 0.52 ± 0.27 SD, in the third month, it ranged from 0.1 to 1 logMAR with a mean of 0.45 ± 0.29 SD with statistically significant decrease in logMAR value over time. On calculating the percent reduction in logMAR value at each point of time as regard baseline value, the median percent change in the first, second, and third month were 30%, 41.43%, and 58.57%.
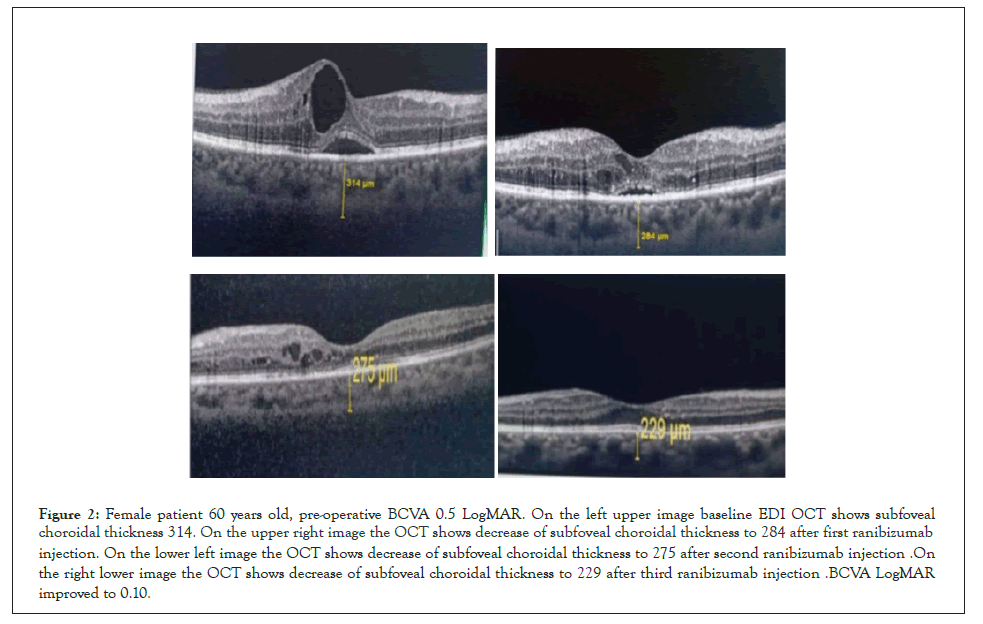
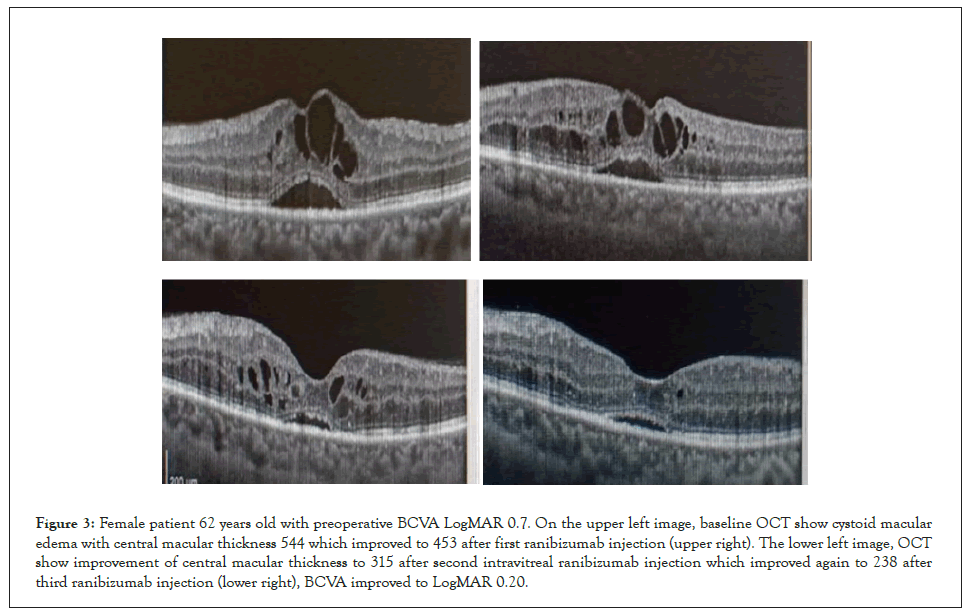
Baseline CMT ranged from 401 µm to 718 µm with a mean of 526.45 ± 99.63 SD, which significantly decreased in the first month where it ranged from 254 µm to 659 µm with a mean of 408.1 ± 116.52 SD, then it significantly decreased in the second month, as it ranged from 237 µm to 605 µm with mean 380.45 ± 108.87 SD. However, in the third month, it non-significantly increased to 382.85 ± 119.66 SD with a range from 248 µm to 444 µm with a mean of 382.85 ± 119.66 SD. On calculating the percent reduction in CMT at each point of time as regard baseline value, the median percent reduction in the first, second and third month were 26.17%, 26.53%, and 34.19% (Table 2 and Figures 2 and 3).
| Outcome | Mean ± SD | Range | P | |
|---|---|---|---|---|
| BCVA | Wx | |||
| Baseline | 0.83 ± 0.22 | 0.4-1 | ||
| 1 month | 0.58 ± 0.23 | 0.2-1 | -5.412 | <0.001** |
| 2 months | 0.52 ± 0.27 | 0.2-1 | -2.666 | 0.008* |
| 3 months | 0.45 ± 0.29 | 0.1-1 | -3.947 | <0.001** |
| CMT | t test | |||
| Baseline | 526.45 ± 99.63 | 401-718 | ||
| 1 month | 408.1 ± 116.52 | 254-659 | 7.207 | <0.001** |
| 2 months | 380.45 ± 108.87 | 237-605 | 2.873 | 0.006* |
| 3 months | 382.85 ± 119.66 | 248-444 | -0.222 | 0.825 |
| CCT | t test | |||
| Baseline | 322.1 ± 63.17 | 256-432 | ||
| 1 month | 301.36 ± 65.68 | 242-400 | 9.259 | <0.001** |
| 2 months | 283.5 ± 26.18 | 232-323 | 5.734 | <0.001** |
| 3 months | 271.6 ± 26.53 | 227-303 | -5.64 | <0.001** |
Note: BCVA: best corrected visual acuity; CMT: central macular thickness; CCT: central choroidal thickness; SD: Standard Deviation; Wx: Wilcoxon test
Table 2: Change in BCVA, CMT, and CCT among the studied eyes baseline and after intervention.

Figure 2: Female patient 60 years old, pre-operative BCVA 0.5 LogMAR. On the left upper image baseline EDI OCT shows subfoveal choroidal thickness 314 .On the upper right image the OCT shows decrease of subfoveal choroidal thickness to 284 after first ranibizumab injection. On the lower left image the OCT shows decrease of subfoveal choroidal thickness to 275 after second ranibizumab injection .On the right lower image the OCT shows decrease of subfoveal choroidal thickness to 229 after third ranibizumab injection .BCVA LogMAR improved to 0.10.

Figure 3: Female patient 62 years old with preoperative BCVA LogMAR 0.7. On the upper left image, baseline OCT show cystoid macular edema with central macular thickness 544 which improved to 453 after first ranibizumab injection (upper right). The lower left image, OCT show improvement of central macular thickness to 315 after second intravitreal ranibizumab injection which improved again to 238 after third ranibizumab injection (lower right), BCVA improved to LogMAR 0.20.
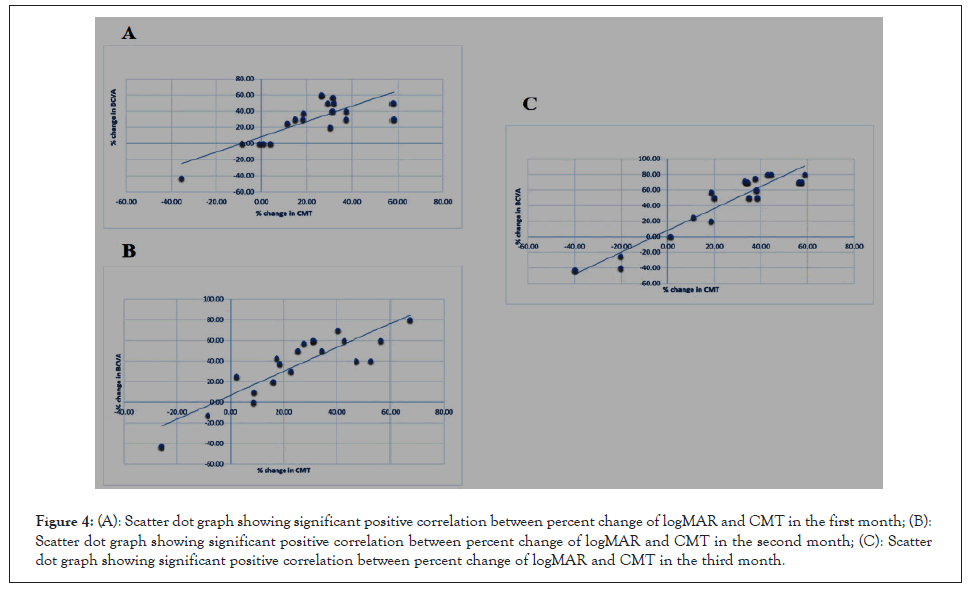
In our study we found a non-significant correlation between the percent reduction in CCT and the percent change in logMAR value in the first, second and third month. We also found a non-significant correlation between the percent reduction in CCT and the percent reduction in CMT throughout the whole study. However Figures 4A-4C shows a statistically significant positive correlation between the percent reduction in CMT and the percent change in logMAR value in the first, second and third months (Figures 4A-4C).

Figure 4: (A): Scatter dot graph showing significant positive correlation between percent change of logMAR and CMT in the first month; (B): Scatter dot graph showing significant positive correlation between percent change of logMAR and CMT in the second month; (C): Scatter dot graph showing significant positive correlation between percent change of logMAR and CMT in the third month.
Intravitreal injection of anti-VEGF is an effective and safe treatment for DME which is one of the biggest complications of diabetic eye diseases, the outcome of anti-VEGF injection in diabetic eyes does not stop at the retina alone as it also affects the choroidal circulation [20].
Significant CCT reduction following anti-VEGF therapy is another interesting topic in the field of diabetic choroidopathy [21]. It is thought that excessive VEGF production in diabetic retinopathy patients may lead to choroidal vessel dilatations, increased choroidal vessel permeability, and subsequently increased choroidal thickness in addition to retinopathy worsening. Thus, a larger choroid in DME patients may be a sign of a more VEGF-driven process.
Latest studies exhibit an efficient evaluation of CT in healthy and pathological states utilizing the enhanced depth spectral-domain imaging using the Cirrus Linear measurement tool, observers measured CT perpendicularly from the external edge of the hyper-reflective Retinal Pigment Epithelium (RPE) to the internal sclera [22].
Spaide et al. [23] concluded that the EDI technique is the finest technique to monitor all segments of the choroid, not only the external segments and so it is the best existing technique for examination and follow-up of the CT.
In our study, the EDI technique was employed to evaluate the CT. We stressed the central SFCT to eliminate the anatomical variation and we measured the choroid using the same guidelines from previous studies i.e. vertically from the external edge of the hyper-reflective RPE to the internal sclera [24].
We found significant changes between the preoperative and the postoperative measures and the results were as follows; the preoperative SFCT as assessed using EDI-OCT was 256 µm to 432 µm with a mean of 322.1 which significantly decreased over time, during the postoperative period 4-weeks afterward the 3rd injection, the mean sub-foveal CT was 271.6 µm and ranged from 277 µm to 303 µm. The post-operative decrease in CT was calculated to be significantly (p<0.001) lesser than the pre-operative CT.
Park et al. [25] compared CT previously and afterward injection of anti-VEGF using EDI-OCT in 15 eyes and he found that the postoperative CT was reduced after injection of anti-VEGF with a mean difference of 19 µm.
Lee et al. [26] after studying the effect of intravitreal injection of anti-VEGF on 31 eyes reported that CT was reduced postoperatively. Another new study done by Lains et al. [27] on 50 eyes using EDI-OCT also supported the same finding that diabetic eyes handled with anti-VEGF agents have decreased CT.
In our study the mean preoperative logMAR value was 0.83 ± 1 SD while the mean postoperative logMAR improved significantly to 0.4 ± 0.3 SD (p<0.001).
Giuseppe et al. [28] compared BCVA before and after Ranibizumab injection in 18 eyes and reported a significant improvement in the postoperative BCVA. The findings of our study compare favorably with this study and also with Park et al. [25] who reported that the mean preoperative BCVA on Snellen's was (0.6 ± 0.3) while the mean postoperative BVCA on Snellen's was 0.7 ± 0.3 implying a good visual outcome after intravitreal injection of Ranibizumab.
No statistically significant link between a reduction in CCT, a reduction in CMT, and an improvement in BCVA was seen in our study. Some studies have discovered a correlation between the CCT' decline, the CMT decline, and the visual gain with anti-VEGF therapy. Other studies were unable to discover such a correlation with visual gain.
The DME's anatomical or functional outcomes were not predicted by the SFCT, according to Campos et al. [29] and Yiu et al. [24]. However, a reduction in the central CT 6 months following therapy with 3 IVI of Ranibizumab has been demonstrated in a prospective study of 20 eyes of 20 treatment-naive DME patients, and this reduction is strongly linked with a decrease in CMT and with an improvement in visual acuity. The results of our study are in line with those of Rayess et al. [30] who concluded that baseline SFCT may be able to predict which DME patients will experience an improvement in their BCVA.
Our study, in contrast to Nourinia et al. [31] study, revealed a non-significant connection between BCVA and SFCT alterations. Nourinia et al. [31] suggested that alterations in the SFCT were strongly linked to an improvement in BCVA. In our analysis, a tiny proportion of our patients displayed the same outcomes, however it did not achieve statistical significance. It is generally recognized that DME can lead to refractory vision problems in people with DM. In our research, there was no significant relationship between BCVA and CCT, however there was a significant relationship between BCVA and the CMT.
In their evaluation of the importance of changes in visual and anatomical outcomes in DME eyes six months after anti-VEGF treatment, Yiu et al. [24] found no correlation between BCVA and CCT. Eliwa et al. [32] in contrast demonstrated a markedly adverse connection between BCVA and CCT in the DME eyes. The differences between the previous and the current studies may be related to the different DR stages examined.
We studied also the correlation between changes in CMT and BCVA, we found an existing positive correlation between the postoperative CMT and the postoperative BCVA among the investigated patients. Many previous papers supported this finding and the positive correlation between postoperative CMT and postoperative BCVA [33].
Even though a positive correlation exists between the postoperative CCT and the postoperative BCVA among the studied cases but it was a statistically insignificant correlation (p=0.795). This result also agreed with previous studies as Glenn et al. [34] reported that central CCT was reduced after anti-VEGF treatment for DME but it cannot be accompanied by any functional or anatomical consequences as there’s no significant correlation among the variation in CCT and the variation in visual acuity.
A significant reduction in the CCT occurs after treatment of DME with Ranibizumab as diagnosed with EDI-OCT. However we were unable to find a statistically significant correlation between this reduction and the reduction in CMT and improvement in BCVA in our study. We believe that further studies with larger sample sizes and longer follow up periods are needed to confirm the effect of anti-VEGF on choroidal vasculature and thickness and its correlation with central macular thickness and best corrected visual acuity.
The Faculty of Medicine Research Ethical Committee evaluated this study. The researcher explained to the participants the goals of the study, the test, and the upcoming investigation. Additionally the privacy of patient’s personal data was respected as well as their freedom to decline to take part in the study. All participants in the study provided written informed consent.
[Crossref] [Google Scholar] [PubMed]
[Crossref] [Google Scholar] [PubMed]
[Crossref] [Google Scholar] [PubMed]
[Crossref] [Google Scholar] [PubMed]
[Crossref] [Google Scholar] [PubMed]
[Crossref] [Google Scholar] [PubMed]
[Crossref] [Google Scholar] [PubMed]
[Crossref] [Google Scholar] [PubMed]
[Crossref] [Google Scholar] [PubMed]
[Crossref] [Google Scholar] [PubMed]
[Crossref] [Google Scholar] [PubMed]
[Crossref] [Google Scholar] [PubMed]
[Crossref] [Google Scholar] [PubMed]
[Crossref] [Google Scholar] [PubMed]
[Crossref] [Google Scholar] [PubMed]
[Crossref] [Google Scholar] [PubMed]
[Crossref] [Google Scholar] [PubMed]
[Crossref] [Google Scholar] [PubMed]
[Crossref] [Google Scholar] [PubMed]
[Crossref] [Google Scholar] [PubMed]
[Crossref] [Google Scholar] [PubMed]
[Crossref] [Google Scholar] [PubMed]
[Crossref] [Google Scholar] [PubMed]
[Crossref] [Google Scholar] [PubMed]
[Crossref] [Google Scholar] [PubMed]
[Crossref] [Google Scholar] [PubMed]
[Crossref] [Google Scholar] [PubMed]
[Crossref] [Google Scholar] [PubMed]
[Crossref] [Google Scholar] [PubMed]
[Crossref] [Google Scholar] [PubMed]
[Crossref] [Google Scholar] [PubMed]
Citation: Mohamed RS, Kamal MA, Dabees MM, Mohamed KKA (2023) Assessment of Central Choroidal Thickness Changes using Enhanced Depth OCT after Treatment of Diabetic Macular Edema with Intravitreal Ranibizumab Correlation: Central Macular Thickness and Best Corrected Visual Acuity. J Clin Exp Ophthalmol. 14:939.
Received: 02-Jan-2023, Manuscript No. JCEO-22-20762; Editor assigned: 04-Jan-2023, Pre QC No. JCEO-22-20762 (PQ); Reviewed: 18-Jan-2023, QC No. JCEO-22-20762; Revised: 25-Jan-2023, Manuscript No. JCEO-22-20762 (R); Published: 03-Feb-2023 , DOI: 10.35248/2155-9570.23.14.939
Copyright: © 2023 Mohamed RS, et al. This is an open-access article distributed under the terms of the Creative Commons Attribution License, which permits unrestricted use, distribution, and reproduction in any medium, provided the original author and source are credited.