Journal of Geography & Natural Disasters
Open Access
ISSN: 2167-0587
ISSN: 2167-0587
Research Article - (2023)Volume 10, Issue 1
This study had been executed employing Seismic Refraction Tomography (SRT) and Multichannel Analysis of Surface Waves (MASW), to integrate elastic and bearing capacity with engineering criteria within delineation for seismic microzonation besides menace assessment. Forty eight and eight SRT and MASW outline through an aggregate distance of about 484 m breathe constrained toward characterizing topsoil variables conducive to site characterization. 12 kg sledge hammers with 1.0 m diameter aluminum disc, twenty four channels (ES 30000 S) enhancement seismographs were used as seismic sources, detectors, and recorders. P and S wave’s velocities breathe attained as well as delineated employing SRT and MASW techniques via beget 2D/3D velocity depth model. The elastic, bearing capacity and engineering parameters calculated were: Elastic/rigidity modulus, Poisson ratio, allowable capacity and compactness grade along with strain correlation to evaluate the near surface substratum through geophysical and engineering potential. These parameters identified three microzones: Higher, midway, and bottom zones. The higher zone is delineated by frail soil quality; the midway one is delineated by light soil quality and the bottom zone is delineated by acceptable soil quality. The frail and light parameters of the higher and midway zones lead to the structural collapse experience in the region. Therefore, the bottom zone of acceptable soil and rock quality is recommended for the construction plan.
Low strain; Compactness grade; Rigidity modulus; Poisson ratio
Characterization of local conditions is recognized to be an important procedure in the definition of site-specific groundshaking hazards. Therefore, an accurate assessment of the regional geophysical and geo-mechanical properties and reliable quantification of the local seismic site-response called seismic microzonation is also of fundamental importance with reliable quantification of the local seismic site-response and seismic risk analysis. Such assessment is essential for used in building codes, land and urban planning, and emergency response in case of catastrophic event.
Microzonation is nowadays a common practice in seismic hazard analysis. It has been applied to many risk prone areas globally. In this research, elastic wave velocity methods of seismic microzonation were carried out for ascertaining the potent features of topsoil stratification as well as low seismicity terrain. A microzonation, on the contrary, layout additional practical delineation based on the local seismic response for the design of buildings, with a potential to decrease the conservatism in the design. Thus, poised data breathe outlined within an interpretative geotechnical/geophysical model of the study area. However, when the level of certainty in the available soil calibration data is low, various versions comparable via various interpretations have to be proposed to represent the associated epistemic uncertainty. Two main types of numerical analysis are relevant in microzonation such as wave propagation simulations and geo mechanical modeling. The goal of the first model is to directly reproduce the interaction of the incident seismic wave field with the local structure, to quantify the ground motion and its variability over the research location. In turn, the geo-mechanical model breathes utilized by verifying the possibility of fault induced effects under dynamic loading. This includes the analysis of slope instabilities and the assessment of liquefaction potential, lateral spreading, and ground subsidence. The involvement as regards numerical model is defined by the quality and quantity of a concerned research area and the data available. In the case of seismic site response analysis, 2D/3D models are an acceptable simplification of geological processes for areal width/depth ratio together with the existence of geometrical effects such as edge generated surface waves. The paramount objectives of this current research breathe on proposing acceptable approaches to seismic measured and computed superficial elastic, bearing, and engineering attributes about the sub surface.mechanical model breathes utilized by verifying the possibility of fault induced effects under dynamic loading. This includes the analysis of slope instabilities and the assessment of liquefaction potential, lateral spreading, and ground subsidence. The involvement as regards numerical model is defined by the quality and quantity of a concerned research area and the data available. In the case of seismic site response analysis, 2D/3D models are an acceptable simplification of geological processes for areal width/depth ratio together with the existence of geometrical effects such as edge generated surface waves. The paramount objectives of this current research breathe on proposing acceptable approaches to seismic measured and computed superficial elastic, bearing, and engineering attributes about the sub surface.
Theory
The seismic refraction method uses the principles of Snell’s law to utilize seismic energy that returns to the surface along refracted ray paths. It breeds while tremendous signals breathe such as, refraction arrival of primary (Vp) and secondary (Vs) waves velocity. The parameters calculated from the measured Vp and Vs velocities in this study are young/shear modulus, Poisson ratio, allowable capacity, concentration index, material index, stress ratio and density gradient. By integrating, these seven calculated variables could be employed for seismic micro zonation along with hazard assessments. These calculated parameters are delineated.
Shear modulus (μ) measures the proportion of shearing stress with respect to shearing strain as displayed in equation 1.
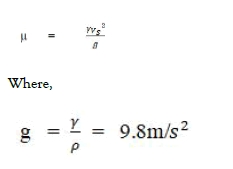
Where γ is the unit weight of the soil. ρ is the density.
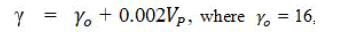
Where γo=16, being a portion of mass with an acceleration of loose, sandy, and clayey soil.
Vp is the velocity of the P wave.
Young modulus or modulus of Elasticity (E) measures the stiffness of solid materials to deform. It is expressed as proportion in reference to extensible load to ductile tension the ratio of tensile stress to tensile strain which relates shear modulus and poisson ratio as displayed in equation 2.
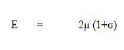
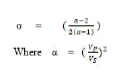
Poisson ratio (σ) measures the poisson effect of a material to expand in the angular directions toward the route as regards compression displayed in equations 3 and 4.
Allowable bearing capacity (qa) measures the bearing pressure that will cause acceptance settlement of the structure against instability due to shear failures. It is expressed as eventual loading-capacity divided by its component pertaining to safeness displayed in equations 5,6 and 7.
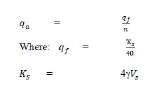
Where Ks is the subgrade coefficient qf, is the ultimate failure and n=4.0 for soil, which is the factor of safety.
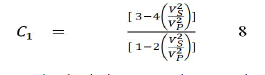
Concentration index (C1) measures the mass of the load/soil strength as displayed in equation 8.
Material index (V1) measures the material property in a material selection process displayed in equation 9.
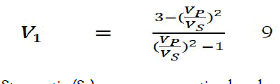
Stress ratio (S1) measures proportion based on ultimate strength via allowed strain of engineering material displayed in equation 10.
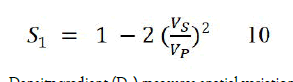
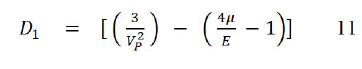
Density gradient (D1) measures spatial variation in density of the material over a given area displayed in equation 11.
Geological setting
Uyo is the capital of Akwa Ibom state. It lies allying latitudes 4°87’N-7°79’N and longitudes 5°10’E-8°04’E, 64 m elevation above the sea level with about 140 km2 covering an area as illustrated using an ArcGIS software program.
Geographically, the region breathes primarily smooth in the company of swampy inlet scrub throughout its edge above the rivulet. It gravitates in an equatorial bed in which other fallow flora greenish verdure undergrowth along with Elaeis Guineensis shrub zone. The region possesses duo timeliness: Rainy and dried. The rainy timeliness amounts to warm and clouded while dried timeliness amounts to hot and mostly overclouded as well as brutal age globular. The regional climate characteristic ranges from 69°F to 87°F and is scarcely beneath 63°F or above 90°F. Based on the beach/pool score, the prime period to sojourn the terrain for hot weather activities is from late November to early February. Its atmospheric averages weather series of the region are: The wetter season lasts for 7.8 months, from March 15 to April 3, with an average daily high temperature above 90°F. The drier season lasts for 4.2 months, from November 12 to March 19, with an average of 2.7 days with at least 1.016 mm of precipitation. The region experiences the most rain in September, with an average rainfall of 386.08 mm. The month with the least rain is January, with an average rainfall of about 17.78 mm. The muggier period in the region is from February 2 to December 24, the fewest muggy days are January with 22.0 days that are muggy. The winter months ranged from May 27 to October 8 with an average of more than 8.3 km/h. The windiest month is August with an average hourly wind of 10.3 km/h. The calmer time from October 8 to May 27, the calmest time from December with an average hourly wind speed of 6.4 km/h. The resources of the region are: Natural and forest resources. A natural resource is the abundant deposit of crude oil and clay, and the oil mining activities of local and multinational oil companies like mobile producing Nigeria contribute immensely to the economic development of the area. Forest resources include timber, and palm products to boot nourishment management. Traditionally, Uyo people are farmers, and traders, now schooling. Geologically, the parent rock materials within the area are mainly sedimentary rocks which have resulted in the prevalence of sandy, clayey-silt soils [1] (Figure 1).

Figure 1:Map of Akwa Ibom state, showing Uyo study area and
its terrain.
Data acquisition
SRT and MASW were conducted using 24 channels (ES-30000 S) enhancement seismographs. The SRT survey was conducted at 48 profiles and 5 lines with a length of 400 m, inter-geophone spacing was 5 m with a total of 24 geophones. MASW was conducted at 2 profiles extending to 120 m inter-geophones spacing 5 m and shot to Ist geophone offset was 5 m respectively. A 12 kg sledge hammer was used to generate the seismic P-waves and MASW, 0.5 m diameter aluminum disc was used to receive the strikes with 48 HZ frequency geophone respectively. The total record length of P-waves was 720 ms with a test gap as regards 0.5 ms while for MASW, the total length was 700 ms with a sample interval of 0.5 ms. A total of 5 shots breathe cataloged respecting each profile for being forwards and reversing waves. 3 strokes breathe registered repeatedly considering MASW sketches for eight points surveying [2-5].
Data interpretation
SRT data acquired were analyzed using IX refrax and picking software. Three stages were involved in the SRT survey: The first stage involved picking the first arrival from the seismic signal and plotting as Time (T) distance (X) curves. The T-X graph curving breathes collude entrenched profile length, geophone spacing, and first arrival times. The second stage involved checking T-X curves and correcting for the exact estimation of the P wave velocity. Thirdly, velocity-depth models were executed along with 2D/3D contouring. However, depth velocity profiles were also modeled and the layered profile reveals three subsurface layers.
Geologically, additional confirmation implement offshoots were used as regards substitute reservoir data to verify velocity depth models.
Seislmager packages of Pickwin and Plotrefra were used for the analysis of MASW data and contour to obtain 2D/3D MASW profiles. Three stages were involved in MASW surveys: Firstly, Time (T)-distance (X) curves plotted entrenched by delineation stretch, geophone spacing, and first arrival times delineated. The second stage involved the generation of dispersion curves by converting the frequency domain for each cross correction CMP gathered and checked (Figures 2-9). Thirdly, the velocity models were calculated for frequency against phase velocity delineated as dispersion curves obtained from waveform form data by the nonlinear least square method displayed (Tables 1 and 2) [6].

Figure 2: Velocity depth model from tomography inversion.

Figure 3: Shot gathered for SRT.

Figure 4: Dispersion curves.

Figure 5: Shot gathered for single MASW.

Figure 6: Geophones field setup.

Figure 7: A plot of qa × 108 against Vp (m/s) for layer 1.

Figure 8: 2D contour map showing the distribution of qa × 105 (N/m2) in layer 1.

Figure 9: 3D surface map showing the modeling of Vp/ Vs in layer 2.
| Vp (m/s) | Vs (m/s) | D (m) | Th (m) | σ | E (N/m2) | µ (N/m2) | qa (N/m2) | CI | VI | D1 | SI |
|---|---|---|---|---|---|---|---|---|---|---|---|
| Upper layer | |||||||||||
| 409.8 | 205.43 | 0 | 0.33 | 308.05 | 70.98 | 86.38 | 4.01 | -0.11 | 0.08 | 0.5 | |
| 678.8 | 392 | 4.75 | 4.75 | 0.25 | 1200.24 | 266.72 | 170.08 | 5 | -0.33 | 0.11 | 0.33 |
| Middle layer | |||||||||||
| 718.09 | 413.05 | 5 | 0.25 | 1368.41 | 297.48 | 180.05 | 4.96 | 0.1 | 0.13 | 0.34 | |
| 7.25 | |||||||||||
| 915.88 | 704.74 | 12.25 | 0.22 | 4835.53 | 885.63 | 314.17 | 3.43 | 1.9 | 0.14 | -0.18 | |
| Third layer | |||||||||||
| 1132 | 876.5 | 13 | 0.22 | 6875.39 | 1403.14 | 400.21 | -3.02 | 1.99 | 0.18 | -0.2 | |
| 1586 | 1094 | 11.5 | 24.5 | 0.05 | 12620.14 | 2294.57 | 524.35 | 4.66 | 0.82 | 0.27 | 0.05 |
Table 1: Ranges of calculated parameters.
| Soil parameters | Weak | Fair | Good |
|---|---|---|---|
| Young’s modulus E × 103 (N/m2) | 3.00-2.50 | 13.00-50.00 | 60.00-130.00 |
| Shear modulus µ × 103 (N/m2) | 0.60-2.50 | 3.00-9.50 | 14 .03-23.50 |
| Poisson ratio (σ) | 0.33-0.25 | 0.25-0.22 | 0.22-0.05 |
| Allowable capacity qa (N/m2) | 0.80-1.70 | 1.8-3.50 | 4.00-5.50 |
| Concentration Index (CI) | 3.00-3.30 | 3.30-4.00 | 4.00-5.50 |
| Material Index (VI) | -0.03-(-0.10) | 0.1-1.90 | 0.50-2.00 |
| Density Gradient (DI) | 0.05-0.1 | 0.13-0.15 | 0.15-0.27 |
| Stress ratio (SI) | 0.50-0.30 | 0.35-0.18 | 0.20-0.05 |
Table 2: Description of soil stability.
Three micro-zone layers of the subsurface soil were identified: The higher, midway, and bottom micro-zones based on the seismic wave velocity and soil parameters. The higher microzones are sited in the North-Earthen regions, delineated by the least soil suitability. The Vp and Vs range from 409.80 m/ s-678.00 m/s and 205.43-392.00 m/s through the depth ranging from (0.00-4.75) m. The elastic parameters computed were young’s modulus, shear modulus, and poisson ratio with their values ranging from (308.05-1200.24) × 103 N/m2, (70.98-266.72) × 103 N/m2, and 0.25-0.33. The allowable bearing capacity ranges from 86.38-170.08 N/m2. This trend shows that low allowable capacity is associated with zones that are highly trained with water while the high bearing capacity is associated with zones that are unsaturated with water [7-10]. The engineering parameters such as: Concentration index, material index, density gradient, and stress ratio range from 4.00-5.00, -0.30-(-0.10), 0.05-0.8 and 0.50-0.30 respectively. The high-stress ratio and low concentration index reflect weak soil stability as shown in Tables 1 and 2. The midway micro-zones are situated centrally within the regions, delineated by fairly soil efficiency. The Vp and Vs range from 718.09-915.88 m/s and 413.05 m/ s-704.34 m/s at a depth of (5.00-12.2) m. The elastic parameters of young’s modulus, shear modulus, and poisson ratio ranged from (1300.00-5000.00) × 103 N/m2, (300.00-950.00) × 103 N/m2, and 0.25-0.22 delineated by fair soil proficient. The allowable bearing capacity ranges from 180.00 N/m2 -350.00 N/m2 showing moderately and unsaturated water formation. The engineering parameters such as: Concentration index, material index, density gradient, and stress ratio range from 3.30-4.00, 0.10-1.90, 0.13-0.15 and 0.35-0.18 respectively. Relative low concentration index and low-stress ratio were found in the North-Earth region reflecting fairly competent soil stability. The bottom micro-zones are situated in the meridional zone of the region, delineated by acceptable versatile soil efficiency. This layer had Vp and Vs ranging from 1130.00 m/ s-1586.00 m/s and 876.50 m/s-1094.00 m/s with a thickness of 13.00-24.50 m. The elastic parameters such as Young’s modulus, shear modulus, and Poisson ratio range from (6.0-13.0) × 103 N/m2, (1.4-2.4) × 103 N/m2, and 0.22 to 0.05 characterized by relative low poisson ratio, found in West-South regions which indicates good materials soil stability. The allowable capacity ranges from 400 N/m2-550 N/m2 characterized by high rigidity and high soil density. The dependence of the allowable capacity with elastic and engineering parameters has been envisaged because of the extent of engineering failures associated with the study area. The engineering parameters such as concentration index, material index, density gradient, and stress ratio range from 4.00-5.00, 0.50-2.00, 0.15-0.27, and 0.20-0.05 respectively.
From the modeling: 2D and 3D modeling were used for quick simulation time and to yield a realistic result. The modeling shows a South-Westward region's breadth delineated via moderately elevated desirability of young modulus with mainstay compactness. The Western-Southeast portion of the region is delineated by comparative shallow poisson ratings that specify corresponding virtuoso topsoil within the region. However, regions with low and negative values appertaining to Poisson ratings depict that the earth materials accompanied are anisotropy, whereas, the high values indicate isotropic formation [11-14]. The Southwest along with the central division is delineated by a correlative fair rise shear modulus and allowable capacity. This trend revealed that low allowable capacity is attributed to a region that is drained with water, while high allowable capacity is associated with zones that are unsaturated with water. On the other hand, for an earth material to be wellfounded, the rigidity needs to be absolute. For engineering parameters, the southwestward bottom zones were delineated by fair to good high-rise concentration index and desirable rock quality values depicting suitable topsoil, based on Abd El-RaImn classification of soil.
Seismic microzonation investigation was constrained in a convoluted sedimentology terrain lurking in the conurbation of Uyo. The quintessence of seismic microzonation was the geotechnical characteristic using seismic site delineation of elastic, bearing, and engineering parameters. The upshot of the elucidated data divulges three microzone formations. Shear modulus, Young modulus, and poisson ratio were elasticized variables analyzed which are crucial to envisage the deportment of soil material while inflicting a force. Allowable capacity was the key determining factor in the engineering substratum. The potentiality of the bedrock to bear the load reckon applicability competency. Thus, a certain rise within allowable capacity elicits a high rise rating of sheer velocity. The concentration/material index, stress ratio, and density gradient of the engineering framework were in addition evaluated for the underground substructure. As all-inclusive conclusions, this research displays the land site grading entrenched in the geotechnical characteristics of the study area. However, depicting the upper microzone as a low/poor strain formation with a higher bottom strain microzone having a better substratum for soil stability.
The authors declared that this research work is original, and no funding was received for conducting the study.
There is no financial interest involved, the research work was self-sponsored.
The authors are grateful to all qualified cadres throughout the field work, reviewers, editors whose constructive comments contributed to the success of this manuscript.
Citation: Aka MU, Dick MD, Essien UE, Ibe AA (2023) Assessment of Low Strain Parameters for Seismic Microzonation in Uyo, South-South, Nigeria. J Geogr Nat Disas. 13:260.
Received: 09-Feb-2022, Manuscript No. JGND-22-19064; Editor assigned: 11-Feb-2022, Pre QC No. JGND-22-19064 (PQ); Reviewed: 25-Feb-2022, QC No. JGND-22-19064; Revised: 04-Jan-2023, Manuscript No. JGND-22-19064 (R); Published: 16-Jan-2023 , DOI: 10.35248/2167-0587.23.13.260
Copyright: © 2023 Aka MU, et al. This is an open-access article distributed under the terms of the Creative Commons Attribution License, which permits unrestricted use, distribution, and reproduction in any medium, provided the original author and source are credited.