Journal of Oceanography and Marine Research
Open Access
ISSN: 2572-3103
+44 1300 500008
ISSN: 2572-3103
+44 1300 500008
Research Article - (2021)Volume 9, Issue 7
Ground water pollution as a result of anthropogenic activities of man in the environment is increasing on a daily basis and this comes with some negative environmental and health impacts on man. Due to the impacts of leachate on groundwater and other water supplies, its importance has gained much attention in recent times. Well water sample were collected from wells in four sites selected from Osogbo, Osun State Nigeria. Ten samples each were collected from the four sites. The sites were Oke Baale area of the city (control), Oke-fia area of the state capital, where three sites were identified based on proximity to landfills. Analyses of physiochemical parameters and Heavy metals were done on the collections. Data were subjected to Analysis of Variance (ANOVA) to separate the means and in case (s) of significant difference in means, data were further subjected to Duncan multiple range test at p ≤ 0.05. Temperature range was between 27.30°C-27.5°C. Site 1 was the turbid (7.49) while site 2 was the least turbid (1.38). There is no significant difference in the pH of the control and site 3. Total Dissolved Solid (TDS) was highest in site 2 (270.70). Oxidation Reduction Potential (ORP) ranges from 130.40 mg/l to 174.20 mg/l while Electrical Conductivity ranged from 315 S/m to 401.00 S/m. Nitrite and Nitrate were highest site 1 (55.90) and control (0.78). Lead and Cadmium were not detected. Sodium was highest (819.00 mg/l) in site 1 and Calcium was also highest (102.00) in site 1. The study revealed that the concentration of waste materials in the land fill site had systematically polluted the ground water over time. This pollution was not high and the values recorded for all the examined physicochemical parameters examined were still within the permissible levels of WHO and USEPA.
Ground water; Physicochemical; Osogbo; leachates; Heavy metals
Contamination by leachates from municipal solid waste dumpsites is a significant source of ground water contamination in urban areas. Analysis of solid wastes leachates and water quality monitoring are two ways to control these contaminants. Many industrial processes generate heavy metals as well as organic products which constitute the bulk of the pollutants suspended in our environment [1].
Leachate varies widely in composition, depending on many factors such as waste composition and volume, availability of moisture and oxygen, landfill capacity, activity, and age.
Contamination of groundwater is primarily due to the process of industrialization and urbanization which has developed over time without taking into account the environmental consequences of these contaminants, there is imminent danger lurking at the corner to the developments in such areas [2]. The consistency of these contaminants depends on the physical and chemical soluble parameters because of weathering from source rocks and anthropogenic activities of man. The impacts of leachates on ground water and other water sources have drawn considerable attention in recent times due to its enormous significance.
As a result, waste management has become increasingly complex due to the growth of the human population, manufacturing activities and technological advances that control the destiny of people especially in Nigeria.
Chemical leachate on groundwater sources is rising constantly, resulting in some negative impacts on man's climate and health. Awareness of the quantity and composition of leachates typically provides insight into a safe, effective and sustainable approach to treatment of water. Therefore this study sought to determine the environmental impact of leachates on ground water and its effects on human health in selected areas of Osogbo local government area of Osun state, Nigeria.
Description of the study area
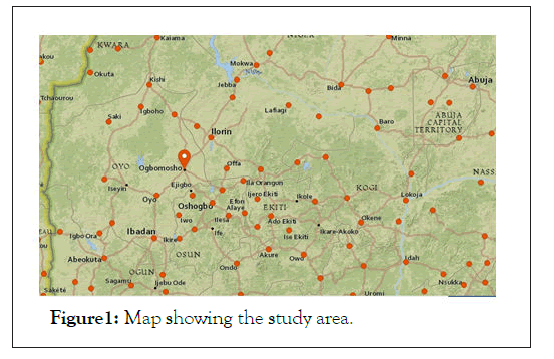
Osogbo is a Nigerian city which is the capital of Osun State. It is some 88 km North East of Ibadan by road. It is also about 108 km south of Ilorin by road, and 108 km northwest of Akure. Osogbo shares borders with Ikirun, Ilesa, Ede, Egbedore and Iragbiji and, due to its centrality, is easily accessible from any part of the state (Figure 1).

Figure 1: Map showing the study area.
Sample collection
Four sites were selected for the study and ten samples of water were collected from wells in each site. The first site was Oke Baale area of the city which has relatively low anthropogenic activities and reduced landfills (dump sites) and is designated as the control point, the second site was Oke-fia area of the state capital (where three sites were identified based on proximity to landfills and these are designated as second, third and fourth locations respectively.
Water samples were collected from wells in a 50 ml sample collection bottles. Analyses of physiochemical parameters were done on the collection day according to the standard methods of APHA for the examination of water and waste water while the remaining samples were kept in the refrigerator for heavy metals analysis according to the conventional method of Aqua regia [3].
Determination of pH of the water samples
Fifty (50) mls of water sample was poured into a clean glass beaker for the analysis of pH and the pH electrode meter was dipped into the sample for about 3 minutes to take the readings. pH level of the sample was read from the pH monitor.
Determination of temperature of the water samples
Temperature was measured insitu using mercury in glass thermometer.
Turbidity determination
With the aid of Pasteur pipette, 20 ml of the water sample was taken and transfer into a clean glass cuvette, the cuvette was then insert into the turbidity meter. The machine was blank with a control and there after the result was determined.
Determination of electrical conductivity of the water samples
Electrical conductivity was measured by measuring 50 mls of water sample from the well and this was poured into a clean glass beaker, conductivity meter was dipped into the sample and left for about 3 minutes to take the readings. Electrical Conductivity level of the sample was observed on the conductivity meter monitor.
Determination of oxidation reduction potential of the water samples
Oxidation Reduction Potential (ORP) was determined by measuring 50 mls of water sample into a clean glass beaker, ORP meter electrode was dipped into the sample for about 3 minutes to take the readings. ORP level of the sample was observed on the ORP meter monitor.
Determination of nitrate content of the water samples
About 20 ml of water sample was pipetted and transferred into clean universal bottle and one sachet of nitrate powder was added to the sample and the bottles were covered and shake vigorously. Nitrate tablet was also added to the sample and it was crushed to dissolve in the universal bottle. The bottles were covered again and shake vigorously and it was later placed on a bench for it to settle down. About 10 ml of clear water was poured from the universal bottle into a clean glass cuvette. One tablet of nitrate reagent (Nitricol) was added to the sample in the cuvette and then crushed to dissolve. It was allowed to stand for 10 mins for full colour development. Photometer was blanked and the samples were then placed in the machine and readings were taken.
Determination of nitrite content of the water samples
About 10 ml of water sample was pipette and transfer into clean universal bottle and one sachet of nitrate powder was added to the sample and the bottle was covered and shaken vigorously. It was allowed to stand for 10 mins for full colour development. Photometer was blanked and the samples were then placed in the machine and readings were taken.
Analysis of the metal content in the water samples
About 10 ml of water sample was measured into a beaker and 1 ml of concentrated nitric acid was added to it. This was concentrated on a water bath for few minutes in the beaker, filtered into a 10 ml volumetric flask and made up to mark with deionized water. The concentrations of heavy metals in the sample were determined using flame atomic absorption spectrophotometer as described by aqua regia.
Statistical analysis
Data generated were subjected to Analysis of Variance (ANOVA) using SPSS version 24 package and means were subjected to Duncan multiple range test in cases of significant differences.
Below table shows physico chemical parameters of the studied area. Temperature range was between 27.30°C-27.50°C there is no significant difference in the temperatures among the locations. There is no significant difference in the pH of the control and site 3 while sites 1 and 2 are also the same. Site 1 was the most turbid (7.49) while site 2 was the least turbid (1.38). Total Dissolved Solid (TDS) was the lowest at site 3(213 mg/l) and highest at site 2 (270.70). The Electrical Conductivity ranged was between 3.15 and 401.00 S/m. The highest conductivity was found (Table 1).
| Parameters | Control | Site 1 | Site 2 | Site 3 |
|---|---|---|---|---|
| Temp (°C) | 27.50a | 27.30a | 27.30a | 27.30a |
| pH | 6.75a | 5.62b | 5.56b | 6.75a |
| Turbidity (NTU) | 2.58c | 7.49a | 1.38d | 2.99a |
| TDS (mg/l) | 243.68b | 418c | 270.70a | 213d |
| EC (S/m) | 361.00b | 619c | 401.00a | 315d |
Table 1: Physico-chemical parameters of the well water.
Means with the same letters along the role are not significantly different at p ≤ 0.05.
TDS=Total Dissolved Solids.
EC=Electrical Conductivity.
From the below (Table 2), the concentrations of Cadmium and Lead in the samples were Not Detected (ND) in all the samples. Sodium was the highest (819.00 mg/l) followed by control (410.00 mg/l) and the least is site 3. Calcium in the samples range from 40.00 mg/l-102.00 mg/l, with the highest (102.00) Calcium.
| Parameters | Control (mg/l) | Site 1(mg/l) | Site 2(mg/l) | Site 3(mg/l) |
|---|---|---|---|---|
| Cadmium (Cd) | ND | ND | ND | ND |
| Sodium (Na) | 410.00b | 819.00a | 381.00c | 322.00d |
| Lead (Pb) | ND | ND | ND | ND |
| Calcium (Ca) | 40.00c | 102.00a | 70.00b | 74.00b |
Table 2: Heavy metal contents of the well water sampled.
Means with the same letters (superscript) along the role are not significantly different at p ≤ 0.05.
ND=Not Detected.
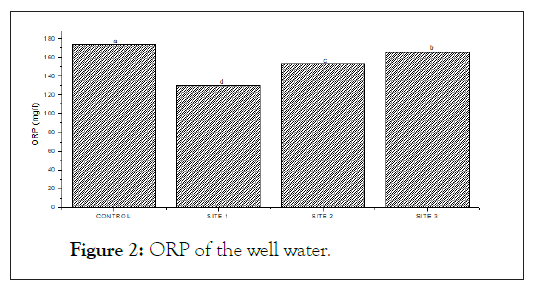
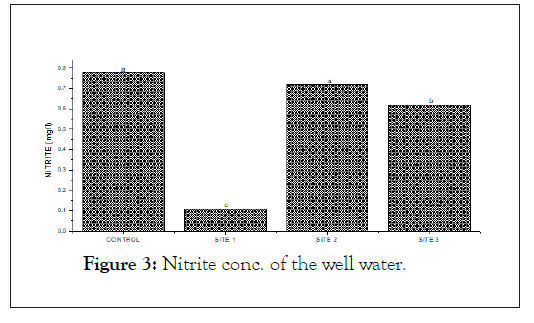
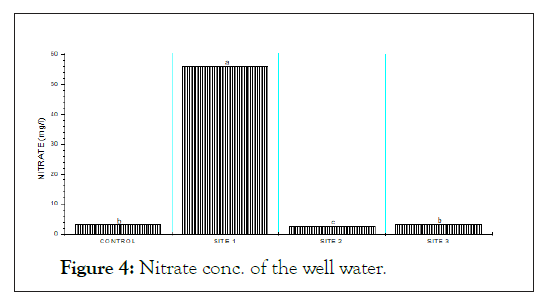
The below (Figures 2, 3 and 4) show the ORP, Nitrite and Nitrate concentrations of the well water. Oxidation Reduction Potential (ORP) ranges from 130.40 from 174.20 mg/l with the highest ORP found at the control site. Nitrite level in the studied sample ranges from 0.11 mg/l-0.78 mg/l and the highest found at the control site. Nitrate was highest (55.90 mg/l) at site 1 and lowest (2.60 mg/l).

Figure 2: ORP of the well water.

Figure 3: Nitrite conc. of the well water.

Figure 4: Nitrate conc. of the well water.
ORP=Oxidation Reduction Potential.
Temperature of the water sample
The temperatures recorded in this experiment ranged from 27.30°C-27.50°C. This was found to be above the range of the World Health Organisation (WHO) standard of 25°C for domestic water hence indicating the presence of foreign bodies like biodegradable and non-biodegradable materials coming from the anthropogenic activities of man. High temperature in their study on groundwater quality near municipal Landfill in Lagos. They reported high temperature which was an indication of the presence of active microorganisms which eventually resulted in the temperature increase.
pH of the water sample
The pH of drinking water refers to the hydrogen found in water and it is not always classified because it is believed to be secondary contaminants which could have implications on the aesthetic properties of water. The pH from this study ranged from 5.62-6.75 and this shows that the water is mildly acidic and is an indication that the incidence of toxic metals in the samples is high. This falls within the permissible range of 6.5-8.5 for the World Health Organization standard (WHO) for safe water and this confirms the acidic nature of some of the well water [4]. The acidic nature of the water samples could be a pointer to the presence of heavy metals as remarked that though 7.0 is neutral, up to 9.2 may be tolerated provided that microbiological monitoring indicated no deterioration in bacteriological quality of water. In addition, when animals are fed with water of pH below 4, redness and irritation of the eyes could be the resultant effects.
Turbidity of the water sample
Turbidity in drinking water is caused by particulate matter which may be present as a result of insufficient filtration from water sources. These particulates can shield microorganisms from disinfection effects and can promote the growth of bacteria [5]. In all cases where water is disinfected, turbidity value must be small so that the disinfection can be successful so that water becomes colourless, odourless, tasteless, and free from toxic and pathogenic organisms which are also fit for consumption. High turbidity values are normally responsible for the presence of suspended particles and other materials. Similar high turbidity value has also been stated as suggesting that the wells could be unlined hence the high values in some of the samples. Soil particles from unstable side walls may have found their ways into the wells there by increasing the turbidity of the wells. In addition; there is no sanitary value for safe turbidity of water [6]. However, successful disinfection should be below 5.0 NTU. A few samples from the tests have their turbidity value below the appropriate value. Some forms of primary treatment such as flocculation and coagulation therefore need to be carried out on these sources of water before any further disinfection treatment can be carried out, otherwise high turbidity values will shield the pathogenic organisms from chemicals and make the treatment ineffective.
Total dissolved solid of the water sample
Total dissolved solid in this research does not have a particular trend because some samples had extremely low TDS while others were moderately high. It has been posited by several authors that low or elevated value of TDS does not have anything to do with safety of the water for consumption and domestic usage but may affect the aesthetic properties of water such as colour and taste [7]. TDS has been divided into two aspects: the aspects that deals with health issues and the other aspects deals with taste, colour, odour, foaming and staining capabilities. In addition there is no standard for the primary aspects while 500 mg/L is the set standards for secondary TDS. The range of values in this research is still within the permissible level of TDS for safe drinking water.
Electrical conductivity (S/m) of the water sample
Electrical conductivity is the ease of which materials in water sample which is made up of electrolytes enables free flow of electricity through the ions [8]. The Nigerian drinking water quality standard has defined a maximum permissible conductivity level of 1000 (S/m) and any EC level above this can present a health risk of defective endocrine functions as well as total brain damage with prolonged exposure. The water samples recorded values within the recommended limit for safe drinking water.
Nitrate and nitrite content of the water sample
Nitrate is a nitrogenous compound and if found in excess in our drinking water can reduce the oxygen capacity of blood, shortness of breath and blueness of skin. The Nigerian drinking water quality standard set nitrate at 10 mg/L and nitrite at 50 mg/l. In cases of high incidence of nitrite with values greater than the recommended, this can lead to a health condition known as methaemoglobinaemia in children associated with and if it is in adult can increase the risk of stomach cancer [9]. High nitrate concentrations in shallow groundwater may be due to other agrochemical uses possibly resulting from poor sanitation. High concentrations of nitrates in potable waters also point to pollution. Water sources with high nitrate levels should therefore be tested for bacterial properties.
Nitrate which is the most oxidized type of nitrogen compound is generally found in both surface and underground waters since it is as a result of organic nitrogen decomposition through aerobic means [10]. Unpolluted natural waters usually contain only minute nitrate amounts. Nitrates and nitrites had values ranging from 2.60 mg/l-55.90 mg/l and from 0.11 mg/l-0.78 mg/1 showing significant pollution level in the water samples.
Water with nitrite concentrations greater than 1.0 mg/l should not be consumed as drinking water. The range of values of both nitrate and nitrites is still within the permissible level by WHO and USEPA. Conclusively, it is evident from the results presented in this research that all the examined parameters were within the recommended doses by World Health Organisation standards for safe drinking water. In addition further treatment of the water samples is recommended to ascertain the level of leachate in Osogbo, Osun State, Nigeria.
Citation: Mariam AAG, Gabriel KO, Veronica AI, Susan BO (2021) Assessment of the Effect of Leachates on Ground Water Supplies in Selected Locations in Osogbo, Osun State, Nigeria. J Oceanogr Mar Res. 9:229
Received: 07-Jul-2021 Accepted: 21-Jul-2021 Published: 28-Jul-2021
Copyright: © 2021 Mariam AAG, et al. This is an open-access article distributed under the terms of the Creative Commons Attribution License, which permits unrestricted use, distribution, and reproduction in any medium, provided the original author and source are credited