Journal of Pollution Effects & Control
Open Access
ISSN: 2375-4397
ISSN: 2375-4397
Research Article - (2023)Volume 11, Issue 3
Science laboratories are dynamic environments affected by both microbial load and indoor air quality from the occupants’ activities. Management at Bayero university Kano faces a challenge when it comes to maintaining satisfactory air quality in the laboratories. Regular monitoring is, therefore, necessary to evaluate air control effectiveness and to detect the irregular introduction of airborne microorganisms via occupants, and or the transmission through equipment and laboratory materials. The principal aim of this study is to assess the microbial quality of the air in some selected laboratories at the old campus of Bayero university Kano by measuring indoor bacterial and fungal loads. Samples were collected from eight selected laboratories by setting exposed plates for 10 minutes. Bacteria were then incubated at 37°C for 24 hours, and fungi at 28°C for 1-5 days. Based on the results, it is evident that penicilium (20.9%) and Streptococcus pneumoniae (34.1%) were the most prevalent species in all the case study laboratories. Due to this, pneumonia related diseases have a high risk of spreading. There were high to very high levels of bacterial and fungal contamination in all eight laboratories. A good personnel hygiene practice can be utilized to reduce the microbial burden within laboratory environments.
Indoor air quality; Science laboratory; Microbial contamination; Streptococcus pneumoniae; Penicilium
Nowadays, most human activities take place indoors in an enclosed environment with chemically diverse and complex air quality. The quality of indoor air is widely recognized as a major risk factor affecting public health in low-income, middle-income, and high-income countries. In addition to being a vehicle for human pathogens, indoor air has also been identified as a source of pathogens transmitted through the air. There are hundreds of pathogens that grow indoors, especially when the conditions are favorable, constituting about 5%-34% of indoor air pollution [1]. It has been shown that microbial contaminants can result in respiratory symptoms, allergies, asthma, and immune reactions. In addition, human activities such as talking, sneezing, coughing, walking, and washing can release airborne biological particulates. A variety of fungal spores can infect the air through household items such as food, plants, flower pots, textiles, carpets, wood material and furniture stuffing and can equally promote microbial growth.
The proliferation of microorganisms in educational buildings such as libraries, research centers, classrooms, and other special laboratories is linked to indoor air pollution [2]. A laboratory is one of the most important indoor places, where many scientists spend most of their time. Therefore, the air quality of the laboratory should be minimum in terms of the number of microbial contaminations. The air quality of indoor environments is one of the main factors affecting the health, well-being and productivity of scientists. Airborne microbial contamination is thought to be primarily caused by the activity of people and equipment in indoor environments. Especially, the presence of harmful microbes in the air should be avoided as much as possible. Microorganisms present in air quality in educational settings affect the health of learners and consequently their learning performance.
Quantification of the risks associated with air contamination essentially involves the quantification and identification of the airborne physio-chemical and biological pollutants. For instance, Hayleeyesus and Manaye evaluated indoor air quality using colony-forming counts in eight different libraries at Jimma university. Bacteria and fungi were found to be a major problem in most libraries. Similarly, Awad, et al., determined microbiological air quality in public buildings in Egypt which included libraries, faculties, schools, child daycare centers and hospitals and its association with microclimatic conditions, Particulate Matter (PM) and ventilation type [3]. Rumchev, et al., evaluation of indoor air quality of science laboratories at Curtin university of technology in Australia indicates that levels of pollutants and comfort variables were significantly higher in the semester compared to the break. A comparison between fungi and bacteria by Lv, et al., reveals substantial differences in the density distributions at different sampling points. Furthermore, microbial contamination associated with dust and particles in the air is more serious than that on air conditioning filters. The results obtained by Asif, et al., showed higher fungal levels as compared to bacterial concentrations at most of the sampling locations. In a similar comparative study, Xie, et al., reveals the concentration of TAMs (Total Airborne Microbes) at various air quality levels which indicated that the concentration of TAMs showed significant seasonal variation. According to Enitan, et al., no matter what time of day it is, the indoor environment allows aerosols to build-up in the classroom which may contribute to the spread of infections. A study conducted by Byrne, et al., assessed the microbial quality of the air in a pork processing plant shows bacteria have a much higher density than fungi, and the distributions of densities at different sampling points differ greatly. Considering the above findings, airborne microorganism composition is building-specific based on micro environmental factors and geographical location, and should receive special attention to ensure a healthy indoor air quality that is free from infections.
Buildings used as science laboratories are dynamic environments affected by seasonal changes, weather, indoor ventilation, outdoor microbial load, and occupant numbers. Achieving satisfactory air quality within the indoor environment is therefore a challenge that must be addressed. This reinforces the need for well-designed experimental investigations and robust test protocols to evaluate potential means of indoor air decontamination as thoroughly as possible. Science laboratories at Bayero university Kano have not previously investigated for indoor microbial air quality, so the topic is poorly understood [4]. Thus, it's imperative to quantify airborne microorganisms in the case study laboratories in order to identify indoor pollution concentrations and link them to health problems. A comprehensive understanding of indoor airborne microorganisms can help predict risks and suggest prevention strategies. This study aimed to assess the microbial quality of the air in some laboratories at the old campus of Bayero university Kano which involve quantification of bacterial and fungal loads in indoor to identify factors that may contribute to increasing or decreasing air-borne contamination. In particular, the objectives of this work are:
• To screen the air space of eight selected laboratories on the
old campus of Bayero university Kano for suspended microbial
contaminants.
• To enumerate the microorganisms airborne with respect to
bacteria and fungi only and to relate the counts with the
temperature conditions of the laboratories.
• To compare the results obtained with the available microbial
air contamination standard limit.
Site locations and sampling description
Bayero university is a public university established in 1960 by the Northern Nigeria ministry of education to prepare senior secondary certificate holders for G.C.E. In 1975, the college became a university college and was renamed Bayero university. It has two campuses which are in Kano city, Nigeria (120 03′N, 80 32′E) with over 30,000 students and 4,000 staff. The case study includes eight laboratories of Bayero university old campus, namely; microbiology level IV, microbiology level III, biology level IV, physics level I, multipurpose chemistry, biochemistry, plant biology level IV, and biology PG laboratories [5]. The number of samples was determined based on the maximum number of occupants, workbenches as well as types of activities performed in the laboratory. Assessment of airborne bacteria and fungi was performed in eight science laboratories located in the old campus of Bayero university The selected laboratories are microbiology level IV, microbiology level III, biology level IV, physics level I, multipurpose chemistry, biochemistry, plant biology level IV, and biology PG laboratories which were labelled as laboratory A, B, C, D, E, F, G, and H respectively. A brief overview of each sampling location is given in Table 1.
| Designation | Laboratories | Sampling points |
|---|---|---|
| A | Microbiology level IV | A1, A2 |
| B | Microbiology level III | B1, B2 |
| C | Biology level IV | C1, C2 |
| D | Physics level I | D1, D2 |
| E | Multipurpose chemistry | E1, E2 |
| F | Biochemistry, plant | F1, F2 |
| G | Plant biology level IV | G1, G2 |
| H | Biology PG |
Table 1: Details of sampling locations of laboratories.
Experimental design and sampling procedure
The study was conducted in December, 2019. A walkthrough investigation was conducted to determine the laboratory characteristics and sampling sites. The eight laboratories selected for indoor air quality assessment differed based on their distinct characteristics in terms of location, activity, and function. These laboratories were assumed to represent the laboratory environments in the faculty of life sciences of Bayero University Kano (BUK) old campus, Nigeria. A duplicate sample was collected at each measurement location of eight laboratories before and during peak occupancy hours with the permission of laboratory management [6]. After sampling, all plates were incubated in the department of microbiology (Figure 1). Air samples were taken from each of the lab rooms by passive methods described in the next paragraph. Although settle plates are very limited in their application yet they are capable of monitoring viable biological particles that sediment out of the air and settle onto a surface over the time of exposure. In this study, passive monitoring is conducted using standard Petri dishes containing culture media (15 ml) that are opened and exposed for a specified duration at a height of 1.5 m from the ground for the representative of breathing zone and then incubated to allow visible colonies to develop and be counted.
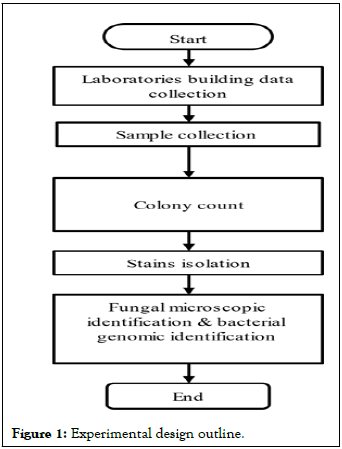
Figure 1: Experimental design outline.
The detailed procedure for all the considered laboratories is outlined as follows:
Nutrient agar and potato dextrose agar were used for bacteria and fungi respectively. After exposure, the plates were covered with their lids and taken to the microbiology laboratory and incubated at 37°C for 24 hours and at room temperature for 72 hours-120 hours respectively for bacteria and fungi [7].
After incubation, the total number of CFU was counted and sub-cultured onto likewise fungal colonies were sub-cultured onto a new fresh medium in order to obtain a pure culture. Different types of colonies were noted and differentiated visually by their shape, size, color, elevation, texture, and margins while fugal features include their color, shape, and spores. Cell Morphology was determined by using the gram staining method. The slides were observed by using a microscope (Figure 2).
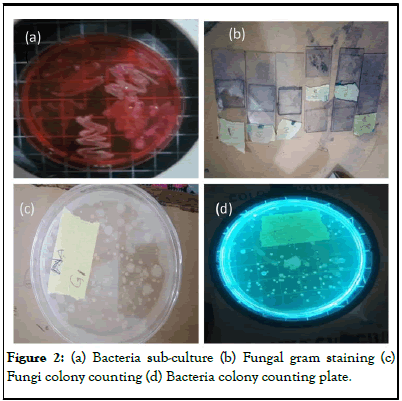
Figure 2: (a) Bacteria sub-culture (b) Fungal gram staining (c) Fungi colony counting (d) Bacteria colony counting plate.
Bacteria are identified by their gram staining, colour, shape and arrangement. Fungal strains were then identified by preparing wet mount slide of methalin bluea and observing micromorphological features [8]. Additionally, bacterial colonies were identified on basis of their biochemical characterization using indole, MR VP, citrate, oxidase coagulase and motility tests and their microscopic appearance after gram staining (Tables 2-4).
The CFU values obtained by the passive method were converted to their respective IMA values. The CFU values were modified and expressed as CFU/m3 using Omeliansky’s formula:
N=5a × 104 (bt)
Where;
N=UFC/m3 of air in the internal environment.
a=Number of colonies per petri dish.
b=Petri dish surface (in cm2).
t=Time of exposure, in minutes.
The microbial quality of the air was then graded using established standard guidelines in Table 2. Assessment of IAQ from the studies is presented on a daily average and compared to the ECC standard.
| Group of microbes | Range of values (CFU/m3) | Pollution degree |
|---|---|---|
| Bacteria | <50 | Very small |
| 50-100 | Small | |
| 100-500 | Medium | |
| 500-2000 | High | |
| >2000 | Very high | |
| Fungi | <25 | Very small |
| 25-100 | Small | |
| 100-500 | Medium | |
| 500-2000 | High | |
| >2000 | Very high |
Table 2: Evaluation of air quality according to the sanitary standards for non-industrial premises.
| Fungi | Culture | Microscopy |
|---|---|---|
| Penicilium | Bluish green | Bush arrangement with dense conidiosphores of phialospore. |
| Aspergilus | Bluish green with sulfur yellow areas on the surface. | Biserite conidial heads. |
| Microsporum | Colonies are bright golden yellow to brown reverse pigmentation with cottony surface. | Microconidia are typically spindle shaped cell and have terminal knob. |
| Alternaria | Greenish black surface with gray periphery on reverse site. | Chains of microconidia. |
| Trichoderms | Green colony. | Chains of microcondia resemble penicilium microspically. |
| Poleospora | Green surface with brown to black colony. | Flask shaped fruiting bodies called pseudothecia. |
| Trichothecium | Flat suecle like powder initially white becoming rosy pink with age. | Conidiosphore with regressive conidia. |
Table 3: Colonial morphology of fungi isolated.
| Microscopic morphology | Biochemical test | Bacterial colonies | ||||||
|---|---|---|---|---|---|---|---|---|
| Cat | Co | I | MB | VP | CIT | O | ||
| Cocci | + | + | - | + | + | + | - | Staphylococcus aureus |
| Rod | + | - | + | + | - | - | - | Staphylococcus epidermis |
| Rod | + | - | - | - | - | - | - | Pneumonia |
| Rod | + | - | + | klebsiella | ||||
| Cocci | + | - | - | - | + | + | - | Escherichia coli |
| Cocci | - | - | - | - | - | - | - | Staphylococcus pseudomunas |
| Rod | + | - | - | - | + | + | - | Enterobacter |
| Presence (+) Absence (-) | ||||||||
Table 4: Microscopic and biochemical characteristic of bacteria isolated.
Overall microbial concentration
The microbial loads recorded before peak occupancy was generally lower than those recorded during peak occupancy hours. These results can be attributed to the fact that there were more activities carried out during peak occupancy than before peak occupancy of the laboratory during the period of this study. From Table 5, it can be seen that the microbial load of bacteria enumerated before peak occupancy had a minimum, maximum, range and mean value of 1.95 CFU/m3 × 102 CFU/m3, 5.75 CFU/m3 × 102 CFU/m3, 1.95-5.75 CFU/m3 ×102 CFU/m3 and 3.79 CFU/m3 × 102 CFU/m3 respectively. It can be said to be less than that of the occupancy period with the minimum value (3.65 CFU/m3 × 102 CFU/m3), maximum value (2.227 CFU/m3 × 103 CFU/m3), range (3.65-22.27 CFU/m3 × 102 CFU/m3) and mean value (9.15 CFU/m3 × 102 CFU/m3). Similarly, the microbial load of fungi recorded before peak occupancy had a minimum, maximum, range, and mean value of 1.73 CFU/m3 × 102 CFU/m3, 7.73 CFU/m3 × 102 CFU/m3, 1.73-7.73 CFU/m3 × 102 CFU/m3 and 3.68 CFU/m3 × 102 CFU/m3 respectively. It can be said to be less than that of the occupancy period with the minimum value (2.01 CFU/m3 × 102 CFU/m3), maximum value (1.135 CFU/m3 × 103 CFU/m3), range (2.01-11.35 CFU/m3 × 102 CFU/m3) and mean value (7.77 CFU/m3 × 102 CFU/m3).
| Laboratory | Collecting points | Temperature (°C) | Concentration (× 102 CPU/m3) | |||
|---|---|---|---|---|---|---|
| Bacteria | Fungus | |||||
| A | A1 | 31 | 4.74 | G4 | 6.17 | G4 |
| A2 | 35 | 22.27 | G5 | 11.06 | G4 | |
| B | B1 | 29 | 5.75 | G4 | 7.33 | G4 |
| B2 | 33 | 16.38 | G4 | 11.35 | G4 | |
| C | C1 | 28 | 4.6 | G3 | 4.74 | G3 |
| C2 | 32 | 5.02 | G4 | 9.19 | G4 | |
| D | D1 | 23 | 3.02 | G3 | 2.87 | G4 |
| D2 | 25 | 10.2 | G4 | 6.61 | G3 | |
| E | E1 | 27 | 3.88 | G3 | 2.44 | G3 |
| E2 | 30 | 4.89 | G3 | 8.05 | G4 | |
| F | F1 | 25 | 3.25 | G3 | 1.73 | G3 |
| F2 | 28 | 3.65 | G3 | 2.01 | G3 | |
| G | G1 | 24 | 3.13 | G3 | 1.73 | G3 |
| G2 | 28 | 5.47 | G4 | 8.05 | G4 | |
| H | H1 | 23 | 1.95 | G3 | 2.44 | G3 |
| H2 | 25 | 5.34 | G4 | 5.17 | G4 | |
| Note: 1: Before peak occupancy; 2: During peak occupancy; CPU/m3: Colony forming unit per meter cube; G3: Medium concentration; G4: High concentration; G5: Very high concentration | ||||||
Table 5: Airborne microbial concentrations in the eight laboratories of Bayero university old campus.
Microbiological contamination rates
Since there is no precise legislation on the microbiological quality of the air in Nigeria, the European Community Commission (ECC) which proposed eight different categories to evaluate the level of microbial contamination in the indoor air of non-industrial environments is adopted for comparison in this current study [9]. Going by the ECC standard and grouping, the indoor air of the Bayero university laboratories shows an intermediate, high, and very high (G3, G4 and G5) of microbial contamination as contamination levels of bacteria while fungi recorded in the laboratory fall in the range of G3 and G4 (medium and high) level of microbial contamination (Table 6).
| Groups of microbes | Range of values (CFU/m3) | Pollution degree | Location |
|---|---|---|---|
| Bacteria | |||
| G1 | <50 | Very small | |
| G2 | 50-100 | Small | |
| G3 | 100-500 | Medium | A1,C1,D1,E1,E2,F1,F2,G1, and H1 |
| G4 | 500-2000 | High | B1,B2,C2,D2,G2 and H2 |
| G5 | >2000 | Very high | A2 |
| Fungi | |||
| G1 | Very small | ||
| G2 | <25 | Small | |
| G3 | 25-100 | Medium | C1,D1,E1,F1,F2,G1 and G2 |
| G4 | 100-500 | High | |
| G5 | >2000 | Very high | A1,A2,B1,B2,C2,D2,E2,G2 and H2 |
Table 6: Air microbial evaluation according ECC 1993.
Microbial diversity
In the eight monitored laboratories, Penicillium spp. was the predominant isolate found. In addition to 20.9%, Aspergillus spp. (16.3%), Saccharomyces (18.6%), Microsporum (11.6%), Chapetomium (7%), Alterneria (4.7%), and Cladosporium spp. (2.1%), there were also 11.6% and 11.6%, respectively. Penicillium spp. was found as a predominant fungal isolate in the indoor environment. High levels of Penicillium spp. represent dampness inside laboratories and are considered opportunistic pathogens for humans and commonly linked to allergies, rhinitis, asthma, and conjunctivitis. The microorganisms also pose the potential for causing sick building syndromesThe most prevalent species of gram positive bacteria were Firmicutes cocci [10]. Four of the seven isolated species were cocci, while three were Bacilli. According to Figure 3, Staphylococcus aureus, Staphylococcus epidermis, Streptococcus pneumoniae, Klebsiella pneumoniae, Escherichia coli, Enterobacter and Pseudomonas were all identified as bacterial species. Among the eight species identified, there were Aspergilus, Penicillium, Cladosporium, Alterneria, Microsporum, Saccharomyces, Chaetemium, and Cladosporium [11-14].
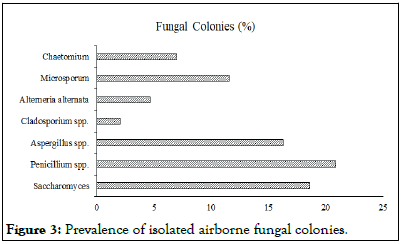
Figure 3: Prevalence of isolated airborne fungal colonies.
Figure 4 shows that the most isolated bacteria are Staphylococcus pneumonia (34.1%), Escherichia coli (18.6%), with Pseudomonas (11.4%), Enterobacter (11.4%), Staphylococcus aureus (11.4%), Staphylococcus epidermis (9.1%), and Klebsiella (9.1%) being the smallest. Gram positive cocci from saprophytic microflora are the most prevalent bacteria isolated in indoor air, and they are generally associated with human skin and mucosa. This suggests that the major source of bacterial contamination is the presence of humans.
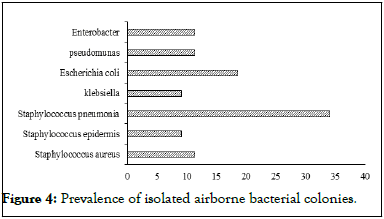
Figure 4: Prevalence of isolated airborne bacterial colonies.
Statistical analysis of micro environmental conditions
SPSS (Statistical Package for Social Sciences), software version 22.0, was used for the analysis of the data summarized in Table 7 [15]. Figure 5 revealed that the temperature record ranged within 23°C-35°C with the mean value of 30°C, highest mean temperature was recorded in microbiology level IV during the peak occupancy period (35°C), while the lowest mean temperature value was recorded in biology PG laboratory before occupancy period (23°C).
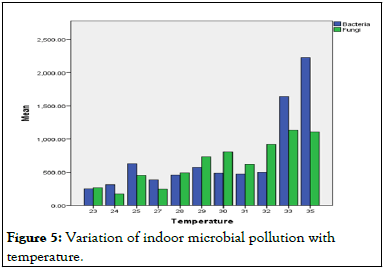
Figure 5: Variation of indoor microbial pollution with temperature.
To determine whether temperature affects microbial concentrations, linear regression model was used. A Spearman's correlation coefficient was applied to correlate temperature with microbial density. Probabilities less than or equal to P<0.01 were considered significant (Table 7).
| Temperature | Bacteria | Fungi | |
|---|---|---|---|
| Valid | 16 | 16 | 16 |
| Missing | 0 | 0 | 0 |
| Mean | 27.88 | 647.125 | 568.375 |
| Std. error of mean | 0.908 | 136.0396 | 82.45791 |
| Median | 28 | 481.5 | 567 |
| Mode | 25a | 195.00a | 173.00a |
| Std. deviation | 3.631 | 544.1583 | 329.8317 |
| Variance | 13.183 | 296108.3 | 108788.9 |
| Range | 12 | 2032 | 962 |
| Minimum | 23 | 195 | 173 |
| Maximum | 35 | 2227 | 1135 |
| Sum | 446 | 10354 | 9094 |
| Note: a: Multiple modes exist. The smallest value is shown. | |||
Table 7: Descriptive statistics.
In Table 8, a reasonable range of correlations was found between temperature and airborne microorganisms. For bacteria, the correlation was (r=0.70, p<.001), while for fungi it was (r=0.77, p<0.001). Pearson correlation results showed a significant positive relationship between bacteria and fungi (r=0.84, p<.001), as shown in Figure 5. While bacteria prefer high temperatures and humidity, fungi prefer low temperatures and high humidity.
| Correlation | Temperature | Bacteria | Fungi | ||
|---|---|---|---|---|---|
| Spearman's rho | Temperature | Correlation coefficient | 1 | 0.700** | 0.771** |
| Sig. (2-tailed) | 0.003 | 0 | |||
| N | 16 | 16 | 16 | ||
| Bacteria | Correlation coefficient | 0.700** | 1 | 0.847** | |
| Sig. (2-tailed) | 0.003 | 0 | |||
| N | 16 | 16 | 16 | ||
| Fungi | Correlation coefficient | 0.771** | 0.847** | 1 | |
| Sig. (2-tailed) | 0 | 0 | |||
| N | 16 | 16 | 16 | ||
| **Correlation is significant at the 0.01 level (2-tailed). | |||||
Table 8: Correlations.
This quantitative investigation on the air quality in the case example laboratories is the first study of its kind at Bayero university Kano [16]. Assessment of the air quality in the designated areas on the premises of the laboratories at Bayero university was based on the sanitary standards for non-industrial premises formulated by the 1993 European commission. In the present study, colony-forming count was used to assessing indoor air quality in eight different laboratories using both bacterial and fungal media. Generally, borne microbial concentration and composition varied depending on the type of the laboratory and the highest microbial concentrations were found in the densely populated and naturally ventilated laboratories. The results indicate that microbial load is higher during peak occupancy, which can be explained by the activities that occur in the laboratory such as coughing, sneezing, talking, irregular and infrequent cleaning at the time of the investigation. At the peak occupancy period, microbiology laboratory IV recorded the highest number of microbial airborne contaminants. The biochemistry lab has the least microbial air contamination during peak occupancy period. The number of occupants contributes significantly to the quantity of air microbial. Increasing the temperature slightly influences the multiplication of airborne microbes. There is also a positive correlation between the survival of microbes in the air and the temperature of the room. Microbial concentrations increase as the number of occupants.
Overall, the density of the air microbial flora in the laboratories investigated was generally within the range of high to very high concentrations. Microbiological analysis of the air in most laboratories evaluated revealed ranges from high to very high levels of fungi and bacteria contamination. Penicilium (20.9%) and Streptococcus pneumoniae (34.1%) were found to be the most common of the 13 genera isolated. They are hence identified as the most frequent bioindicators for the presence of the laboratories investigated. These microorganisms can also be used as bioindicators.
Some useful practices that can reduce harmful air microbial effects which include a thorough hygiene-training program for laboratory personnel to reduce contamination from the occupants. Secondly, keeping indoor environments as healthy as possible requires controlling those factors, particularly temperature that favors the growth and multiplication of microbes. To meet the requirements of the current and future student population, Bayero university must expand its laboratories.
The authors declare that they have no known competing financial interests or personal relationships that could have appeared to influence the work reported in this paper.
All authors contributed equally in the preparation of this manuscript.
The author(s) declared no potential conflicts of interest with respect to the research, authorship, and/or publication of this article.
The author(s) received no financial support for the research, authorship, and/or publication of this article.
[Crossref] [Google Scholar] [PubMed]
[Crossref] [Google Scholar] [PubMed]
[Crossref] [Google Scholar] [PubMed]
[Crossref] [Google Scholar] [PubMed]
[Crossref] [Google Scholar] [PubMed]
[Crossref] [Google Scholar] [PubMed]
[Crossref] [Google Scholar] [PubMed]
Citation: Alfanda AM, Mas’ud M, Mas’ud F (2023) Assessment of the Microbial Quality of Air in Some Science Laboratories of Bayero University Kano Old Campus-Nigeria. J Pollut Eff Cont. 11:378.
Received: 10-Dec-2022, Manuscript No. JPE-22-20761; Editor assigned: 14-Dec-2022, Pre QC No. JPE-22-20761 (PQ); Reviewed: 28-Dec-2022, QC No. JPE-22-20761; Revised: 21-Mar-2023, Manuscript No. JPE-22-20761 (R); Published: 29-Sep-2023 , DOI: 10.35248/2375-4397.23.11.378
Copyright: © 2023 Alfanda AM, et al. This is an open-access article distributed under the terms of the Creative Commons Attribution License, which permits unrestricted use, distribution, and reproduction in any medium, provided the original author and source are credited.