Journal of Clinical Trials
Open Access
ISSN: 2167-0870

ISSN: 2167-0870
Research Article - (2020)Volume 10, Issue 2
Background: HF biomarkers have growing importance in daily clinical practice as well as in clinical trials. Several biomarkers are used for diagnosis and prognosis of HF patients. Recently, Galectine-3 has been proposed for diagnosis and prognosis of HF. In this study we aimed to determine the relationship between galectine-3 level and cardiac functions in patients with chronic heart failure and its correlation with clinical manifestations. Methods: The current study enrolled 90 patients with chronic heart failure and then divided according to ejection fraction (EF) into two groups , group I included 60 patients with clinical manifestation of HF and EF <50%, group II included patients with clinical manifestation of HF and EF >50%.serum levels of Galectine-3 were measured in all patients with heart failure. Results: Level of galectine-3 was significantly increasing with advancing in NYHA classes [p value <0.001), while it had insignificant negative correlation with ejection fraction (r=0.06; P=0.51) and the Level of galactin-3 was significantly increasing with advancing in diastolic dysfunction grade (P= <0.001) Conclusion: Plasma galectine-3 concentration can be used as a biomarker to aid in clinical staging and severity of heart failure.
Galactin-3; Heart failure; Ejection fraction
Heart Failure (HF) remains one of the most prevalent and challenging medical conditions. Despite guideline – based therapy, HF is associated with high morbidity and mortality rates; such a way that 80% of men and 70% of women aged 65 years or above die within 8 years after the initial diagnosis. HF is also one of the most costly medical conditions [1]. This deleterious condition is associated with progressive ventricular dysfunction and cardiac remodeling [2]. Changes in cardiac structure and function often occur before the symptoms appear, resulting in difficulty in prediction of clinical outcomes. Thus, many patients require specialized imaging techniques, such as cardiac magnetic resonance imaging, which are not always available [3]. Risk factors, such as age, diabetes, and smoking, and severity of symptom are indicative of at risk patients, but are not enough to risk stratify patients [4]. The disease may even progress in the patients who are under treatment; therefore, it is necessary to monitor these patients during the course of treatment. HF biomarkers have growing importance in daily clinical practice as well as in clinical trials. Biomarkers can help in monitoring of response to therapy, prediction of patients outcome in clinical practice, and appropriate patient stratification [5]. Several biomarkers are used for diagnosis and prognosis of HF patients. Recently, Galectine-3 has been proposed for diagnosis and prognosis of HF patients. Galectine-3 is a product of active macrophages and plays a pivotal role in pathogenesis of remodeling, including inflammation and fibrosis in HF patients [6] so in this study we aimed to determine the relationship between galectine-3 level and left ventricular cardiac functions in patient with chronic heart failure and its correlation with clinical picture.
Our study enrolled 120 patients who were recruited from the Cardiology Department of Aswan University Hospital during the period from June 2017 to January 2019. All the patients had chronic heart failure NYHA class (I-IV). patients with permanent pacemaker, non-sinus rhythm, Congenital heart disease with left to right shunt, Chronic obstructive pulmonary disease, Chronic renal failure, Connective tissue disease, Previous history of pulmonary embolism and Hyperthyroidism were excluded from the study then patients divided into two groups according to EF, group I included 60 patients with clinical manifestation of HF and EF <50% and group II included 30 patients with clinical manifestation of HF and EF >50%.
All the patients were subjected to
A. Clinical assessment including: (Signs and symptoms of heart failure and detection of cardiovascular risk factors such as DM, hypertension, age and positive family history).
Twelve leads resting ECG were done for all patients to detect rhythm, detect any ischemic changes or arrhythmias.
Images was obtained with left lateral decubitus using Philips Healthcare (Philips xmatrix iE 33).data acquisition was done in parasternal and apical views using (X5-1) transducer. Standard M-mode, 2D, and Doppler blood flow measurements were performed. LV end-diastolic volume and EF were calculated by Simpson biplane method from apical imaging planes [7]. Cardiac chamber volumes were indexed to body surface area.
Pulsed Doppler was used to record transmitral flow in the apical 4-chamber view [8]. Sample volume was placed at the tips of mitral valve leaflets. Peak early diastolic flow velocity (E), peak flow velocity of atrial contraction (A), and their ratio (E/A) were measure at their maximum amplitude. Pulsed-wave tissue Doppler (PW-TDI) early diastolic annular velocities (E′) were acquired at the septal and lateral annular sites. The ratio between transmitral (E) velocity and (E′) velocity (E/E′) was calculated.
Peripheral blood samples and plasma Gal-3 assay were gathered and collected in test tubes containing Ethylene diamine tetra acetic Acid [EDTA) and heparin send to hospital LAB for these assay:
Random blood glucose: Glycaemia was determined with the method of glucose oxidase.
Renal function: Serum Creatinine, BUN and calculate creatinine clearance using Cockcroft-Gault formula (Bauer C et al., 2008)
Lipid profile: Cholesterol and triglycerides were determined utilizing a standard enzymatic process. HDL was determined enzymatically after the precipitations of the other lipoproteins with dextran magnesium sulphate.
Plasma Gal-3 assay: The EDTA blood sample was centrifuged 1000 xg for 15 minutes and plasma was frozen at -20 c. Plasma concentrations of Gal-3 were detected by an enzyme-linked immunosorbent assay kit [Bioscience American). Procedure and calibration of assay was performed according to the manufacturer's protocol [6].
Briefly, plasma Gal-3 was bound to the anti-Gal-3 antibody, that was adsorbed into micro-well plates and was captured with a secondary antibody anti-Gal-3 bio-tilinated [Sandwich method), that was revealed through the HRP-streptavidin exposed to TMB substrate. The colorimetric reaction was measured at 450 nm using an enzyme-linked immunosorbent assay [ELISA) plate reader. Measurements were performed in duplicate and the results were averaged. The standard curve ranged between 0.47 ng/ml to 30.00 ng/ml. The limit of detection was 0.99 ng/ml and the reproducibility coefficient of variation of intra-assay and inter-assay were 3.3% and 6.8% respectively [9].
E. Statistical analysis The data were tested for normality using the Anderson-Darling test and for homogeneity variances prior to further statistical analysis. Categorical variables were described by number and percent [N, %), where continuous variables described by mean and standard deviation [Mean, SD]. Chi-square test and fisher exact test used to compare between categorical variables where compare between continuous variables by t-test and Independent-Samples T test ANOVA. A two-tailed p<0.05 was considered statistically significant. We are used person and spearman correlation to appear the association between variables. All analyses were performed with the IBM SPSS 20.0 software (The IBM Corp).
Our study enrolled 90 patients who were recruited from the Cardiology Department of Aswan University Hospital during the period from June 2017 to January 2019, All the patients had chronic heart failure NYHA class (I-IV) then patients divided into two groups, group I included 60 patients with manifestation of HF and EF <50% and group II included 30 patients with HF manifestation and EF >50%. The mean age of studied group I patients was 61.78 ± 8.53 years and mean age of group II was 61.53 ± 6.82. Majority (55.6%) of studied patients was male (Table 1). It was noticed that both groups of patients had no significant difference regarding demographic characteristics, risk factors and symptoms (NYHA class) (p value>0.05) (Table 1). On the other hand, there was a significant difference according E/Ea (27.76 ± 8.06 vs. 20.11 ± 10.38 ng/ml; p<0.00) and galectine-3 level be tween the two groups (13.96 ± 4.01 vs. 10.80 ± 4.86; p< 0.001) Table 1).
| Variables | Group I | Group II | p value |
|---|---|---|---|
| Age (years) | 61.78 ± 8.53 | 61.53 ± 6.82 | 0.88 |
| Sex | 32 (53.3%) | 18 (60%) | |
| Male | 28 (46.7%) | 12 (40%) | 0.35 |
| Female | |||
| Diabetes mellitus | 35 (58.3%) | 21 (70%) | 0.2 |
| Hypertension | 36 (60%) | 17 (56.7%) | 0.46 |
| Dyslipidemia | 37 (61.7%) | 17 (56.7%) | 0.4 |
| Smoking | 32 (53.3%) | 13 (43.3%) | 0.25 |
| Family history | 34 (56.7%) | 18 (60%) | 0.47 |
| Body mass index [kg/m2] | 27.08 ± 2.42 | 28.53 ± 3.53 | 0.25 |
| Ischemic heart disease | 41 (68.3%) | 15 (50%) | 0.07 |
| NYHA class | 0.45 | ||
| I | 15 (25%) | 0 | |
| II | |||
| III | 16 (26.7%) | 5 (16.7%) | |
| IV | |||
| 20 (33.3%) | 12 (40%) | ||
| 9 (15%) | 13 (43.3%) | ||
| E/Ea | 13.96 ± 4.01 | 10.80 ± 4.86 | <0.001 |
| Galactine 3 (ng/ml) | 27.76 ± 8.06 | 20.11 ± 10.38 | <0.001 |
Table 1: Demographic data of study groups.
Data was expressed in form of frequency (percentage), mean (SD). N= number, P value was significant if< 0.05 NYHA:New York heart association, E/Ea= The ratio between transmitral) velocity and septal annular (Ea) velocity.
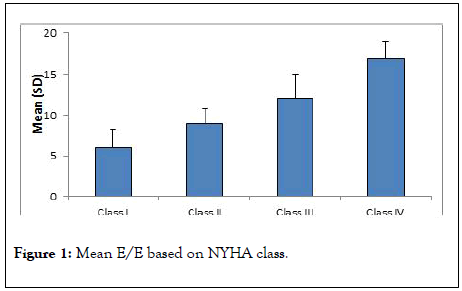
It was noticed that there was a significant correlation between NYHA class and E/Ea, E/Ea was significantly higher among patients with NYHA class IV (17.54 ± 2.34) and class III (12.84 ± 3.69) in comparison to those with class II (mean 9.30 ± 1.83) and I (mean 5.87 ± 2.36), p value 0.001 (Figure 1).

Figure 1: Mean E/E based on NYHA class.
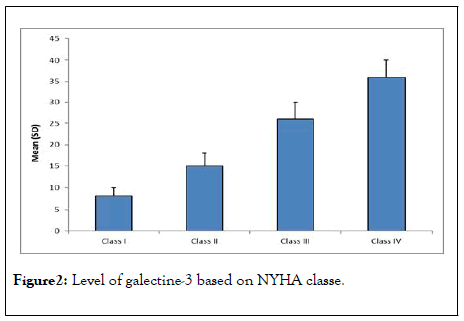
Also there was a significant correlation between galectine 3 and NYHA class. Level of galectine-3 was significantly increasing with advancing in NYHA class where patients with NYHA class I had least level of galectine-3 (mean 8.40 ± 2.46 ng/ml) while patients with NYHA class IV had the highest level (mean 35.18 ± 5.16 ng/ml), p value 0.001 (Figure 2).

Figure 2: Level of galectine-3 based on NYHA classe.
In our study we found that galectine-3 had strong significant positive correlation with E/Ea (r= 0.90; P< 0.001) (Table 2), while there was no significant correlation with ejection fraction (r=0.07; P= 0.49) (Table 2).
| Correlation of galactin-3 with | ||
|---|---|---|
| r | p value | |
| EF | 0.07 | 0.49 |
| E/Ea | 0.9 | <0.001 |
Data expressed as r value (strength of correlation) and P value (significance of correlation). P value was significant if <0.05
Table 2:Corr elation be tw een Galectine- 3, E/Ea and EF in s tudy patients.
Level of galectine-3 is not affected with the associated risk factors in the patients. As shown in (Table 3), There is no correlation between (DM, dyslipidemia, smoking, family history, IHD and hypertension) and level of galactin-3, P value <0.05 Table 3.
| P value | No | Yes | Risk factors |
|---|---|---|---|
| 0.1 | 20.90 ± 10.43 | 24.41 ± 9.94 | Smoking |
| 0.44 | 23.73 ± 10.15 | 22.01 ± 10.40 | Diabetes mellitus |
| 0.06 | 19.94 ± 9.92 | 24.55 ± 10.19 | Hypertension |
| 0.82 | 22.36 ± 8.80 | 22.85 ± 11.24 | Dyslipidaemia |
| 0.87 | 22.45 ± 10.85 | 22.81 ± 9.95 | Family history |
| 0.31 | 24.07 ± 11.01 | 21.80 ± 9.81 | Ischemic heart disease |
Data expressed as mean (SD). P value was significant <0.05
Table 3: Correlation of galectine 3 with CV risk factors.
Our observations revealed that Galectine-3 can predict the symptoms of heart failure (NYHA) with sensitivity 98% and specificity 94% at cut off point 20ng/ml, (Table 4), it also could predict impaired filling pressure (E/Ea) with sensitivity 91% and specificity 100%, (Table 5). On the other hand, ejection fraction cannot predict neither the severity of symptoms nor the filling pressure in patients with heart failure (Tables 4 and 5).
| Indices | Galactine 3 | LVEF |
|---|---|---|
| Sensitivity | 98.15% | 46.3% |
| Specificity | 94.4% | 86.11% |
| Positive predictive value | 96.4% | 83.3% |
| Negative predictive value | 97.1% | 51.7% |
| Accuracy | 96.7% | 62.2% |
| Cut off point | 20.9 ng/ml | 50% |
| Area under curve | 0.954 | 0.54 |
| P value | <0.001 | <0.001 |
P value was significant if <0.05. CI: Confidence Interval; LVEF: left Ventricular Ejection
Table 4: Accuracy of gelectin-3 and LVEF in diagnosis of advanced NYHA class.
| Indices | Galactine 3 | LVEF |
|---|---|---|
| Sensitivity | 91% | 41% |
| Specificity | 100% | 100% |
| Positive predictive value | 100% | 100% |
| Negative predictive value | 68% | 25% |
| Accuracy 92.2% 51.1% | 92.20% | 51.10% |
| Cut off point | 11.5 ng/ml | > 49% |
| Area under curve | 0.98 | 0.41 |
| P value | 0.001 | 0.09 |
P value was significant if <0.05. CI: confidence interval; LVEF: left ventricular ejection fraction
Table 5: Accuracy of galectine-3 and LVEF in prediction of E/Ea grade.
This study aimed to determine the relationship between Galectine-3 levels and the echocardiographic indices corresponding to various stages of LVEF. At the outset, Gal-3 has been proved to be effective in the diagnosis of patients suffering from diastolic dysfunction. This study provides useful information corroborating the association between LV structure, LV filling pressures (E/Aratio) and the varying degrees of diastolic dysfunction with Gal-3 level, essentially mirroring the hypothesized link between cardiac fibrosis, hypertrophy, and evolving heart failure.
The main findings of our study is the significant correlation between level of Gal 3 with severity of symptoms in patients with heart failure and with the filling pressure (diastolic dysfunction) E/Ea (r= 0.90; P<0.001), which highlights the diagnostic and suspected prognostic significance of level of Gal 3 in patient with CHF independent on their systolic function, we also found more significant correlation between Gal 3 and E/Ea' (r= 0.70; P<0.001), and NYHA class. This findings are in consistent with [10], which found that The mean level of galectine-3 in blood plasma in the group with CHF and preserved EF was significantly higher than in the group with CHF and reduced EF so they suggest that Galectine-3 can be used as a diagnostic biomarker primarily in patients with HFrEF and HFpEF. In agreement with our findings, Hakan et al. [11], reported also a positive correlation between plasma galectine 3 concentration and clinical NYHA stage-i.e, as the clinical stage of disease increases, the galectine-3 level also increases. Thus, they suggested that plasma galectine-3 concentration can be used as a biomarker to aid clinical staging and severity assessment of heart failure. Currently, the potential mechanisms underlying the potential prognostic role of galectine-3 in AHF remain unclear. Pathophysiologically, galectine-3 is a beta- galactoside – binding lectin that can be secreted by macrophages, monocytes, and epithelial cells [12]. Galectine-3 has been confirmed to mediate myocardial fibrosis, ventricular remodeling, and cardiac oxidative stress and ischemia-related damages induced by hypertension, diabetes, and coronary artery diseases [13-15]. In cardiomyocytes and animal models of cardiovascular diseases, inhibition of galectine-3 was shown to exert therapeutic efficacy by attenuation of ventricular remodeling and myocardial apoptosis [16].
We also demonstrated that there was no significant correlation between Gal 3 and systolic function (r=-0.07; P= 0.49). This results is in consistence with a survey conducted by Wilson et al. [17] on the patients with coronary disease which demonstrated the lack of a strong relation between galectine-3 and echocardiographic measurements of cardiac structure and function in chronic stable systolic HF.
The study results suggested plasma galectine-3 concentration can be used as a biomarker to aid clinical staging and severity assessment of heart failure.
Citation: Elsaughier SM, Salama MK, Hanafy A, Ahmed M, Ibrahim AM (2020) Assessment of the Relationship between Galectine-3 and Cardiac Functions in Patients with Chronic Heart Failure. J Clin Trials 10:408. doi: 10.35248/2167-0870.20.10.408
Received: 20-Mar-2020 Accepted: 03-Apr-2020 Published: 10-Apr-2020 , DOI: 10.35248/2167-0870.20.10.408
Copyright: © 2020 Elsaughier SM, et al. This is an open-access article distributed under the terms of the Creative Commons Attribution License, which permits unrestricted use, distribution, and reproduction in any medium, provided the original author and source are credited.