Journal of Oceanography and Marine Research
Open Access
ISSN: 2572-3103
+44 1300 500008
ISSN: 2572-3103
+44 1300 500008
Research Article - (2022)Volume 10, Issue 3
The current situation of energy demand around the world is highly unbalanced due to the diminution of conventional energy sources such as coal, fossil fuels, and nuclear energy sources. It is essential to employ renewable and pollution free green energy resources as replacement to the conventional ones. The wave energy (ocean energy) is a promising renewable and green energy resource. In the present study Wave Power assessment at Ullal coast, Karnataka for South West monsoon, June to September 2005 is presented. The wind and wave dataset for a year 2005 was obtained from ESSO-INCOIS. The third-generation spectral wave model MIKE 21 SW is used to simulate wave transformation from offshore to the near shore. The model is calibrated with the measured dataset near Ullal coast, Karnataka and the correlation coefficient of 0.89991 is found. The temporal and spatial distribution of wave power was obtained. From these wave energy potential maps, locations for detailed analysis of available wave energy were identified. Three beaches Subhashnagar, Mogaveera patna and Kotepura, adversely affected by severe wave attack are considered for the further analysis. It is found that the average wave power in SW monsoon at 6 m depth and 9 m depth at these locations is of the order of 17 kW/m and 21 kW/m respectively. This estimate is quite comparable with the wave energy potential of the probable wave energy sites on the west coast of India such as Kanhangad, Kudal, Pawas, etc. With the installation of Wave energy converters, wave energy reaching the coast is reduced significantly. The coastal erosion will remain under control. Dual purpose of wave Energy extraction and coastal protection can be achieved by installing suitable wave energy converters at the site.
Wave energy; Renewable energy; Coastal protection; Numerical modeling
Renewable energy resources are the most interested and discussed about over the recent decades due to the growing need of energy, depletion of coal and fossil fuel resources, environmental pollution and related risks, etc. Amongst solar energy, wind energy, ocean energy etc., wave energy (ocean energy) is the promising source of energy which is capable to satisfy energy demands across the globe. The wave energy is in the cleanliest form having no hazardous effects on environment and is eco-friendly, pollution free green energy resource. As waves are never going to cease, wave energy is continuous and easily predictable. Wave energy is suitable for countries having vast coastline [1-10]. As waves are created by winds blowing over a fetch of a sea, energy is concentrated and as a result waves are more energy dense than wind. Also as compared to wind energy, waves are advantageous in terms of easy predictability and less land area requirement. A detailed analysis of the wave energy potential is required at the site for development of the wave power generation project. Various researches took place to assess global wave energy potential. The global wave power potential is estimated to be 3.7 TW. It was also found that the largest wave power levels occur off the western coasts of the continents and also seasonality is much higher in the northern hemisphere. Such global model will offer an overall idea regarding the wave energy distribution. But for the detailed study of wave energy potential, it is necessary to consider local wind system, changes in the wave energy due to bathymetry and seasonal and temporal variation. Various attempts were made to calculate wave energy resources using field data and available satellite altimeter measurements. From such studies it was found that field data was very reliable and give precise results. The wave rider buoys need to be deployed for several years at probable sites where high waves are present. This is costly and long durational process. Also, assessment of wave power potential cannot be possible at locations where visual observations are unavailable. To overcome these difficulties, numerical models were used widely for wave energy potential calculation [11-23].
Numerical model provides adequate freedom for wave energy potential calculation based upon spatial and temporal variability. Numerous researchers used numerical models to assess wave energy potential among various places in world. Third generation spectral wave models like SWAN, MIKE 21 SW are used for wave energy potential assessment in the various locations around the world [24-32]. It is discovered that the reduction in the wave power while waves travelling from offshore to near shore is mainly because of the refraction phenomenon. It was also found that due to tides, low to medium wave energy sides will be more affected as compared to high energy sites having higher wave period. In India also assessment of wave energy potential along Indian coast was done by. The location near Vizhinjam, Kerala found to be the most suitable location for the wave energy converter installation where the average annual wave power was found to be 13 kW/m. it was also found that west coast of India is having more wave power that of east coast of India and 83%-85% of the annual average wave power occurs during south west monsoon at west coast of India. At some locations along the near shore areas, the wave attack is very high and significant erosion takes place. Researchers assessed wave energy potential along various locations and concluded that installation of wave energy converters will fulfill dual purpose of wave energy extraction as well as coastal protection [33-40].
In this paper the spatial and temporal assessment of wave energy potential for South West Monsoon for year 2005 is reported. The wave characteristics and wave energy were obtained from the simulation with the calibrated numerical model. Three locations near Ullal, Karnataka are considered for study where high erosion took place in recent years and wave energy assessment done for the same.
Measured wind and wave data
The wind and wave data were collected from Earth System Science Organization-Indian National Centre for Ocean Information Services, Hyderabad (ESSO-INCOIS). The data is measured using offshore moored buoy OB03 and the inshore moored buoy SW04 deployed by NIOT, India located at longitude 72.07 Latitude 12.48 and longitude 74.78 latitude 12.94 respectively off Ullal. The wind speed, wind direction from records of the buoy OB03 was used for wind forcing in numerical modeling. The wave period, wave height and wave direction data from records of the buoy OB03 was used to calibrate the model and for calculation of wave power. The measured wave data at buoy SW04 was used to calibrate simulated wave data and for determining correlation coefficient. The classification of wave climate in Arabian sea consists three seasons, pre-monsoon (February-May), southwest monsoon (June-September) and northeast monsoon (October-January). The very high wave activity is observed during southwest monsoon and relatively calm condition during rest of the year [41-50].
Numerical model simulation
Numerical model: The reported study describes the model setup using MIKE 21 modeling system developed by DHI water and environment. MIKE 21 SW is a new generation spectral wind-wave model based on unstructured meshes. Simulation of the growth, decay and transformation of wind generated waves and swells in offshore and coastal areas are done by the model.
Model setup: In order to assess wave energy potential at Ullal (Figure 1) a large domain including the offshore moored buoy location is selected. The data for bathymetry is obtained from Jeppesen charts extracted using MIKE C-Map. The selected stretch for assessment of wave energy potential extends from 11°3’N to 14°29’N in latitude and 72°36’ E to 75°51’E in longitude as shown in (Figure 2) and (Figure 3).
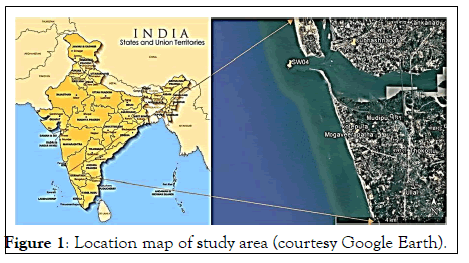
Figure 1: Location map of study area (courtesy Google Earth).
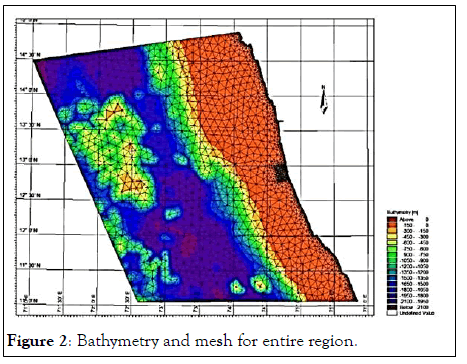
Figure 2: Bathymetry and mesh for entire region.
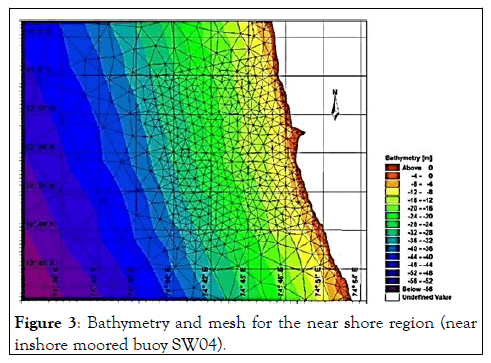
Figure 3: Bathymetry and mesh for the near shore region (near inshore moored buoy SW04).
The three locations which are more erosion prone shown in (Figure 1) are considered for detail study namely Subhashnagar (lat 12.85° long 74.84°), Mogaveerapatna (lat 12.82° long 74.83°) and Kotepura (lat 12.82° long 74.84°). The bathymetry of 415 km by 392 km off Ullal from the depth of -1968 m to the near shore was discretized by unstructured flexible mesh with 3428 nodes and 5974 elements prepared. The wave transformation from offshore to near shore is studied using model. The wave and wind data parameters of the offshore moored buoy OB03 were given to model as input parameters. The model was calibrated against the wave height time series of the near shore moored buoy SW04. The time period for calibration chosen was from 16 September 2005 to 30 September 2005 [51]. For the calibration parameter, white capping is used. The comparison of simulated and the measured wave height time series for white capping parameter 2.5 is shown in (Figure 4). The measured and simulated significant wave height correlated well with correlation coefficient 0.89. This validated the numerical model.
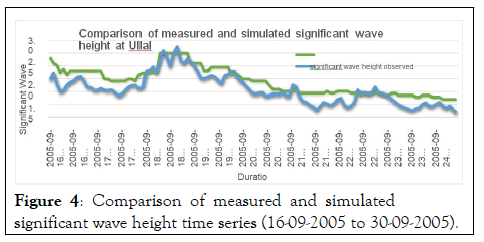
Figure 4: Comparison of measured and simulated significant wave height time series (16-09-2005 to 30-09-2005).
Numerical model results
The wave vector plot showing the spatial distribution of wave height and wave direction at 15 July 2005 at 12.00 and 15 September 2005 at 12.00 for the region near Ullal is shown in (Figure 5 and Figure 6). The model was run using the wind time series and wave as input for the period 1 June 2005 to 30 September 2005 (southwest monsoon). The results obtained from model were used to calculate wave power potential at the three considered locations.
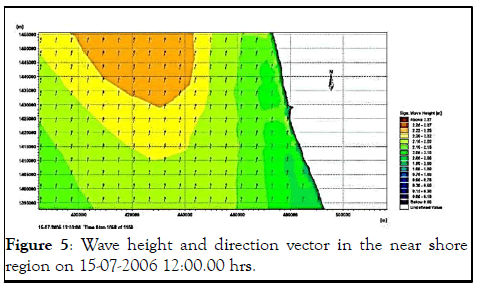
Figure 5: Wave height and direction vector in the near shore region on 15-07-2006 12:00.00 hrs.
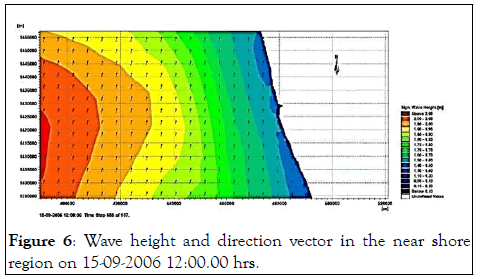
Figure 6: Wave height and direction vector in the near shore region on 15-09-2006 12:00.00 hrs.
Three beaches Subhashnagar, Mogaveera patna and Kotepura, where tourism was adversely affected are considered for the further analysis (Table 1). The time series of the simulated wave power and wave heights at the locations are extracted.
| Locations | Coordinates of Locations | Coordinates of extraction points |
|---|---|---|
| Subhashnagar | Lat-12.850413°, Long-74.839815° | Lat-12.850413°, Long-74.8225° |
| Mogaveerapatna | Lat-12.822882°, Long-74838506° | Lat-12.822882°, Long-74.8369° |
| Kotepura | Lat-12.820811°, Long-74.839971° | Lat-12.820811°, Long-74.8375° |
Table 1: Location details of the selected points investigated.
Wave power plots for the near shore spatial domain at 15 June 2005 and 15 August 2005 are presented in the (Figure 7).
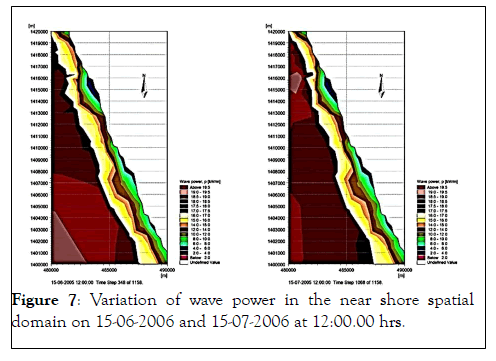
Figure 7: Variation of wave power in the near shore spatial domain on 15-06-2006 and 15-07-2006 at 12:00.00 hrs.
Average wave power at these locations for 6 m and 9 m depths are obtained and are presented in the (Table 2). It is observed that the average wave power in SW monsoon at 6 m depth and 9 m depth at these locations found is of the order of 17 kW/m and 21 kW/m respectively. This estimate is quite comparable with the wave energy potential of the probable wave energy sites on the west coast of India such as Kanhangad, Kudal, Pawas, etc.
| Average Wave power at 3 locations in SW Monsoon in kW/m | ||
|---|---|---|
| Location | 6 m depth | 9 m depth |
| Subhashnagar | 16.83276 | 20.96797 |
| Mogaveerapatna | 17.68081 | 21.115 |
| Kotepura | 17.85408 | 21.11089 |
Table 2: Average wave power at 3 locations at 6 m and 9 m depth.
The monthly average wave power in southwest monsoon for three locations is presented in chart format in (Figure 8). It can be seen that the July month is more energy dense followed by August, June and September.
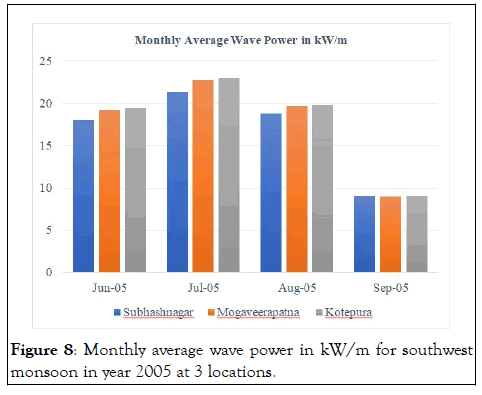
Figure 8: Monthly average wave power in kW/m for southwest monsoon in year 2005 at 3 locations.
Wave energy is a capable renewable energy resource, having great future scope for exploitation. In present study assessment of wave energy potential along erosion prone coast at Ullal, Karnataka was estimated using third generation spectral wave model MIKE 21 SW and the measured wave data. The results obtained were analysed for variation of wave power potential in southwest monsoon (June-September) for year 2005. The three locations Subhashnagar, Mogaveerapatna and Kotepura are chosen for detailed study as in recent years these locations experienced severe erosion. It is found that the average wave power in SW monsoon at 6 m depth and 9 m depth at these locations is of the order of 17 kW/m and 21 kW/m respectively Considering the wave power assessment, wave power extraction is feasible at all these locations. If conditions near Ullal are conductive to install wave energy converters, the dual purpose of wave energy extraction and coastal protection will be served.
The author would like to thank Earth System Science Organization- Indian National Centre for Ocean Information Services (ESSO-INCOIS), Hyderabad for providing wave and wind data and Director Central Water and Power Research Station (CW&PRS), Pune for providing essential facilities to carry out work.
Citation: Dhawade A, Barve K, Ranganath LR, Dixit P, (2022) Assessment of Wave Energy Potential Along the Erosion Prone Coast at Ullal, Karnataka. J Oceanogr Mar Res. 10:252.
Received: 16-Apr-2022, Manuscript No. OCN-22-16904 ; Editor assigned: 18-Apr-2022, Pre QC No. OCN-22-16904 (PQ); Reviewed: 02-May-2022, QC No. OCN-22-16904 ; Revised: 16-Jun-2022, Manuscript No. OCN-22-16904 (R); Published: 23-Jun-2022 , DOI: 10.35248/2572-3103.22.10.252
Copyright: © 2022 Dhawade A, et al. This is an open-access article distributed under the terms of the Creative Commons Attribution License, which permits unrestricted use, distribution, and reproduction in any medium, provided the original author and source are credited.