Journal of Thyroid Disorders & Therapy
Open Access
ISSN: 2167-7948
![]() +44 1300 500008
+44 1300 500008
ISSN: 2167-7948
![]() +44 1300 500008
+44 1300 500008
Research Article - (2013) Volume 2, Issue 2
Background: Leukocytosis is an independent prognostic factor for anaplastic thyroid carcinoma (ATC). In the present study, the potential causes of leukocytosis in ATC were analyzed.
Methods: This study involved 22 patients with histologic or cytologic evidence of ATC, as well as papillary thyroid carcinoma (PTC), between June 2000 and October 2009. Samples were obtained from ATC patients before treatment. The xMAP serum assay for 17 cytokines [IL-1β, IL-2, IL-4, IL-5, IL-6, IL-7, IL-8, IL-10, IL-12, IL-13, and IL-17, TNF-α, IFN-γ, GM-CSF, G-CSF, MIP-1β, and MCP-1] and IHC from surgical specimens were performed.
Results: WBC was ≥ 10000/mm3 in 9 (41%) and G-CSF was ≥ 100 pg/ml in 4 (18%) ATC cases. The G-CSF level showed a positive correlation with the WBC count in ATC cases (r=0.78). Both G-CSF and G-CSFR protein expressions were seen on immunohistochemical staining in 50% (5/10) and 70% (7/10) of ATC cases, respectively. Serum IL-6, IL-7, IL-8, IL-12, IL-17, MCP-1, TNF-α, and G-CSF concentrations were significantly higher in ATC than in PTC. WBC and G-CSF (r=0.61) had a positive correlation (>0.6). Patients with leukocytosis (n=9) had a poorer survival rate than those with WBC<10000/mm3 (p=0.0002). Similarly, patients with G-CSF ≥ 100 pg/ml had a poorer survival rate than those with G-CSF <100 pg/ml (p=0.0107).
Conclusion: Leukocytosis and a high G-CSF level before treatment are linked to poor prognosis in ATC patients.
<Keywords: Anaplastic thyroid carcinoma; Prognostic factor; Leukocytosis; Granulocyte Colony Stimulating Factor (G-CSF); Cytokine
Anaplastic thyroid carcinoma (ATC) is considered to be one of the most aggressive malignancies; it is known to have a poor prognosis and be resistant to conventional chemotherapy/radiotherapy. The prognosis of thyroid carcinoma varies: ‘indolent’ well-differentiated papillary (PTC) and follicular thyroid carcinomas have a 30-year mortality rate of approximately 6%; poorly differentiated thyroid carcinoma has a 60% 5-year survival rate; and ATC, which is very aggressive, is always fatal in a few months from the date of diagnosis [1]. Despite multimodal therapy including surgery, chemotherapy, and radiotherapy, ATC grows rapidly, with a mean survival of 6 months after diagnosis [2].
Investigators [3-9] have reported that several factors influence the clinical course of ATC, including age, sex, tumor size, extent of disease, resectability, the presence of acute symptoms, and leukocytosis. Sugitani et al. [9] reviewed their series of 47 patients over 33 years and developed a novel prognostic index. Their prognostic index was based on a combination of risk factors, such as the presence of acute symptoms, tumor>5 cm, distant metastasis, and white blood cell (WBC) count ≥ 10000/mm3.
We have reported that leukocytosis (WBC ≥ 10000/mm3) is an independent prognostic factor for ATC [10]. This finding has led us to elucidate the mechanism of leukocytosis associated with the biological properties of ATC.
It has been reported that patients with specific subtypes known to have an absolutely fatal prognosis occasionally showed severe leukocytosis or hypercalcemia [11]. Studies [12,13] have demonstrated that some specific subtypes of ATCs produce growth factors and cytokines, including granulocyte colony-stimulating factor (G-CSF) and parathyroid hormone-related protein (PTH-rP). Tumor cells express and produce angiogenic factors, such as VEGF, basic fibroblast growth factor (bFGF), platelet-derived growth factor (PDGF), IL- 6, IL-8 and other cytokines, such as MCP-1, G-CSF, M-CSF, tumor necrosis factor-α (TNF-α), IL-1a, and IL-1h [14-16]. However, the detailed mechanisms of the leukocytosis induced in ATC have not been clarified. We hypothesized that G-CSF was one of the causes of leukocytosis based on case reports [11,17] of an ATC patient with leukocytosis caused by G-CSF production. In the present study, 17 cytokines, including G-CSF, were analyzed in blood sera of ATC patients and PTC patients. The correlation between leukocytosis and G-CSF production was also analyzed.
Patient Selection
This study involved 22 patients with histologic or cytologic evidence of ATC, as well as PTC, seen between June 2000 and October 2009 at the Department of Surgery, Iwate Medical University. Continued 15 patients of PTC in 2009 were recruited as control group. Healthy control’s sample was from 10 volunteers (5 men and 5 women between 20 and 60 years old) who were carefully screened for cancer. All patients were adults (age>20 years) who gave their written informed consent according to the Institutional Review Board requirements. No data allowing the identification of patients were provided throughout the study.
Collection and Storage of Blood Serum
Ten mL of peripheral blood were drawn from each of the subjects using standardized phlebotomy procedures. Handling and processing were identical for all patients. Samples were obtained from ATC patients before treatment and from healthy individuals. Blood samples were collected with anticoagulant. Sera were separated by centrifugation, and all specimens were immediately aliquoted, frozen, and stored in a dedicated -80°C freezer.
Multiplex Analysis
The xMAP (Luminex Corp.) is a technology that combines the principle of a sandwich immunoassay and fluorescent bead-based method in a single microtiter plate [18]. The xMAP serum assay for 17 cytokines [IL-1β, IL-2, IL-4,IL-5, IL-6, IL-7, IL-8, IL-10, IL-12, IL- 13, IL-17, TNF-α, IFN-γ, granulocyte macrophage colony-stimulating factor (GM-CSF), G-CSF, macrophage inflammatory protein (MIP)- 1β, and MCP-1] was done in a 96-well microplate format according to the protocol of BioSource International (Camarillo, CA) as previously described [19]. The output data were analyzed using the Bio-Plex suspension array system (Bio-Rad Laboratories, Hercules, and CA).
Immunohistochemistry
In total, 10 thyroidectomy specimens were obtained from ATC patients who underwent surgery between 2003 and 2007 at the Department of Surgery, Iwate Medical University. Staining with antihuman mouse monoclonal anti-G-CSF (Calbiochem, San Diego, CA) and granulocyte colony-stimulating factor receptor (G-CSFR) (Abcam, Cambridge, UK) antibodies was performed at room temperature. Evaluation of the immunostaining was carried out by two independent observers (S.O. and Y.T.). For microscope analysis of G-CSF and G-CSFR staining, 5 high-powered fields, each of which contained more than 200 tumor cells, were selected. At least 1000 tumor cells were counted, of which over 20% of the tumor cells was positive.
Statistical analysis
Differences in serum cytokine levels were analyzed using the Wilcoxon signed-rank test. Spearman’s rank correlation was also calculated to quantify correlations between WBC counts and cytokine levels. Differences between groups by sex, acute exacerbation within the past month, extrathyroidal invasion, lymph node metastasis, synchronous distant metastasis, and survival was assessed by χ2 tests. The clinical characteristics of the patients by their survival rate were analyzed using the log-rank test. P values less than 0.05 were considered significant.
All statistical analyses were performed with a statistical package, JMP 5.0.1J for Macintosh (SAS Institute, Cary, NC, USA).
Sample Characteristics
The clinicopathological parameters are summarized in table 1. There were significant differences between ATC and PTC in age, tumor size, acute exacerbation within the past month, synchronous distant metastasis, survival time, and survival rate.
| Characteristics | ATC, n=22 | PTC, n=15 | p |
|---|---|---|---|
| Gender | |||
| Male | 10 | 3 | 0.13* |
| Female | 12 | 12 | |
| Median age, yrs | 72.18 | 57.87 | 0.0069 |
| (range) | (58-90) | (17-87) | |
| tumor size | 6.03 | 1.82 | <0.0001 |
| (range) | (3~10) | (0.05~4.6) | |
| Acute exacerbation within the past month | |||
| Present | 8 | 0 | 0.0018* |
| Absent | 14 | 15 | |
| Extrathyroidal invasion | |||
| Positive | 21 | 11 | 0.052* |
| Negative | 1 | 4 | |
| Lymph node metastasis | |||
| Positive | 19 | 10 | 0.16* |
| Negative | 3 | 5 | |
| Synchronous distant metastasis | |||
| Positive | 11 | 2 | 0.017* |
| Negative | 11 | 13 | |
| Median survival time, days | 148 | 769.5 | <0.0001 |
| (range) | (33~550) | (348~1452) | |
| Survival | |||
| Death | 19 | 0 | <0.0001* |
| Alive | 3 | 15 | |
Abbreviation: ATC, anaplastic thyroid carcinoma; PTC, papillary thyroid
carcinoma.
NOTE: *; Χ2 for rates
Table 1: Patient Characteristics of Atc and PTC.
Peripheral Blood WBC and G-CSF Levels
The WBC count was <10000/mm3 in all PTC patients, whereas the WBC count was ≥ 10000/mm3 in 9 ATC patients (41%) (Figure 1A). When a G-CSF cut-off level of 100 pg/ml was chosen, all PTC patients were negative, and 4 ATC patients (18%) were positive.
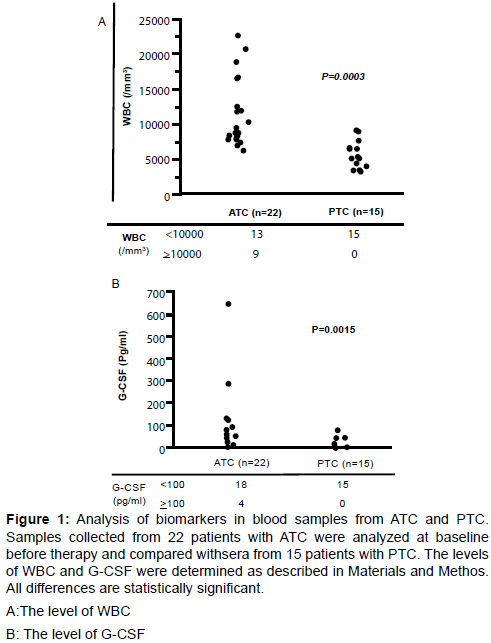
Figure 1: Analysis of biomarkers in blood samples from ATC and PTC. Samples collected from 22 patients with ATC were analyzed at baseline before therapy and compared withsera from 15 patients with PTC. The levels of WBC and G-CSF were determined as described in Materials and Methos. All differences are statistically significant.
A:The level of WBC
B: The level of G-CSF
Relationship between WBC and G-CSF Levels in ATC
The G-CSF level showed a positive correlation with the WBC count in ATC (r=0.78; Figure 2A). Among 9 patients who had WBC ≥ 10000/ mm3, 4 patients had GCSF ≥ 100 pg/ml (table 4). Of 13 patients who had WBC<10000/mm3, all had G CSF < 100 pg/ml (table 4) G-CSF and G-CSFR protein expression of the tumor on
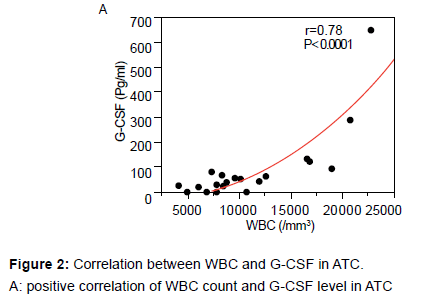
Figure 2: Correlation between WBC and G-CSF in ATC.
A: positive correlation of WBC count and G-CSF level in ATC
Immunohistological staining. G-CSF and G-CSFR positive staining was not seen with normal follicular cells. In ATC, G-CSF positivity was seen in 50% (5/10) of cases, whereas G-CSFR positivity was seen in 70% (7/10). In other words, 50% of ATC cases had expression of both G-CSF and G-CSFR. In addition, 20% of ATC cases (2/10) had expression of GCSFR without visible G-CSF expression.
Correlations among Cytokines in PTC and ATC
Serum levels of IL-2, IL-4, IL-17, IFN-g, and GM-CSF were undetectable in PTC. IL-1β, IL-2, IL-4 IL-5, IL-10, IL-13, IFN-γ, MIP- 1, and GM-CSF showed measurable serum concentrations that did not differ between PTC and ATC. Serum IL-6, IL-7, IL-8, IL-12, IL-17, MCP-1, TNF-α, and G-CSF concentrations were significantly higher in ATC than in PTC (Table 2). These data suggest that, compared with PTC, ATC has different biological properties induced by multiple serum cytokines. Factors that showed a significant difference in the univariate analysis (IL-6, IL-7, IL-8, IL-12, IL-17, MCP-1, TNF-α, and G-CSF) between ATC and PTC were selected for multivariate analysis to identify possible associations with the WBC count. The multivariate analysis in terms of correlations between individual cytokines using the Spearman rank correlation method revealed that most cytokines showed moderate correlations (Table 3). With respect to WBC count, only WBC and G-CSF (r=0.67) had a correlation >0.6, followed by IL-6 (r=0.54), IL-8 (r=0.44), and TNF-α (r=0.59) (Table 5), (Figure 3A).
| Cytokines | Healthy controls (n=10 ) |
PTC (n=9) |
ATC (n=9) |
P* |
|---|---|---|---|---|
| I L- 1 β | 0 ± 0 0 (0) |
20.5 ± 20.53 0 (0-184.7) |
33.4 ± 31.45 0 (0-284.6) |
0.59 |
| I L - 2 | 0 ± 0 0 (0) |
0 ± 0 0 (0) |
111.7 ± 111.74 0 (0-1005.7) |
0.37 |
| I L - 4 | 0 ± 0 0 (0) |
0 ± 0 0 (0) |
2.2 ± 1.95 0 (0-17.7) |
0.17 |
| I L - 5 | 0.03 ± 0.11 0 (0-0.34) |
0.8 ± 0.75 0 (0-6.8) |
5.5 ± 5.49 0 (0-49.4) |
0.68 |
| I L - 6 | 0 ± 0 0 (0) |
31.2 ± 24.90 0 (0-227.2) |
440.2 ± 207.83 251 (12.8-2012.9) |
0.002 |
| I L - 7 | 5.75 ± 3.30 4.70 (0.89-12.74) |
19.4 ± 12.42 0 (0-108.5) |
121.4 ± 35.66 71.2 (28.2-354.9) |
0.004 |
| I L - 8 | 2.39 ± 4.67 1.35 (0-15.4) |
49.8 ± 13.77 46.7 (0-112.2) |
133.9 ± 28.52 121.2 (38.5-273.7) |
0.02 |
| I L - 10 | 0 ± 0 0 (0) |
8.8 ± 5.94 2.2 (0-55.5) |
36.3 ± 26.61 12.2 (0-247.9) |
0.15 |
| I L - 12 | 0 ± 0 0 (0) |
0.7 ± 0.73 0 (0-6.6) |
16.5 ± 8.57 0.8 (0-77.7) |
0.04 |
| I L - 13 | 0 ± 0 0 (0) |
0.3 ± 0.30 0 (0-2.7) |
31.7 ±29.00 0 (0-263.5) |
0.11 |
| I L - 17 | 0 ± 0 0 (0) |
0 ± 0 0 (0) |
97.4 ± 47.94 0 (0-368.8) |
0.029 |
| IFN- γ | 0 ± 0 0 (0) |
0 ± 0 0 (0) |
174.3 ± 154.20 0 (0-1398.8) |
0.15 |
| MCP - 1 | 31.55 ± 17.44 31.90 (0-62.41) |
240.2 ± 51.26 229.3 (72.8-544.0) |
617.7 ± 134.18 447.7 (237.7-1421.1) |
0.01 |
| MIP - 1 β | 72.80 ± 32.02 64.06 (36.91-147.30) |
1030.2 ± 188.30 814.9 (262.2-1933.9) |
1997.4 ± 447.02 1794.0 (747.5-5200.1) |
0.052 |
| T N F - α | 0 ± 0 0 (0) |
9.0 ± 6.58 0 (0-57.2) |
227.8 ± 173.67 23.9 (13.8-1602.8) |
0.007 |
| G- CSF | 0 ± 0 0 (0) |
8.5 ± 8.53 0 (0-76.8) |
13.4 ± 70.80 56.0 (0-644.8) |
0.027 |
| GM- CSF | 0 ± 0 0 (0) |
0 ± 0 0 (0) |
535.5 ± 515.77 0 (0-4659.2) |
0.17 |
NOTE: Serum samples from 9 patients before treatment operation therapy and/ or chemotherapy and/or radiation therapy and 9 samples from healthy control individuals and 9 patients with PTC were screened using a 17-plex multiplexed cytokine assay. Mean ± SE (pg/mL) and median (range)
*: PTC vs ATC
Table 2: Cytokine Expression in Atc Compared With PTC and Healthy Control.
| WBC | G-CSF | IL-6 | IL-7 | IL-8 | IL-12 | IL-17 | MCP-1 | TNF-α | |
|---|---|---|---|---|---|---|---|---|---|
| WBC | 1.00 | ||||||||
| G-CSF | 0.67 | 1.00 | |||||||
| IL-6 | 0.05 | -0.10 | 1.00 | ||||||
| L-7 | 0.07 | 0.47 | 0.15 | 1.00 | |||||
| IL-8 | 0.10 | 0.15 | -0.01 | 0.37 | 1.00 | ||||
| IL-12 | -0.44 | -0.03 | 0.03 | 0.37 | 0.27 | 1.00 | |||
| IL-17 | -0.40 | -0.13 | -0.24 | 0.33 | 0.22 | 0.84 | 1.00 | ||
| MCP-1 | -0.20 | 0.05 | 0.23 | 0.53 | 0.48 | 0.39 | 0.04 | 1.00 | |
| TNF-α | 0.47 | 0.69 | 0.42 | 0.53 | 0.47 | 0.41 | 0.13 | 0.35 | 1.00 |
NOTE: Spearman correlations were utilized to examine correlations between WBC and cytokines. 0.4 <| r |≤0.7 is correlative. About WBC count, only G-CSF had a correlation >0.6; TNF-α was the other cytokines having a correlation>0.4.
Table 3: Spearman Rank Correlations.
| G-CSF(pg/ml) | Total (n) | ||
|---|---|---|---|
| ≥100 | <100 | ||
| WBC ≥10000 | 4 | 5 | 9 |
| (/mm3) <10000 | 0 | 13 | 13 |
| Total(n) | 4 | 18 | 22 |
Table 4: significant relationship was found between WBC count and G-CSF level, using χ2 test (p=0.0052).
| G-CSFR | Total | |||
|---|---|---|---|---|
| positive | negative | |||
| G- CSF | Positive | 5(3*) | 0 | 5 |
| Negative | 2(1*) | 3(1*) | 5 | |
| Total(n) | 7 | 3 | 10 | |
Table 5: ATC positive cases to G-CSF and G-CSFR immunohistochemical staining,
*the number of cases with leukocytosis.
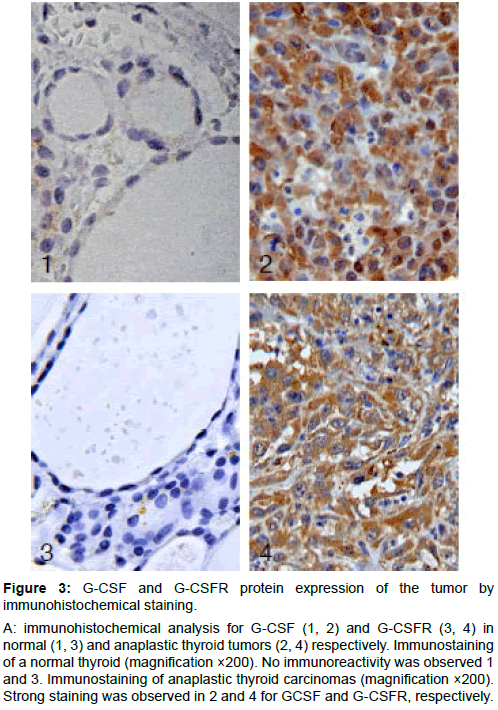
Figure 3: G-CSF and G-CSFR protein expression of the tumor by immunohistochemical staining.
A: immunohistochemical analysis for G-CSF (1, 2) and G-CSFR (3, 4) in normal (1, 3) and anaplastic thyroid tumors (2, 4) respectively. Immunostaining of a normal thyroid (magnification ×200). No immunoreactivity was observed 1 and 3. Immunostaining of anaplastic thyroid carcinomas (magnification ×200). Strong staining was observed in 2 and 4 for GCSF and G-CSFR, respectively.
Kaplan-Meier Survival Curve
Patients with leukocytosis had a poorer survival than those without (n=22, p=0.0002). Patients with leukocytosis had a significantly shorter survival time than those without. The median overall survival time was 75 ± 28 days; the 3- and 6- month survival rates were 22% and 0%, respectively (Figure 4A).
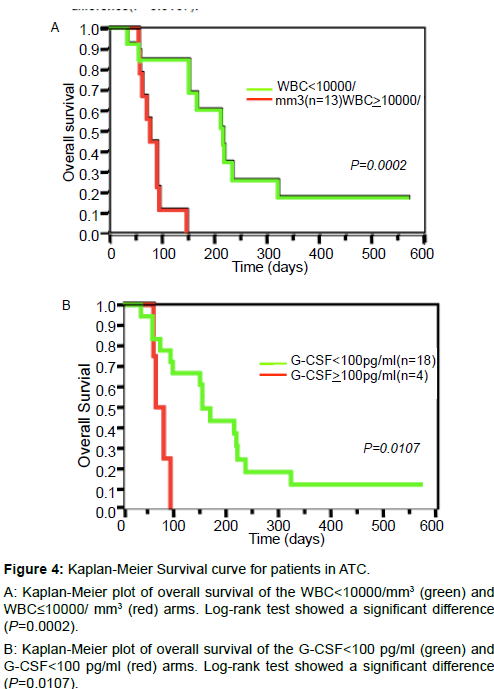
Figure 4: Kaplan-Meier Survival curve for patients in ATC.
A: Kaplan-Meier plot of overall survival of the WBC<10000/mm3 (green) and WBC≤10000/ mm3 (red) arms. Log-rank test showed a significant difference (P=0.0002).
B: Kaplan-Meier plot of overall survival of the G-CSF<100 pg/ml (green) and G-CSF<100 pg/ml (red) arms. Log-rank test showed a significant difference (P=0.0107).
Patients with G-CSF ≥ 100 pg/ml (n=4) had a shorter survival than those with GCSF < 100 pg/ml (n=18, p=0.0107). The median overall survival was 67 ± 15 days; the 3-month survival rate was 0% for ATC patients with G-CSF ≥ 100 pg/ml (Figure 4B). One patient was alive with the disease after 150 days of follow-up, and two patients were alive and well after 475-570 days of follow-up. Only last 2 patients have survived more than 1 year and neither of the patients had leukocytosis or G-CSF ≥ 100 pg/ml.
Compared with PTC patients, ATC patients appeared to have hypercytokinemia in the present study. IL-6 and IL-8 are inflammatory cytokines, and there are a number of reports that these are high in ATC [20,21]. G-CSF is a cytokine that induces differentiation and proliferation of neutrophil precursors. G-CSF also stimulates a variety of responses in mature neutrophils, including phagocytosis and superoxide production [22]. Among patients who had WBC ≥ 10000/ mm3, 4 patients (44.4%; 4/9) had G-CS >100 pg/ml, and 7 patients (77.8%; 7/9) had G-CSF ≥ 50 pg/ml. These observations suggest that G-CSF-producing tumors are present in those with WBC ≥ 10000/mm3, which is a higher prevalence than in the other high-WBC diseases. Among patients who had WBC<10000/mm3, all patients (13/13) had GCSF<100 pg/ml. Multivariate analysis revealed high correlations between leukocytosis and G-CSF concentrations in ATC, supporting the potential role of tissue G-CSF expression.
Blood samples of patients before treatment were analyzed as a base line control. We measured the set of cytokines for 9 samples, excluding the cases that were found to be ATC on histological examination and those who had been treated in other hospitals. We examined G-CSF and G-CSFR immunohistochemistry in 10 samples from patients who had undergone thyroidectomy (i.e. not all ATC cases were surgically treated). A G-CSF>50 pg/ml was considered to be high, whereas a level less than 18 pg/ml was considered to be normal. Cases with G-CSF levels greater than 100 pg/ml obviously had a high level, so we analyzed prognosis in terms of cytokine expression with these samples.
The mechanism associated with the increased serum G-CSF level has been reported as the following: (a) production by the tumor; and (b) production by endothelial cells, fibroblast cells, and monocytes, induced by other cytokines [23]. Taken together, our data suggest that both G-CSF production and G-CSFR expression in tumor cells are involved as causes of clinical leukocytosis. Based on the previous literature, causes for tumor progression include autocrine and paracrine mechanisms [24,25].
Marked neutrophilia associated with neoplasia is a relatively rare finding, which has been considered as a paraneoplastic manifestation after excluding other causes, such as infections, allergy, collagen disease, vascular diseases, and concomitant, malignant hematopoietic diseases [26]. Production of hematopoietic growth factors by neoplasms has been reported in patients with neutrophilia arising from non-lymphohematopoietic malignancies, most often lung cancers [27-30]. Ectopic production has also been observed in vitro studies that have shown secretion of colony-stimulating factors by solid tumor cell lines [13,31]. Colony-stimulating factors have been thought to be major causes of tumor-related neutrophilia, although the mechanism of induction has not been clarified. Data from lung cancer patients showed that tumor-related leukocytosis associated with hematopoietic cytokine production (G-CSF, GM-CSF, and IL-6) is linked to poor prognosis [32]. It has also been reported that G-CSF and GM-CSF expressions in HNSCC are associated with a poorer prognosis [33]. Moreover, a poor prognosis of oral and mesopharyngeal carcinoma has been shown to be related to G-CSFR expression on the surface of cancer cells [34]. Thyroid tumors producing colony-stimulating factors and associated with neutrophilia have been described almost exclusively in ATC patients [11,17,21,35,36]. Production of colony-stimulating factors, such as G-CSF [11,17,35], GM-CSF [35,36], and M-GSF [21] by ATC has been shown to be associated with paraneoplastic leukocytosis, though the mechanism of induction of the hematologic abnormality remains unknown. The pathophysiological significance of colonystimulating factor production by thyroid epithelial cells is unclear. It is known that growth factors exert most of their effects locally, so it may suggest that the findings of leukocytosis associated with growth factors reflect another potential autocrine or paracrine function in the thyroidal microenvironment.
Caution has been recommended in the clinical use of rG-CSF for cancer patients because it could contribute to tumor growth through autocrine mechanisms [25,37]. In fact, recombinant G-CSF has been used to treat neutropenia occurring as a side effect of chemoradiotherapy, and it resulted in tumor growth by autocrine mechanisms. Because there was a high frequency of G-CSFR expression (7/10) in ATC, the use of G-CSF must be considered carefully. Although the mechanisms remain controversial [38], G-CSF-producing cancers with G-CSFR would have poorer prognosis than those not producing G-CSF [34,37].
The present data lead us to conclude that the expression of G-CSF and associated receptors may have a tumor-growth effect in ATC. Growth factors are part of an autocrine stimulatory mechanism for inducing tumor cell proliferation. In conclusion, G-CSF-producing ATC should be considered primarily in ATC patients who show leukocytosis of unknown origin and fever without a focus of infection. In addition, leukocytosis and high G-CSF levels are correlated with a poor prognosis in ATC patients. In vivo experiments counteractingthe function of G-CSF in ATC, either by neutralizing antibodies or antisense technology, might open new therapeutic possibilities. Such new therapeutic strategies are of great interest because the treatment of patients with ATC still remains a challenge.