Journal of Clinical Trials
Open Access
ISSN: 2167-0870
ISSN: 2167-0870
Research Article - (2024)Volume 14, Issue 4
The objective of phase I dose-escalation clinical trials has generally been to determine the Maximum Tolerated Dose (MTD). However, with the advent of molecular targeted therapies this approach has changed, as dose limiting toxicities are less frequently observed. For this reason, the concept of Optimal Biological Dose (OBD) has been developed, which considers efficacy and toxicity. Several Bayesian model-assisted designs have been proposed to target the MTD more accurately and/or the OBD compared to traditional rule-based approaches such as the 3+3 design. These include the Bayesian Optimal Interval (BOIN) and the BOIN phase I/II (BOIN12) design. The BOIN design targets the MTD, while the BOIN12, which takes both efficacy and toxicity into account in decisions to escalate/de-escalate the dose, targets the OBD. In this article we use a real-life case study to compare the BOIN and the BOIN12 designs under different scenarios and showcase how each of the designs perform when the compound under investigation has a benign toxicity profile. We argue that both efficacy and toxicity should be taken into consideration when designing early-phase oncology studies.
Bayesian adaptive designs; Dose escalation; Toxicity-efficacy trade-off; Optimal biologic dose; Phase I trials
In oncology, dose-finding trials are essential to drug development as they establish recommended doses for later-phase testing. Numerous phase I trial designs have been proposed to identify the Maximum Tolerated Dose (MTD) of a new drug, which is typically defined as the highest dose of a drug or treatment that does not cause unacceptable side effects in a specified proportion of patients. The MTD is determined by testing increasing doses on different cohorts of participants until the highest dose with acceptable side effects is found. The “Specified proportion” in this definition is commonly known as the Target Toxicity Level (TTL).
Most phase I trials use rule-based approaches, such as the standard 3+3 design because of its simplicity in implementation [1,2]. Under the 3+3 design, cohorts of three patients are assigned to increasing dose levels until one or more Dose-Limiting Toxicities (DLTs) is observed. If one out of three patients have a DLT, a further three patients are assigned to the current dose. If two or more patients out of three or six patients at the current dose experience a DLT, the trial is terminated and the dose below this level is declared the MTD. The 3+3 design uses only data at the current dose to choose the next dose and the MTD, resulting in uncertainty around the estimated DLT risks at each dose. Furthermore, as no TTL is specified by investigators when using the 3+3 design, the identified MTD often has a true risk of causing severe toxicity far different to what clinicians may deem acceptable for the treatment under investigation. These and other drawbacks in rule-based designs have been identified and reported frequently by many researchers in industry as well as in academia [3]. In this regard the Medical Research Council (MRC) Network of Hubs for Trials Methodology Research’s Adaptive Designs Working Group published a short note on why the 3+3 design, and A+B designs in general, should not be used for dose-finding studies [4].
Other model-based designs such as the Continual Reassessment Method (CRM) [5], the Bayesian logistic regression model [6], the Bayesian model averaging CRM [7], biased coin design [8,9] and the decision-theoretic approach [10], have been proposed in the literature. These methods assume a parametric model for the dose toxicity curve and then, based on the accumulating trial data, continuously update the estimate of the curve to guide the dose assignment and MTD selection. However, the use of these methods has been limited due to the computational complexity, increased cost of a statistician to determine the dose and the need for sophisticated software’s to perform pre-trial simulation. The model-assisted designs such as the isotonic designs [11], modified Toxicity Probability Interval (mTPI) design [12], the keyboard design [13], and the BOIN design [14] combine the superior performance of model-based designs with the simplicity of algorithm-based designs. The model-assisted designs use a statistical model for efficient decision-making like model-based designs, however, their dose-escalation and de-escalation rules can be tabulated before the onset of a trial, as with rule-based designs. Comprehensive reviews of dose-finding methods for phase I clinical trials are available elsewhere [15-17].
The Bayesian interval based design is a relatively new class of phase I trial designs, of which the Bayesian Optimal Interval (BOIN) design is probably the most widely used [18,19]. Dose titration is defined by the relative location of the observed toxicity rate (i.e., the number of patients who experienced toxicity divided by the total number of patients treated) at the current dose with respect to a prespecified toxicity tolerance interval. If the observed toxicity rate is located within the interval, the current dose is retained; if the observed toxicity rate is greater than the upper boundary of the interval, the dose is de-escalated; and if the observed toxicity rate is smaller than the lower boundary of the interval, the dose is escalated. The BOIN design only considers toxicity in dose finding to determine the MTD.
Most dose-finding designs available for phase I cancer clinical trials were initially developed in the context of cytotoxic conventional agents. These methods are based on the underlying assumption of a monotonically increasing relationship between toxicity and the dose of a cytotoxic drug. With the emergence of molecular targeted agents, immunotherapies, such as checkpoint inhibitors and chimeric antigen receptor T-cell therapy, this paradigm has changed. Severe toxicities are rare, often delayed in subsequent treatment cycles, preventing the MTD from being reached. Poorly characterized dose and schedule may lead to selection of a dose that provides more toxicity without additional efficacy. Noticing the importance of dose optimization in early phase dose finding studies, the FDA has launched Project Optimus with the goal of educating, innovating, and collaborating with companies, academia, professional societies, international regulatory authorities, and patients to move forward with a dose optimization paradigm across early phase oncology that emphasizes selection of a dose or doses that maximizes not only the efficacy of a drug but the safety and tolerability as well [20].
Targeted therapies, have revolutionized the treatment of many cancers. For these novel therapies, although toxicity may increase with the dose, efficacy may plateau or even decrease at high doses [21,22]. Therefore, the objective of dose-finding trials in this setting is to identify the Optimal Biological Dose (OBD) that optimizes patients’ risk-benefit trade-off [23]. The OBD is generally defined as the lowest dose providing the highest rate of efficacy while being safely administered [24]. Various phase I/II dose-finding designs have been proposed to identify the OBD. These include the rulebased design [25], model-based Efficacy-Toxicity (EffTox) design [26], which assumes a statistical model to describe the dose toxicity and efficacy curves, as well as model-assisted designs such as the BOIN-ET design [27], and the U-BOIN design [28]. As toxicity and efficacy data accrue during the trial, the EffTox design continuously updates the estimates of the fitted model after each cohort and uses them to determine the dose for the next cohort. However, such designs are rarely used in practice as they are difficult to understand for a non-statistician and require complicated statistical modeling and computation as well as an expensive infrastructure for implementation. The BOIN phase I/II (BOIN12) design has been developed as an extension of the standard BOIN design to find the OBD that optimizes the risk-benefit trade-off [25]. In the BOIN12 design decisions to escalate, de-escalate or continue with the same dose are made by simultaneously taking account of efficacy and toxicity and optimizing the toxicity-efficacy tradeoff. Compared with model-based phase I/II dose-finding designs, such as the EffTox design [26], which requires regular complicated model fitting and estimation for the decision of dose escalation/deescalation, BOIN12 is simpler to implement. In addition, BOIN12 enjoys the advantage of being more robust than the EffTox design [26], because it does not make any model assumptions on the dose toxicity and efficacy curves. BOIN12 differs from the model-assisted U-BOIN design, in that U-BOIN is a two-stage design where the first stage performs dose escalation on the basis of toxicity only, and it’s only the second stage the uses the toxicity-efficacy tradeoff for decision making. The BOIN12 design, in contrast, is a single stage design and uses the toxicity-efficacy trade-off throughout, thus being more efficient for finding the OBD.
The objective of this paper is to present a real-life case study where the performance of the BOIN design is compared and contrasted to the BOIN12 in various scenarios, including where the investigational drug has a benign toxicity profile. Section 2 briefly summarizes the methodology underpinning the standard BOIN and BOIN12 designs. Sections 3, 4 and 5 present the details of a real-life clinical trial which is used as a motivating example for this paper. Section 6 concludes the paper with a brief discussion on the key findings and recommendation for further work.
In the following we provide a short overview of the standard BOIN and BOIN12 designs.
The BOIN design
The BOIN design is described extensively in the literature [19]. Dose
escalation and de-escalation rules are determined by comparing the
observed DLT rate at the current dosing level with a pair of fixed
dose escalation and de-escalation boundaries, predetermined at study outset. We outline the approach in the following. Let  represent the observed DLT rate at the current dose level j, where yj and nj are the observed number of DLT’s and the number of
patients treated respectively. Let represent the unknown target DLT rate and
represent the observed DLT rate at the current dose level j, where yj and nj are the observed number of DLT’s and the number of
patients treated respectively. Let represent the unknown target DLT rate and  represent the dose escalation and de-escalation boundaries at each dose level with
 The BOIN approach is as follows:
• Patients in the first cohort are treated at the lowest or prespecified starting dose level.
• At the current dose level j

• This process is continued until the maximum total sample size is reached
The BOIN design is obtained by choosing the optimal dose
escalation and de-escalation boundaries to minimize the
probability of making incorrect dose escalation and de-escalation
decisions [14]. The optimal  for each dose level are identified with regard to the three hypotheses:
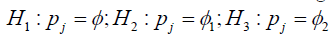
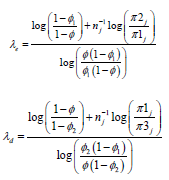
Where, φ is the target DLT rate as previously, φ1 denotes a DLT probability that is substantially lower than the target MTD (suggesting escalation) and φ2 denotes a DLT probability that is substantially higher than the target MTD such that de-escalation is required. The three hypotheses represent, in sequence, staying at the current dose level (H1), escalating to the next dose level (H2) and de-escalating to a lower dose level (H3). It has been shown by Liu et al. that the optimal decision boundaries that minimize correct decisions are given by:
Default values of 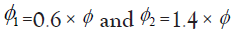 has been recommended
by Liu et al., which lead to desirable operating characteristics and
the decision rule that fits most clinical practices. The approach
simplifies if, a-priori, each of the three hypotheses are considered
equally likely, i.e. π1=π2=π3=1/3 with the benefit that λe and λd will be the same for each dose level resulting in a straightforward trial design.
has been recommended
by Liu et al., which lead to desirable operating characteristics and
the decision rule that fits most clinical practices. The approach
simplifies if, a-priori, each of the three hypotheses are considered
equally likely, i.e. π1=π2=π3=1/3 with the benefit that λe and λd will be the same for each dose level resulting in a straightforward trial design.
The BOIN12 method
The Bayesian optimal interval phase I/II (BOIN12) trial design proposed by Lin et al. estimates the OBD that optimizes the risk-benefit trade-off and is used where late onset toxicities are not expected. The BOIN12 design makes the decision of dose escalation and de-escalation by simultaneously taking account of efficacy and toxicity and adaptively allocates patients to the dose that optimizes the toxicity- efficacy trade-off. BOIN12 uses a utility function to measure the toxicity-efficacy tradeoff, whose value should be elicited from clinicians to reflect the clinical desirability of each possible toxicity and efficacy outcome observed in Table 1.
| Toxicity | Efficacy | |
| Yes | No | |
| No | u1=100 | u2 |
| Yes | u3 | u4=0 |
Table 1: The decision framework is presented in BOIN12 method by Lin et al.
The risk-benefit tradeoff of a dose is defined in terms of a simple 2 × 2 contingency table where a utility value is ascribed to each of the possible toxicity-efficacy outcomes.
In their example the most desirable outcome (No Toxicity, Efficacy) is assigned a score of 100 and the least desirable outcome (Toxicity, No Efficacy) a score of 0. Clinicians are then asked to specify scores u2 and u3 for the other two outcomes. Averaging over the four possible outcomes, the utility of a particular dose (d) is:
u(d)=p1u1+p2u2+p3u3+p4u4
A higher value of u(d) indicates a more desirable risk-benefit tradeoff. The dose with the highest value of u(d) is the OBD.
The decision rule of BOIN12 design is depicted below in Figure 1, and the optimal boundaries used in this design is given in Table 2. In the BOIN12 design, the calculation of dose desirability can be pre-tabulated and included in the trial protocol before the initiation of the trial, which simplifies design implementation as compared to the model-based methods such as the EffTox esign [26-28]. The computation of the dose desirability is achieved by using the quasi-beta-binomial model which converts complicated desirability calculations involving bivariate toxicity and efficacy outcomes into simple beta-binomial modeling. To safeguard patients from toxic and/or futile doses, two dose-acceptability criteria are used in the BOIN12 design to decide which doses may be used to treat patients. These are the clinician-specified toxicity upper limit and efficacy lower limit, respectively. Generally, the efficacy lower limit can take the value of the target response rate specified for a standard phase II trial. The value of the clinician-specified toxicity upper limit should be set slightly higher than the target toxicity rate used in conventional toxicity-based phase I designs. During the trial, the desirability of a dose can be determined by counting the number of patients treated at that dose level along with the number of patients who experienced toxicity, the number of patients who experienced efficacy and also the number of patients who experienced efficacy without toxicity and then look up at the pre-tabulated Rank based Desirability Score (RDS) table as shown in Lin et al., to determine the optimal dose for the next cohort of patient.
| Target toxicity rate | 0.20 | 0.25 | 0.30 | 0.35 | 0.40 |
|---|---|---|---|---|---|
| Escalation boundaries | 0.157 | 0.197 | 0.236 | 0.276 | 0.316 |
| De-escalation boundaries | 0.238 | 0.298 | 0.359 | 0.419 | 0.48 |
Table 2: Escalation and de-escalation boundaries for BOIN12 design.

Figure 1: BOIN12 design decision rule design, where, (λe,λd). are the dose escalation and de-escalation boundaries adopted from the BOIN design, and N* is a prespecified sample size cutoff (e.g., N*=6).
Compared with existing phase I/II dose-finding designs, the BOIN12 design is simpler to implement, has higher accuracy to identify the OBD, and allocates more patients to the OBD. The fact that its adaptation rule can be pre-tabulated and included in the protocol, makes the design very appealing to the investigators as they are aware of the escalation/de-escalation pathways prior to the initiation of the trial. During the trial, the clinical team can allocate patients to a dose based on decision table from the BOIN12 design as suggested by Lin et al.
The case study presented in this manuscript, which was designed and conducted by Numab Therapeutics AG and ICON plc, has been described elsewhere [29]. The primary objective was to estimate the MTD, based on the number of DLTs observed at a specific dose level. A BOIN design was used and comprised eight planned escalating dose levels; dose levels 1 to 8 (0.15 mg–1400 mg).
After enrolling into dose level 1, subsequent dose levels were only opened if the previous dose level was deemed well tolerated. The first dose level was to enroll a minimum of one patient. If a Grade 2 or higher Adverse Event (AE) was observed during the evaluation period or when dose level 5 was reached, a minimum of three patients were to be enrolled per dose level in accordance with the BOIN design dosing rules. Cohorts of three patients were recruited after the first dose level enrolling three patients. The drug was administered as a single Intravenous (IV) infusion approximately every 14 days for a total of two infusions per treatment cycle. The DLT observation period was therefore 28 days.
The target toxicity rate for the MTD was set as ≤ 30% (i.e, =0.3), and the maximum sample size was 27 with a maximum of 12 patients per cohort. If the observed DLT rate at the current dose was ≤ 0.236, the next cohort of patients would be treated at the next higher dose level; if it was ≥ 0.359, the next cohort of patients would be treated at the next lower dose level. If the DLT rate was >0.236 or <0.359 then the next cohort of patients would be treated at the current dose. A 1 patient-per-dose dose-escalation process was applied until the first ≥ Grade 2 toxicity was observed, or dose level 5 (80 mg dose level) reached.
Whilst enrolling patients into dose levels 1 to 5 it became clear that the drug had a benign safety profile. Further, newly available Pharmacodynamics (PD) data suggested that toxicity may not increase monotonically with dose and that PD activity might plateau due to the affinity-balanced design of the molecule, i.e., activity might initially increase and then plateau over a relatively broad dose range before decreasing. The biological explanation for such a bellshaped dose-response relationship is that at high concentrations the target engagers for the drug may become saturated resulting in “insulating effects” that restrict drug activity. Based on the PD and emerging clinical data it was decided to amend the study design to remove the highest pre-specified dose level (1400 mg) from the dose escalation scheme [29].
We now investigate the application of BOIN12 to the same study setting and compare and contrast the use of the two models first through simulation and then analysis of the study data. The original design with the eight dose levels will be investigated.
Simulations
We used the same DLT profiles when evaluating the BOIN and BOIN12 designs. With the exception of the accelerated titration, which is not a feature of the BOIN12 design, the characteristics of the BOIN and BOIN12 were as described in the previous section. For the BOIN12 a target efficacy of 0.25 was used and the riskbenefit tradeoff was as shown above. A total of 10,000 simulations were conducted for each scenario using the simulation tool for the BOIN and BOIN12 designs in the BOIN suite [30].
The assumed DLT rates are shown in Table 3. The scenarios were designed to evaluate the performance of the BOIN and BOIN12 designs where the toxicity was expected to range from quickly escalating and plateauing (Scenario S1) to becoming increasingly more benign across dose levels (Scenario S5).
| Dose level/scenario | 1 | 2 | 3 | 4 | 5 | 6 | 7 | 8 |
|---|---|---|---|---|---|---|---|---|
| S1 | 0.10 | 0.30 | 0.45 | 0.48 | 0.51 | 0.54 | 0.56 | 0.58 |
| S2 | 0.04 | 0.06 | 0.11 | 0.16 | 0.29 | 0.47 | 0.55 | 0.60 |
| S3 | 0.03 | 0.06 | 0.10 | 0.15 | 0.30 | 0.46 | 0.68 | 0.80 |
| S4 | 0.01 | 0.03 | 0.06 | 0.09 | 0.11 | 0.30 | 0.45 | 0.60 |
| S5 | 0.02 | 0.03 | 0.05 | 0.06 | 0.07 | 0.08 | 0.09 | 0.10 |
Table 3: Assumed DLT rates for BOIN and BOIN12.
The BOIN design
The sample size probabilities, which represent the proportion of times that a particular sample size occurred in the 10,000 simulations, are shown in Table 4. As expected, fewer subjects are likely to be enrolled in DLT scenario 1, where there is a higher probability of observing a DLT at lower doses. In all other scenarios the most probable sample size is 21 subjects.
| Sample size/DLT scenario | 6 | 9 | 12 | 15 | 18 | 21 | 24 | 27 |
|---|---|---|---|---|---|---|---|---|
| DLT S1 | 0.04 | 0.06 | 0.12 | 0.19 | 0.30 | 0.29 | 0.04 | 0.06 |
| DLT S2 | <0.01 | <0.01 | 0.02 | 0.04 | 0.06 | 0.88 | <0.001 | <0.001 |
| DLT S3 | <0.001 | <0.01 | 0.01 | 0.03 | 0.07 | 0.88 | <0.001 | <0.001 |
| DLT S4 | <0.001 | <0.001 | ¡0.01 | ¡0.01 | 0.02 | 0.96 | <0.001 | <0.001 |
| DLT S5 | <0.001 | <0.001 | 0.03 | 0.01 | 0.01 | 0.98 | <0.001 | <0.001 |
Table 4: Sample size probabilities.
Probabilities for the optimal dose are given in Table 5. For the scenario where the toxicity profile is more benign (Scenario 5), which is what was actually observed in the study, the highest dose is the most likely to be chosen [29]. However, this is only because the DLT rate always stays below the lower boundary and the dose is always escalated. So, in effect, this is the highest dose tested and not necessarily the most clinically active dose.
| Sample Size/DLT scenario | 1 | 2 | 3 | 4 | 5 | 6 | 7 | 8 |
|---|---|---|---|---|---|---|---|---|
| DLT S1 | 0.14 | 0.65 | 0.17 | 0.03 | <0.01 | <0.001 | <0.001 | <0.001 |
| DLT S2 | <0.001 | 0.01 | 0.06 | 0.24 | 0.48 | 0.18 | 0.03 | <0.001 |
| DLT S3 | <0.001 | <0.001 | 0.05 | 0.25 | 0.49 | 0.19 | <0.01 | <0.001 |
| DLT S4 | <0.001 | <0.001 | <0.01 | 0.03 | 0.23 | 0.50 | 0.20 | 0.02 |
| DLT S5 | <0.001 | <0.001 | <0.01 | <0.01 | 0.03 | 0.11 | 0.27 | 0.56 |
Table 5: Probability of optimal dose.
The BOIN12 method
The assumed efficacy rates are shown in Table 6. The scenarios were designed to evaluate the performance of the BOIN12 designs where the dose response curve is: (1) bell-shaped (Efficacy Scenario (ES1); (2) S-shaped (ES2); and (3) monotonic increasing (ES3).
| Sample size/efficacy scenario | 1 | 2 | 3 | 4 | 5 | 6 | 7 | 8 |
|---|---|---|---|---|---|---|---|---|
| EFF S1 | 0.05 | 0.10 | 0.20 | 0.30 | 0.40 | 0.35 | 0.30 | 0.20 |
| EFF S2 | 0.05 | 0.20 | 0.30 | 0.35 | 0.40 | 0.45 | 0.48 | 0.50 |
| EFF S3 | 0.05 | 0.10 | 0.15 | 0.20 | 0.25 | 0.30 | 0.35 | 0.40 |
Table 6: Assumed efficacy rates.
DLT scenario 1: The sample size probabilities for each efficacy scenario for DLT scenario 1 (Table 3), are shown in Table 7. In contrast to the standard BOIN design the most probable sample size is 27 subjects. This is the case for each of the efficacy scenarios.
| Sample size/efficacy scenario | 3 | 6 | 9 | 12 | 15 | 18 | 21 | 24 | 27 |
|---|---|---|---|---|---|---|---|---|---|
| EFF S1 | <0.001 | <0.01 | <0.01 | 0.02 | 0.02 | 0.03 | 0.04 | 0.04 | 0.85 |
| EFF S2 | <0.001 | <0.001 | <0.01 | 0.02 | 0.02 | 0.02 | 0.02 | 0.02 | 0.89 |
| EFF S3 | <0.001 | <0.001 | <0.01 | 0.02 | 0.02 | 0.03 | 0.04 | 0.04 | 0.84 |
Table 7: Sample size probabilities.
Probabilities for the optimal dose for DLT scenario 1 are given in Table 8. Dose levels 1 or 2 are the most probable using the BOIN12 design. In contrast, dose level 2 is by far the most probable with the standard BOIN.
| Dose level/efficacy scenario | Early stop | 1 | 2 | 3 | 4 | 5 | 6 | 7 | 8 |
|---|---|---|---|---|---|---|---|---|---|
| EFF S1 | 0.18 | 0.38 | 0.28 | 0.11 | 0.04 | 0.1 | <0.01 | <0.001 | <0.001 |
| EFF S2 | 0.13 | 0.28 | 0.44 | 0.10 | 0.03 | 0.01 | <0.01 | <0.001 | <0.001 |
| EFF S3 | 0.18 | 0.39 | 0.27 | 0.10 | 0.03 | 0.02 | <0.01 | <0.01 | <0.001 |
| BOIN | 0.99 | 0.14 | 0.65 | 0.17 | 0.03 | <0.01 | <0.001 | <0.001 | 0.0 |
Table 8: Probability of optimal dose.
The BOIN design has two “built-in early stopping rules”, i.e. study stops before the maximum sample size is reached:
• Stop the trial if the lowest dose is eliminated due to toxicity, and no dose should be selected as the MTD. This can only really happen if the first dose level is very toxic and thus this “early stopping” definition only applies in this context. Early stopping is achieved if the posterior probability that the DLT rate of the first dose is higher than the target DLT rate is greater than a pre-defined threshold.
• Stop the trial and select the MTD if the number of patients treated at the current dose reaches the maximum to be exposed at any dose level, which was 12 subjects in this case study.
The first stopping rule is a safety rule to protect patients from being exposed to doses that are all overly toxic. This corresponds to a scenario where all the doses have a DLT rate greater than the target DLT rate. The rationale for the second stopping rule is that when there is a large number of patients assigned to a dose, it means that the dose-finding algorithm has approximately converged. Thus, we can stop the trial early and select the MTD to save sample size and reduce the trial duration.
The BOIN12 design appears to have two built-in stopping rules:
• Stop the trial and select the OBD if the number of patients treated at the current dose reaches the maximum to be exposed at any dose level, which was 12 subjects in this case study.
• When the observed toxicity rate indicates that subjects should continue to be exposed at the current dose level, then stop exploring higher doses if the number of patients N*. The recommended range for N* is between 0 and 6.
In the case of the BOIN design it was almost certain (>99%) to stop early whereas with the BOIN12 design the probability was 12%- 20%. This was presumably due to how the first and the second stopping rules given above work together. In our simulations the first rule was set to 12 and the second (N*) to 6. This second rule essentially means that once at least 6 patients have been exposed to a particular dose then no further dose escalation will occur. The study will then continue until 12 have been exposed at any dose level. The second rule is essentially a safety rule to prevent subjects being exposed unnecessarily to higher doses.
DLT scenarios 2 to 5: The sample size probabilities for each efficacy scenario for DLT scenario 2 are shown in Table 9. A similar pattern was seen for DLT Scenarios 3-5. In contrast to the standard BOIN design the sample size is always 27 subjects. This is the case for each of the efficacy scenarios.
| Sample size/efficacy scenario | 3 | 6 | 9 | 12 | 15 | 18 | 21 | 24 | 27 |
|---|---|---|---|---|---|---|---|---|---|
| EFF S1 | 0.0 | 0.0 | 0.0 | 0.0 | 0.0 | 0.0 | 0.0 | 0.0 | 1.0 |
| EFF S2 | 0.0 | 0.0 | 0.0 | 0.0 | 0.0 | 0.0 | 0.0 | 0.0 | 1.0 |
| EFF S1 | 0.0 | 0.0 | 0.0 | 0.0 | 0.0 | <0.001 | 0.0 | .00.0 | 1.0 |
Table 9: Sample size probabilities.
Probabilities for the optimal dose for DLT Scenario 2 are given in Table 10. Here we see a difference between the efficacy scenarios. Dose levels 3-5 are the most probable using the BOIN12 design for the bell-shaped curve, dose levels 3-4 for the S-shaped curve and 1-4 for the monotonically increasing scenario. In contrast, doses 4-5 are the most probable doses when using the BOIN design, with dose level 5 having a probability of 0.4.
| Dose level/efficacy scenario | Early stop | 1 | 2 | 3 | 4 | 5 | 6 | 7 | 8 |
|---|---|---|---|---|---|---|---|---|---|
| EFF S1 | <0.001 | 0.09 | 0.13 | 0.22 | 0.27 | 0.24 | 0.03 | <0.01 | <0.01 |
| EFF S2 | 0.0 | 0.06 | 0.16 | 0.24 | 0.28 | 0.17 | 0.07 | <0.01 | <0.01 |
| EFF S3 | 0.0 | 0.21 | 0.20 | 0.20 | 0.19 | 0.15 | 0.04 | 0.01 | <0.001 |
| BOIN | 1.0 | <0.01 | 0.04 | 0.11 | 0.27 | 0.40 | 0.16 | 0.01 | <0.001 |
Table 10: Probability of optimal dose.
Again, there was a marked difference between the two designs in terms of “early stop” with the BOIN always stopping early in DLT scenario 2. The probabilities for the optimal dose for DLT Scenario 3 were similar to those for DLT Scenario 2.
With respect to DLT Scenario 4, dose levels 4-5 are the most probable to be identified as optimal using the BOIN12 design for the bell-shaped curve and the S-shaped curve. For the monotonically increasing curve the most probable doses identified as optimal are 2-5. In contrast, dose level 6 is clearly the most probable dose when using the BOIN design. Again, there was a marked difference between the two designs in terms of “early stop” with the BOIN always stopping early in DLT scenario 4.
Finally, for DLT Scenario 5, dose levels 5-6 are identified as the most likely to be optimal using the BOIN12 design for the bellshaped curve and the S-shaped curve. For the monotonically increasing curve the most probable doses are 7-8. In contrast, dose level 8 is clearly the most probable dose when using the BOIN design. Again, there was a marked difference between the two designs in terms of “early stop” with the BOIN always stopping early in DLT scenario 5.
Illustration
The clinical results of the study have been published elsewhere [29]. In summary, 26 patients with various primary solid tumors were enrolled in the study. Of the 26 enrolled, 23 were evaluable for efficacy. One patient experienced a DLT. In the 8 mg-800 mg dose range, disease control, i.e., at least stable disease at first assessment at 8 weeks, occurred in 13/23 patients (54%). PD activity remained stable at a broad dose range (24 mg-800 mg). The MTD for the BOIN study design and the OBD for the BOIN12 study design were determined using the simulation tools in the BOIN suite [30].
The BOIN design
The MTD for the BOIN design is determined by applying isotonic regression to the observed DLT rates so that they are monotonically non-decreasing, and then selecting the dose for which the smoothed DLT rate is closest to the target DLT rate [31]. The results of the analysis are given in Table 11. One patient in the 80 mg cohort died due to rapid disease progression before the end of the DLT observation period and was therefore not included in the DLT rate calculation for that dose. As can be observed in Table 11, the toxicity profile was extremely benign so the early stopping rule of a maximum of 12 patients exposed at any dose level was not met. Instead, the study stopped when the maximum sample size was reached. The MTD was determined to be dose level 7 (800 mg).
The BOIN12 design
| Dose level | Number of patients | Patients with DLTs | Posterior DLT estimate | 95% credible interval | Posterior toxicity>0.3 |
|---|---|---|---|---|---|
| 0.15 mg | 1 | 0 | 0.01 | (0.00,0.13) | 0.03 |
| 1.5 mg | 1 | 0 | 0.01 | (0.00,0.13) | 0.03 |
| 8 mg | 3 | 0 | 0.01 | (0.00,0.13) | 0.03 |
| 24 mg | 3 | 0 | 0.01 | (0.00,0.13) | 0.03 |
| 80 mg | 5 | 1 | 0.01 | (0.00,0.13) | 0.09 |
| 240 mg | 3 | 0 | 0.01 | (0.00,0.13) | 0.09 |
| 800 mg | 9 | 0 | 0.01 | (0.00,0.13) | 0.09 |
Table 11: Maximum Tolerated Dose (MTD) selection smoothed DLT rate is closest to the target DLT rate.
Table 12, provides a summary of the study results. Table 13, provides estimates of the marginal toxicity probability, marginal efficacy probability, and mean utility for each dose. The OBD was determined to be dose level 4 (24 mg).
| Dose level/outcomes | DL1 0.15 mg |
DL2 1.5 mg |
DL3 8 mg |
DL4 24 mg |
DL5 80 mg |
DL6 240 mg |
DL7 800 mg |
|---|---|---|---|---|---|---|---|
| No. of Patients | 1 | 1 | 3 | 3 | 5 | 3 | 9 |
| No.(Toxicity=0,Efficacy=1) | 0 | 0 | 1 | 3 | 2 | 3 | 4 |
| No.(Toxicity=1,Efficacy=1) | 0 | 0 | 0 | 0 | 0 | 0 | 0 |
| No.(Toxicity=0,Efficacy=0) | 1 | 1 | 2 | 0 | 2 | 0 | 5 |
| No.(Toxicity=1,Efficacy=0) | 0 | 0 | 0 | 0 | 1 | 0 | 0 |
| No. of Toxicity | 0 | 0 | 0 | 0 | 1 | 0 | 0 |
| No. of Efficacy | 0 | 0 | 1 | 3 | 2 | 3 | 4 |
Note: DL: Dose Level
Table 12: Summary of clinical study results.
| Dose level/probabilities | DL1 0.15 mg |
DL2 1.5 mg |
DL3 8 mg |
DL4 24 mg |
DL5 80 mg |
DL6 240 mg |
DL7 800 mg |
|---|---|---|---|---|---|---|---|
| No.(Toxicity=0,Efficacy=1) | 0 | 0 | 0.33 | 1 | 0.4 | 1 | 0.44 |
| No.(Toxicity=1,Efficacy=1) | 0 | 0 | 0 | 0 | 0 | 0 | 0 |
| No.(Toxicity=0,Efficacy=0) | 1 | 1 | 0.67 | 0 | 0.4 | 0 | 0.56 |
| No.(Toxicity=1,Efficacy=0) | 0 | 0 | 0 | 0 | 0.2 | 0 | 0 |
| Pr(Toxicity) | 0 | 0 | 0 | 0 | 0.01 | 0.01 | 0.01 |
| Pr(Efficacy) | 0 | 0 | 0.33 | 1 | 0.4 | 1 | 0.44 |
| Mean Utility | 46.67 | 46.67 | 56 | 80 | 54.29 | 80 | 63.64 |
Note: DL: Dose Level
Table 13: Summary of clinical study results.
We present a real-life case study where a standard BOIN design was used to estimate the MTD [29]. As the investigational drug was found to have a benign toxicity profile, we decided to compare the performance of the BOIN design, as originally conceived, and the BOIN12 design, which uses both efficacy and toxicity data to estimate the OBD, first in a simulation study and then in a comparative analysis of the actual study results.
The simulation study indicates that the BOIN12 design generally leads to a larger sample size compared to the standard BOIN design. This is presumably because the dose-escalation decisions under the BOIN12 design, in contrast to the BOIN design, are based on the efficacy-toxicity trade-off [25]. The simulation study showed that in the majority of runs the BOIN design needed no more than 21 patients to estimate the MTD, whereas the BOIN12 needed the maximum sample size of 27 patients to estimate the OBD. However, the disadvantage of the BOIN design is that dose selection is based on toxicity alone.
When the toxicity profile of a compound is benign (DLTS5), as was seen in the case study, the BOIN design most frequently selects the highest dose as the MTD, whereas the selection of the OBD depends on the shape of the dose-response curve. In the simulation study, under DLTS5, dose levels 5-6 were the most probable using the BOIN12 design for the bell-shaped (ES1) and the S-shaped (ES2) dose-response curves. For the monotonically increasing (ES3) doseresponse curve, dose levels 7-8 were the most likely to be selected. In contrast dose levels 8 was the most likely MTD using the BOIN design. This is due to the fact that the dose escalation/de-escalation rules in the BOIN design only take account of observed DLTs and if the rate always stays below the lower boundary, then the dose will always be escalated irrespective of any efficacy signal. Hence, for a compound with a benign toxicity profile, the BOIN12 design may be more suitable.
The selection of the OBD using the BOIN12 design is dependent on the shape of the dose-response curve irrespective of the toxicity profile of the compound. Even when the toxicity profile was not benign, the OBD is dependent on the dose-response relationship and usually lower than the MTD. This makes the BOIN12 design an attractive option to implement in early-phase oncology trials, as it selects the lowest dose providing the highest rate of efficacy while being safely administered. The BOIN design can be a useful option for cytotoxic chemotherapies where the dose-response relationship is steeply increasing monotonically. However, dose-finding trials that select the phase 2 dose based on dose- and exposure- response, represent a more informed approach to identify the optimal dosages [20].
The actual study results tend to support the BOIN12 as the more attractive option. As predicted, the maximum sample size of 27 subjects was enrolled as the early stopping rule was not met at any dose level. The BOIN design determined dose level 7 (800 mg) to be the MTD, although this was in effect just the maximum dose tested, whereas the BOIN12 determined dose level 4 (24 mg) to be the OBD when taking efficacy and safety into account.
The limitation of our study is that we consider only one trial. We hope that this article will encourage other investigators to publish case studies comparing early-phase oncology designs, so we can better understand how these perform in real-life situations. Targeted therapies with different dose-response relationships and other designs such as EffTox [26] or the Probability Intervals of Toxicity and Efficacy (PRINTE) method could be compared to the BOIN and BOIN12 [32]. This will enable us to better understand these methodologies and make more informed dose selection decisions in clinical development.
The case study presented in this article suggests that model-assisted designs may select different optimal doses depending on whether only toxicity or both toxicity and efficacy data are considered. We would therefore encourage investigators to utilize methods that take account of both efficacy and toxicity when designing earlyphase oncology studies.
This work is a result of the collaboration between ICON plc., IQVIA, Numab Therapeutics AG and University of Limerick (UL). The authors would like to specially thank the Drug Development Services group in ICON plc., the RADDS department in IQVIA, and University of Limerick for providing resources in support of completing this research work. Special thanks also goes to Numab Therapeutics AG.
This work is not under consideration for publication elsewhere, that its publication is approved by all authors and tacitly or explicitly by the responsible authorities where the work was carried out, and that, if accepted, it will not be published elsewhere in the same form, in English or in any other language, including electronically, without the written consent of the copyright-holder.
This research work has been supported jointly by ICON plc. and IQVIA. The authors declare that there has been no additional funding sources for this research work. The analyses, conclusions, opinions and statements expressed herein are those of the authors’.
Tim Clark (TC), Ayon Mukherjee (AM), Peter Lichtlen (PL) and James Sweeney (JS) initiated the project. The concept originated from AM and then further developed by TC and JS. The first draft of the manuscript was written by TC and refined by AM, PL and JS. JS conducted the simulations which has been validated by AM and TC. All authors contributed to the manuscript and read and approved the final manuscript.
The authors declare no potential conflict of interests.
Data sharing not applicable to this article as no datasets were generated or analysed during the current study.
Not Applicable
[Crossref] [Google Scholar] [PubMed]
[Crossref] [Google Scholar] [PubMed]
[Crossref] [Google Scholar] [PubMed]
[Crossref] [Google Scholar] [PubMed]
[Crossref] [Google Scholar] [PubMed]
[Crossref] [Google Scholar] [PubMed]
[Crossref] [Google Scholar] [PubMed]
[Crossref] [Google Scholar] [PubMed]
[Crossref] [Google Scholar] [PubMed]
[Crossref] [Google Scholar] [PubMed]
[Crossref] [Google Scholar] [PubMed]
[Crossref] [Google Scholar] [PubMed]
[Crossref] [Google Scholar] [PubMed]
[Crossref] [Google Scholar] [PubMed]
[Crossref] [Google Scholar] [PubMed]
[Crossref] [Google Scholar] [PubMed]
[Crossref] [Google Scholar] [PubMed]
[Crossref] [Google Scholar] [PubMed]
[Crossref] [Google Scholar] [PubMed]
[Crossref] [Google Scholar] [PubMed]
[Crossref] [Google Scholar] [PubMed]
[Crossref] [Google Scholar] [PubMed]
[Crossref] [Google Scholar] [PubMed]
[Crossref] [Google Scholar] [PubMed]
[Crossref] [Google Scholar] [PubMed]
Citation: Clark T, Mukherjee A, Lichtlen P, Sweeney J (2024) Bayesian Interval Based Designs for Phase I Dose-Escalation Trials: A Case Study in Oncology. J Clin Trials. 14:566.
Received: 24-Apr-2024, Manuscript No. JCTR-24-30929; Editor assigned: 26-Apr-2024, Pre QC No. JCTR-24-30929(PQ); Reviewed: 10-May-2024, QC No. JCTR-24-30929; Revised: 17-May-2024, Manuscript No. JCTR-24-30929(R); Published: 24-May-2024 , DOI: 10.35248/2167-0870.24.14.566
Copyright: © 2024 Clark T, et al. This is an open-access article distributed under the terms of the Creative Commons Attribution License, which permits unrestricted use, distribution, and reproduction in any medium, provided the original author and source are credited.