Journal of Proteomics & Bioinformatics
Open Access
ISSN: 0974-276X
ISSN: 0974-276X
Research Article - (2010) Volume 3, Issue 10
Protein homodimers play a critical role in catalysis and regulation and their mechanism of folding is intriguing. The mechanisms of homodimer folding (2-state [2S] without intermediates and 3-state [3S] with either monomer [3SMI] or dimer [3SDI] intermediates) have been observed and documented for about 46 homodimers (27 2S; 12 3SMI; 7 3SDI) with known 3D structures. Determination of folding mechanisms through classical denaturation experiments is both time consuming, tedious, and expensive. Therefore, it is of interest to predict their folding mechanism. Furthermore, a large number of homodimers structures with unknown folding mechanism are available in the PDB. Hence, it is compelling to predict their folding mechanism using structural features intrinsic of each complex structure. Thus, we developed a classi fi cation and regression tree (CART) model using predictive parameters ((a) monomer protein size (ML); (b) interface area (B/2); (c) interface to total residues (I/T) ratio) derived from a dataset (46 homodimers with both known structures and folding mechanism) for folding mechanisms prediction. The dataset was subjectively divided into training (13 2S; 6 3SMI; 3 3SDI) and testing (14 2S; 6 3SMI; 4 3SDI) sets for validation. The model performed fairly well for predicting 2S and 3SMI in both during training and testing using ML and I/T as predictive variables. However, it should be noted that the performance of model in classifying 3SDI is poor. Nonetheless, the model was not stable with the inclusion of the predictive variable B/2 and hence, was not considered during training and testing. The CART model produced accuracies of 85% (2S), 83% (3SMI) and 100% (3SDI) with positive predictive values (PPV) of 100% (2S), 83% (3SMI) and 75% (3SDI) during training. It then produced accuracies of 100% (2S) and 50% (3SMI) with positive predictive values (PPV) of 74% (2S), 60% (3SMI) during testing. Thus, we then used the model to assign folding mechanisms to protein homodimers with known structures and unknown folding mechanisms. This exercise provides a framework for predicted homodimer structures with unknown folding mechanism for further veri fi cation through folding experiments. The CART model was able to assign folding mechanisms to all (169) the homodimer structures (with unknown folding data) due its automatically robust learning capabilities unlike the manually developed decision model which left some structures unassigned.
Homodimers play an important role in catalysis and cellular regulation. Moreover, a couple of homodimers have been described as cancer-targets (U.S. Patent office), (Tanaka et al., 2007; Schulke et al., 2003). Thus, the importance of homodimer structures is recognized. The formation of homodimers in cellular biology is interesting and the mechanism (2-state (2S), 3-state (3S)) of folding is more fascinating (Zhanhua et al., 2005). Two-state (2S) homodimers (Zhanhua et al., 2005; Wales et al, 2004; Bowie et al., 1989; Milla and Sauer, 1994; Steif et al., 1993; Jana et al., 1997; Topping et al., 2004; Stone et al., 2002; Grant et al., 1992; Bajaj et al., 2004; Kretschmar and Jaenicke, 1999; Johnson et al, 1992; Tamura et al., 1995; Gloss et al., 2001; Timm et al., 1994; Li et al., 1997; Kim et al., 2001; D'Alfonso et al., 2002; Dirr and Reinemer, 1991; Wallace et al., 1998; Kaplan et al., 1997; Ahmad et al., 1998; Mainfroid et al., 1996; Yang et al., 1994) fold without the formation of a stable intermediate. Three state (3S) homodimers fold with the formation of a stable dimeric (3SDI), (Ramstein et al., 2003; Zhu et al., 2003; Grimsley et al., 1997; Clark et al., 1993; Motono et al., 1999; Mei et al., 1997; Doyle et al., 2000) or monomeric (3SMI) intermediate (Mateu, 2002; Ruller et al., 2003; Apiyo et al., 2001; Malvezzi-Campeggi et al., 1999; Stroppolo et al., 2000; Malecki et al., 1997; Aceto et al., 1992; Gokhale et al., 1996; Park and Bedouelle, 1998; Wójciak et al., 2003; Liang et al., 2003). The folding data is obtained by denaturation techniques involving thermal and chemical agents. The denatured fraction is studied by CD, NMR and absorption. But these experiments are very time consuming and tedious. Thus, folding data is known only for a few homodimers, although large number of structures is known and available at the protein databank (PDB). Denaturation experiments (using temperature and chemical agents), although tedious to perform, have played a vital role in understanding the structural architecture and folding pattern of homodimers.
A review of unfolding data of homodimers by Neet and Timm. (1994) showed that some homodimers denature by a two-state equilibrium transition (2S) while others have stable intermediates in the process (3S). In addition, the conformational stability of these homodimers was found to be related to the size of the polypeptide and the nature of subunit interface. Li et al. (2005) identified structural parameters (based on 41 homodimer structures) for the classification of homodimers into 2S and 3S. The cluster of small-sized proteins with large interface area and high interface hydrophobicity were found to be 2S homodimers, while the cluster of large proteins with small interface area and low interface hydrophobicity were found to belong to the 3S category. This study shows the importance of structural features such as monomer protein size (ML) and interface area (B/2) for distinguishing 2S from 3S. Tsai et al. (1997) studied 187 stable and 57 symmetrically related oligomeric interfaces. The architecture of 2S interfaces was found to be similar to protein cores, where the monomer chains fold cooperatively. On the other hand, 3S interfaces were found to resemble binding of already folded proteins and mirrored the monomer architecture only in general outline.
Levy et al. (2004) suggested that the native protein 3D structure is the major factor governing the choice of homodimer folding and binding mechanism in 11 homodimers with known unfolding data. The study showed that as far as protein folding is concerned, the protein topology is the main factor governing the protein binding mechanism and the degree of topological frustration of a monomer determines whether the binding will occur between two unfolded or folded chains. Mei et al. (2005), defined Interface amino acid residue (IAR - distance between the first and last amino acid that take part in the inter-subunit interaction) and squared loop length (SLL - sum of the squared distances between two successive residues of the monomer) in 32 homodimer structures to find a possible correlation between protein size, sequence and quaternary structure. They propose that medium-sized proteins of classes A (2S) and C (3SDI) models are highly stable due to their large IAR and SLL .
Lulu et al. (2009) used a dataset of 42 homodimers and showed that interface to total (I/T) residues ratio is large for 2S than 3S (3SMI and 3SDI). I/T values of 3S structures clustered together despite varying monomer protein size. Thus, I/T ratio was considered as an important parameter for distinguishing 2S from 3S. Karthikraja et al. (2009) created a dataset of 47 homodimers (twenty-eight 2S, twelve 3SMI and seven 3SDI) to examine the types of interfaces. 2S proteins were observed to be small sized, 3SMI were medium sized, while 3SDI proteins often existed as large-sized proteins. I/T measure was also used to group 2S, 3SMI and 3SDI homodimers into categories with large I/T (>50%), moderate I/T (50-25%) and small I/T (<25%) interfaces. The study provided a 2-dimensional insight into the interaction of the interface residues, while considering 2S, 3SMI and 3SDI homodimers. Suresh et al. (2009) described a decision tree model to classify 47 homodimers whose folding data was already known (by denaturation experiments) (Wójciak et al., 2003). The model worked based on the structural parameters protein-size (ML), number of interface to total residue ratio (I/T) and interface Area (B/2) and yielded positive predictive values of 71.4%, 58.4% and 57.1% in classifying 2S, 3SMI and 3SDI respectively. The model was further drawn to predict the folding information to a set of homodimers structures whose folding information was not known. The manually set up decision model was able to establish relationship between structural features and folding mechanism despite its inability to assign some structures with folding mechanism. Thus, assignment of folding mechanism for homodimer structures is of both interest and need using simple yet robust classification models. Here, we describe the development, performance and application of a Classification and Regression Tree (CART) model based on structure derived predictive variables such as ML, I/T and B/2 for the prediction of homodimer folding mechanisms given structures.
Homodimer structure dataset with known folding mechanism: A dataset of 46 homodimers with known folding data (Table 1) was used in this analysis to develop the CART model. The dataset consists of 2S (27), 3SMI (12), and 3SDI (7) homodimers. The predictive parameters such (ML), interface area (B/2), and ratio of interface to total residues (I/T) were calculated for each entry in the dataset (Table 2).


Monomer length: Monomer length (ML) refers to the protein length of monomers forming the homodimer complex (Table 1). The ML range for 2S (45 - 271 residues), 3SMI (72 - 381 residues) and 3SDI (90 - 835 residues) is given in (Table 2).
Interface area (B/2): Interface area was calculated using change in solvent accessible surface area (ASA) from a monomer state to a dimer state. ASA was calculated using algorithm described and implemented in the software Surface Racer 5.0 (Tsodikov et al., 2002). 2S proteins have B/2 range between 156 and 2507Å2 and 3SMI proteins range within 309 and 2332Å2. However 3SDI dimers are found between 1351 and 2317 Å2.
Interface to total residue (I/T) ratio: It is the ratio between interface residues (number of residues per monomer involved in homodimer interactions) to the total number of residues in the monomer protein. 3SDI proteins lie in the range of 5 to 50% and 3SMI in the range of 9 to 44%; while the 2S proteins lie in the range of 6 to 80%.
Predictor variables: The predictor variables used in model development are monomer protein size (ML), interface-area (B/2), and interface residues to total residues number ratio (I/T). The minimum, maximum, average and standard-deviation values are shown for each predictor (Table 2).
Target variables: The three target variables defined in the model are 2S, 3SMI and 3SDI.
Training & testing dataset: The 46 homodimers dataset with known folding mechanisms is arbitrarily divided into 2 subsets of 22 homodimers (thirteen 2S; six 3SMI; three 3SDI) and 24 homodimers (fourteen 2S; six 3SMI; four 3SDI) representing the training and testing set, respectively.
CART model: Classification and Regression Tree (CART) is a robust decision-tree system used for data-mining and predictive modeling (Breiman et al., 1984; Steinberg and Colla, 1997). CART is also known as Binary recursive partitioning; binary because the data (parent node) is split into two child nodes based on certain splitting conditions; it is recursive because the process is repeated with the child node acting as the parent in the subsequent iteration. The CART looks for all possible splits in the group of predictor variables. The Geni impurity criterion (probability measure of misclassification in a group of known data) is used as the splitting rule by default. During the splitting process, intermediate nodes that can no longer be split from terminal nodes. When all the active nodes become terminal nodes, the tree growing process terminates. Each node of the decision tree (including the terminal node) presents some information about a target variable or a group of target variables.
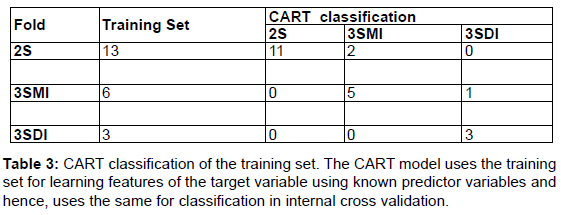
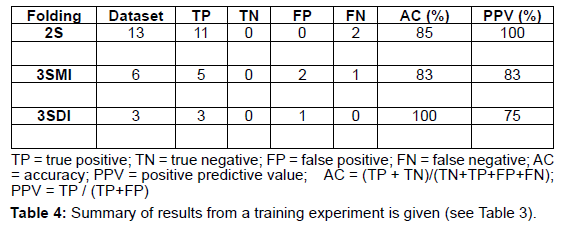
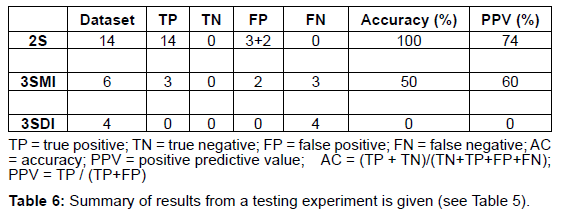
The CART version 6.0 (Salford Systems, http://salford-systems. com/cart.php) is used in this study. The Target (2S, 3SMI, 3SDI) and predictor variables (ML, I/T and B/2) are defined in the CART system. Figure 1 shows a flow-chart describing the methodology employed in the development of the CART model and its implementation. CART classification and model development consists of the training and the testing phase. In the training phase, CART reads the predictor variables from a training subset of 22 homodimers and learns to classify the dataset building an overly large tree (Table 3, Table 4). CART then classifies the testing set using the overly large tree and calculates the error rate. The largest tree or sub-tree with the minimum error rate is chosen as the CART model. The results from the testing phase are given in (Table 5, Table 6).


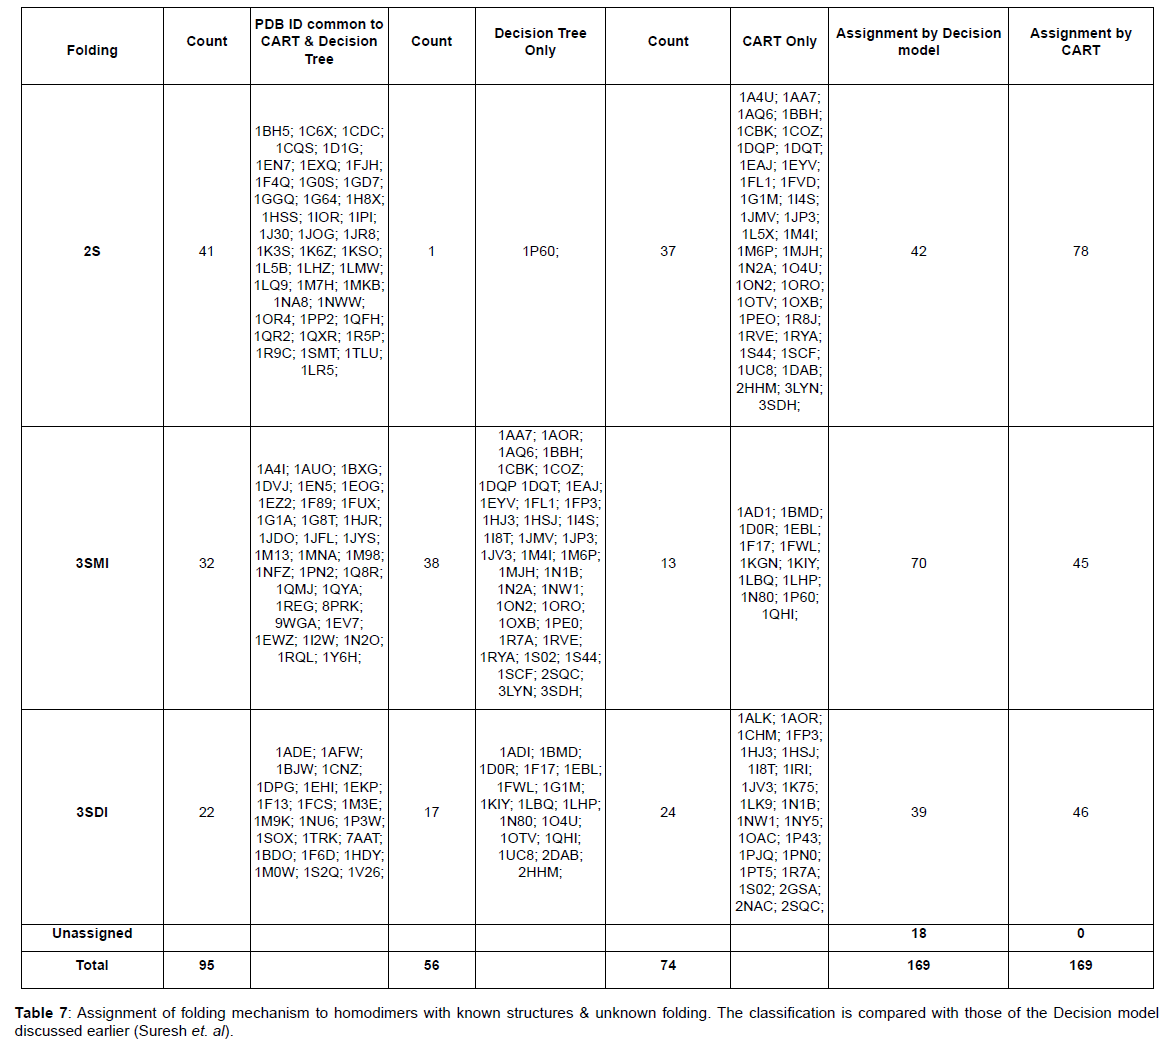
CART prediction: The CART model is then applied to predict the folding information to a dataset of 169 homodimers whose folding information was not known (Table 7).

A dataset of 46 known homodimer structures with known folding data collected from literature is given in (Table 1). The dataset of 46 homodimers is split indiscriminately into two subsets of 22 and 24 homodimers, each subset representing a uniform distribution of the protein folding types. The predictor variables (ML, B/2 and I/T) used in the model was calculated for each structure in training and testing test. (Table 2) shows the respective minimum, maximum, and average and standard deviation values of the predictors in the dataset The model uses predictor variables ML and I/T in the classification process during training and testing. Node 1 (root node) consists of the 22 homodimers. The data is split based on various conditions of the predictor variables at each level. At each intermediate node, a case went to the left child node if and only if a condition statement regarding the predictor variable was satisfied. The classification model consisted of 4 terminal nodes. Information regarding the distribution of folding cases (2S, 3SMI or 3SDI) is available at each node. Table 3 and Table 4 show the training results of the CART model. The CART classification model produced positive predictive values (PPV, ratio of true positives to the total number of true and false positives) 100%, 83.3% and 75% (with an accuracy of 84.6%, 83.4% and 100%) in classifying 2S, 3SMI and 3SDI homodimers respectively during the training phase. During the learning phase, CART trains on the training subset of 22 known homodimers, and develops a maximal tree. The model developed from training is further tested on the second subset of 24 homodimers (Table 5 and Table 6). The CART model displayed positive predictive values of 73.7%, and 60% (with an accuracy of 100%, and 50%) in testing the subset for 2S, and 3SMI, respectively. However, it was not able to perform well in predicting 3SDI during testing. The CART model is then applied to a dataset of 169 homodimers whose folding data is not known. A folding mechanism was assigned to all structures (Table 7) unlike the manually set up decision tree model as described elsewhere (Wójciak et al., 2003). The CART model classified 78 homodimers as 2S, 45 as 3SMI and 46 homodimers under 3SDI respectively. Table 7 also gives a detailed comparison of the results obtained from CART and the decision-tree studied earlier.
The mechanism of homodimer folding and binding was studied based on thermal denaturation experiments using fluorescence (Bowie et al., 1989; Milla and Sauer, 1994; Mok et al., 1996; Grant et al., 1992; Bajaj et al., 2004; Kretschmar and Jaenicke, 1999; Timm et al., 1994; Kim et al., 2001; D'Alfonso et al., 2002; Dirr and Reinemer, 1991; Wallace et al., 1998; Kaplan et al., 1997; Ahmad et al., 1998; Mainfroid et al., 1996; Zhu et al., 2003; Grimsley et al., 1997; Clark et al., 1993; Motono et al., 1999; Mei et al., 1997; Doyle et al., 2000; Mateu, 2002; Ruller et al., 2003; Apiyo et al., 2001; Malvezzi- Compeggi et al., 1999; Stroppolo et al., 2000; Malecki et al., 1997; Aceto et al., 1992; Gokhale et al., 1996; Wójciak et al., 2003; Liang et al., 2003), NMR (Tamura et al., 1995), Circular Dichroism (Wales et al., 2004; Bowie et al., 1989; Steif et al., 1993; Jana et al., 1997; Topping and Gloss 2004; Mok et al., 1996; Liang et al., 1991; Ruiz- Sanz et al., 2004; Topping et al., 2004; Stone et al., 2002; Bajaj et al., 2004; Li et al., 1997; Ahmad et al., 1998; Mainfroid et al., 1996; Ramstein et al., 2003; Grimsley et al., 1997; Clark et al., 1993; Motono et al., 1999; Mei et al., 1997; Doyle et al., 2000; Mateu, 2002; Ruller et al., 2003; Apiyo et al., 2001; Malvezzi-Campeggi et al., 1999; Stroppolo et al., 2000; Gokhale et al., 1996; Park et al., 1998) and absorption (Apiyo et al., 2001). Homodimers fold by three folding mechanisms (2S, 3SMI and 3SDI). Three dimensional structures for these homodimers with known folding mechanism are already available in the protein data bank (PDB). The consideration of homodimers as drug targets in cancer has been realized (Tanaka et al., 2007) (Shulke et al., 2003).Therefore, it is of importance to study homodimers binding and folding. The documentation of folding mechanisms for homodimers through denaturation experiments is tedious. Thus, folding mechanism is known only for a handful of such homodimers. A comprehensive literature survey identified 46 homodimer structures with known folding mechanism (Table 1). However, hundreds of structures are available in PDB with unknown folding mechanism (Table 7). Therefore, it is of interest to develop a CART based prediction model to assign folding mechanism to homodimers structures with unknown folding mechanisms. Suresh et al. (2009) developed a decision-model based on predictive structural parameters (ML, B/2, I/T). This model yielded positive predictive values of 71.4%, 58.4% and 57.1% in classifying 2S, 3SMI and 3SDI, respectively in a known dataset Application of this model to a dataset (169 structures) with unknown folding data resulted in 18 unassigned structures. This is due to the inability of the manually set-up decision model to assign function to the 18 structures. This then created interest to develop an automatically robust method for this purpose. Classification and Regression Tree (CART) was found as an alternative method for this application due to its robust learning capabilities from learning (training) set.
We describe the performance of the CART model in assigning folding mechanisms to homodimer structures. The dataset of 46 homodimers (whose folding data is known) is indiscriminately split into two subsets of twenty-two (22) and twenty-four (24) homodimers. One subset acts as the training set (13-2S; 6-3SMI; 3-3SDI) while the other acts as a testing set (14-2S; 6-3SMI; 4-3SDI). The CART algorithm develops an overly large classification-tree based on structural parameters I/T ratio and Interface Area (B/2) from the training set (Table 3 and Table 4) shows the results of the training phase, wherein 2/13 of 2S homodimers are misclassified as 3SMI, 1/6 of 3SMI homodimers have been misclassified as 3SDI, while no misclassification is seen in 3SDI. The model thus created was found to yield positive predictive values 100%, 83% and 75% (with an accuracy of 85%, 83% and 100%) in learning to classify 2S, 3SMI and 3SDI homodimers respectively. Thus, an overly-large tree is grown by the end of the training phase. CART classifies the test sample to determine the misclassification rate of the largest tree or every sub-tree developed in the training phase. The tree or sub-tree with the lowest misclassification rate is chosen as the CART model. The testing-phase CART showed positive predictive values of 74%, and 60% (with an accuracy of 100%, and 50%) in classifying 2S, and 3SMI homodimers respectively (Tables 5 and Table 6). However, the CART model was not able to classify the 3SDI appropriately. The CART was found to perform better than the decision model in classifying 2S and 3SMI.
The CART model was then applied to a larger dataset of 169 homodimers whose folding data was unknown. CART was able to assign folding information (target-variable) to all the unknown homodimers when the structural data from the dataset was passed through the classification model (Table 7). The decision-model was unable to fit 18 structures unlike the CART model. This was because the parameter values of these unassigned homodimers did not fall into any of the condition values set by the decision-tree. CART categorized 78, 45 and 46 homodimers of the dataset were into 2S, 3SMI and 3SDI homodimers respectively, while the decision model grouped 42, 70 and 39 homodimers into 2S, 3SMI and 3SDI, respectively. These results not only emphasize the importance of the structural features in the prediction of homodimer folding, but also prove CART to be a robust and efficient method for classification and prediction of features in multi-parameter datasets, compared to its predecessor. Further, the predicted data serves as a framework for better understanding of the folding mechanism given their structures. It should be kept in mind that these predicted results should be further verified using denaturation experiments.
Homodimer proteins fold through 3 different mechanisms 2S, 3SMI and 3SDI and are grouped accordingly. The presence of homodimers with unknown folding data emphasizes the need for a more efficient fold classification and prediction method. It was of interest to use the CART system in development of a classification model and further predict the folding information to an unknown dataset of 169 homodimers. The model performed fairly well for predicting 2S and 3SMI in both during training and testing using ML and I/T as predictive variables. However, it should be noted that the performance of model in classifying 3SDI is not discriminative in nature. Nonetheless, the model was not stable with the inclusion of the predictive variable B/2 and hence, was not considered further for prediction during training and testing. The CART model produced accuracies of 85% (2S), 83% (3SMI) and 100% (3SDI) with positive predictive values (PPV) of 100% (2S), 83% (3SMI) and 75% (3SDI) during training. It then produced accuracies of 100% (2S) and 50% (3SMI) with positive predictive values (PPV) of 74% (2S), 60% (3SMI) during testing. Thus, we then used the model to assign folding mechanisms to protein homodimers with known structures and unknown folding mechanisms. This exercise provides a framework for predicted homodimer structures with unknown folding mechanism for further verification through folding experiments. The CART model was able to assign folding mechanisms to all (169) the homodimer structures (with unknown folding data) due to its automatically robust learning capabilities unlike the manually developed decision model which left some structures unassigned.
PK conceived the idea. AS designed the experiment and performed the analysis with summarized results. PL participated in the analysis and helped in manuscript preparation.