Fisheries and Aquaculture Journal
Open Access
ISSN: 2150-3508
ISSN: 2150-3508
Research Article - (2015) Volume 6, Issue 4
In an aquatic ecosystem, the density and diversity of organisms depend on availability and quality of water. During the present study an attempt was made to analyse some of the important physico-chemical parameters of the water samples at three different sites of the Manasbal Lake to check the pollution load. Various parameters were analysed for a period of six months from July 2010 to December 2010 on monthly intervals by following standard methods. Among the various parameters recorded the overall Air temperature ranged from 7.2°C to 30.2°C; surface water temperature ranged from 6.1°C to 26.5°C; Secchi-disc transparency from 1.5 m to 4.5 m; Conductivity varied from 149 to 292 μS cm-1; Dissolved oxygen from 2.5 to 8.8 mg L-1; Free Co2 from 0.2 to 13.4 mg L-1; pH from 8.1 to 9.2; Total Alkalinity varied from 126 to 243 mg L-1; Chloride values ranged from 5.9 to 33.5 mg L-1; Total Hardness ranged from 119 to 218 mg L-1; Ammonical Nitrogen varied from 27 to 193 μg L-1; Nitrate Nitrogen varied from 31 to 286 μg L-1; Ortho-Phosphate Phosphorous varied from 4.3 to 33.0 μg L-1 and Phosphate Phosphorous ranged from 83.0 to 261 μg L-1. Almost all the above parameters showed that the pollution load is increasing especially at littoral sites due to agricultural run-off and human settlements disposing sewage, besides anthropogenic stresses in the catchment area. The pH of water of this lake was higher due to calcium intrusion from Kondabal area. Hence, the present study urges the need for immediate remedial measures for protection and conservation of this lake in order to save it from further deterioration.
Keywords: Manasbal lake, Physico-chemical parameters, Eutrophication, Pollution.
The nature and health of any aquatic community is an expression of quality of the water. The quality of water affects the species composition, abundance, productivity and physiological conditions especially, the indigenous population of aquatic organisms [1]. The alteration in physico-chemical parameters leading to eutrophication has became widely recognized problem of water quality deterioration [2]. In recent years increase in human population, demand for food, land conversion and use of fertilizer have led to faster degradation of many freshwater resources [3,4]. The Kashmir valley located in the foothills of the Himalayas abounds in fresh water natural lakes that have also faced various anthropogenic activities and have resulted in heavy inflow of nutrients into these lakes from the catchment areas. These anthropogenic influences not only deteriorate the water quality but also affect the aquatic life in the lakes, as a result of which the process of aging of these lakes is hastened [5,6]. As a consequence, most of the lakes in the Kashmir valley are exhibiting eutrophication [7,8]. It is now quite common that most of the plain valley lakes of Kashmir are characterized by excessive growth of macrophytic vegetation, anoxic deep water layers and shallow marshy conditions along the peripheral regions and have high loads of nutrients in their waters [9]. The present paper includes study of physico-chemical parameters in water of Manasbal Lake, a tourist spot in Safapora town of District Ganderbal in Jammu and Kashmir.
The Manasbal Lake is located at district Ganderbal about 32 kilometers away towards North West of Srinagar city in the State of Jammu and Kashmir, India. The lake is situated at an altitude of 1583 m asl and lies between 34°15’ N latitude and 74°40’ E longitude. The lake covers an area of 2.81 km2 with maximum depth of 13 m. The volume of water has been estimated as 12.8 × 10⁶ m3 [10]. The lake catchment covers an area of about 22 km2. The lake has no major inflows and its water supply is chiefly derived from internal springs and precipitation. The lake is surrounded by many villages among which Kondabal and Hanji Mohalla are very important as far as health and vigour of the lake is concerned. Kondabal is the place of kilns, quarries and mines is significant as far as the calcium intrusion into the lake is concerned. Hanji Mohalla is inhibited by fishers from which lot of organic matter and other pollutants enter into the lake. Manasbal is a marl lake, has predominantly rural surrounding. Currently, one of the visible problems within the lake is eutrophication.
Study sites (Figure 1)
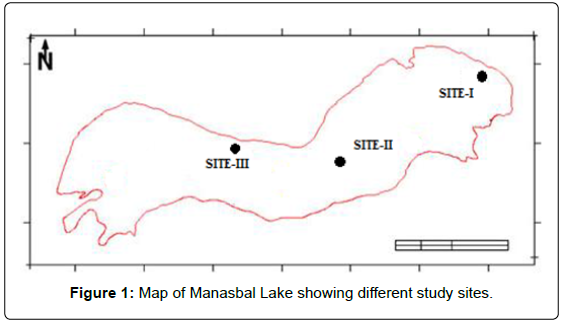
Figure 1: Map of Manasbal Lake showing different study sites.
Three different sites were selected for the present study on the basis of pollution load as:
Site-I: Littoral site near Manasbal Garden (Ghat) and Kondabal and usually with high density of aquatic macrophytes.
Site-II: Central limnetic site representing the open water zone with a maximum depth and relatively a lesser density of macrophytic vegetation, the water at this site is relatively clear with a greater degree of visibility.
Site-III: Littoral site near Hanji Mohalla which is surrounded by residential hamlets, exposed to myriad of interference, such as emission of domestic sewage and washing of clothes and other activities.
Sampling
Water samples were collected from the selected sites on monthly basis for a period of six months from July 2010 to December 2010. The water samples were collected during second week of each month from different study sites. Samples were analysed according to standard methods as described by [11-13]. Some of the parameters like temperature, transparency, pH were determined at the field site. For dissolved oxygen, water samples were fixed on the spot in BOD bottles as per the Winkler’s modified method whereas the other parameters were analysed at the laboratory.
The maximum and minimum values of various physico-chemical parameters at three different sites is given in (Table 1).
| S.no | PARAMETER | SITE-I | SITE-II | SITE-III |
|---|---|---|---|---|
| MAX MIN | MAX MIN | MAX MIN | ||
| 1. | AIR TEMPERATURE (°C) | 30.2 (JULY) 7.9 (DEC.) | 29.0 (JULY) 7.2 (DEC.) | 29.8 (JULY) 7.5 (DEC.) |
| 2. | WATER TEMPERATURE (°C) | 26.5 (JULY) 6.6 (DEC.) | 25.8 (JULY) 6.1 (DEC.) | 26.1 (JULY) 6.3 (DEC.) |
| 3. | SECCHI TRANSPARENCY (m) | 2.9 (DEC.) 1.8 (JULY) | 4.5 (DEC.) 3.3 (JULY) | 2.4 (DEC.) 1.5 (JULY) |
| 4. | CONDUCTIVETY (μScm-1) | 280 (AUG.) 192 (DEC.) | 170 (AUG.) 149 (DEC.) | 292 (AUG.) 268 (DEC.) |
| 5. | DISSOLVED OXYGEN (mgL-1) | 8.3 (DEC.) 4.3 (JULY) | 8.8 (DEC.) 4.5 (JULY) | 7.0 (DEC.) 2.5 (JULY) |
| 6. | FREE CARBONDIOXIDE (mgL-1) | 12.0 (DEC.) 0.2 (JULY) | 10.2 (DEC.) 2.2 (JULY) | 13.4(DEC.) 3.9 (JULY) |
| 7. | PH | 9.2 (JULY) 8.5 (DEC.) | 8.9 (AUG.) 8.2 (DEC.) | 8.9(AUG.)8.1 (DEC.) |
| 8. | TOTAL ALKALINITY (mgL-1) | 237 (DEC.) 175 (JULY) | 154(DEC.)126 (JULY) | 219 (DEC.)163 (JULY) |
| 9. | TOTAL HARDNESS (mgL-1) | 218 (SEPT.) 161 (NOV.) | 137 (SEPT.)119(NOV.) | 178(OCT.)146(DEC.) |
| 10. | CHLORIDE (mgL-1) | 21.2 (DEC.) 8.8 (JULY) | 12.3(DEC.)5.9 (JULY) | 33.5 (DEC.)18.0 (AUG.) |
| 11. | PHOSPHATE PHOSPHOROUS (μgL-1) | 202(JULY)143 (DEC.) | 142(JULY)83 (DEC.) | 261 (JULY)189(DEC.) |
| 12. | ORTHO-PHOSPHATEPHOSPHOROUS (μgL-1) | 29(OCT.)12 (DEC.) | 17(AUG.)4.3 (DEC.) | 35 (OCT.)17(DEC.) |
| 13. | AMMONICAL NITROGEN (μgL-1) | 138(DEC.)84 (JULY) | 63(DEC.)27 (JULY) | 193(DEC.)109(JULY) |
| 14. | NITRATE NITROGEN (μgL-1) | 201(JULY)116 (OCT.) | 109 (JULY)31 (NOV.) | 286 (JULY)178 (NOV.) |
Table 1: The maximum and minimum values of various physico-chemical parameters at three different sites.
Temperature
In the present study, air temperature ranged between 7.2°C in December at site-II to a maximum of 30.2°C in July at site-I. The lowest water temperature observed in December at site-II was 6.1°C and highest was observed in July at site-I viz., 26.5°C. This is because of the shallowness of the lake and consequently the volume of water in contact with air. Therefore, a close relationship was recorded between water temperature and air temperature which is in line with the findings of [14].
Transparency
Transparency is one of the important physical properties of water and is indicative of degree to which sunlight can pass through the water. During the present study the values for transparency obtained at site-II ranged between 4.5 m (December) to 3.3 m (July) and at site- III ranged between 2.4 m (December) to 1.5 m (July). However, on the whole Secchi disc transparency was low at the littoral sites being minimum at site-III which may be due to the increased suspended matter, silt load and humus brought in from the catchment area as well as due to rich macro-vegetation. Transparency was higher in winter and low in spring and summer. This condition has been attributed to different factors viz., plankton population settling of materials in calm weather suspension of phytoplankton in water glacial silt [14-17].
Conductivity
The conductivity value is an indicator of the total nutrient level of a water body. Using specific conductivity as an index, values higher than 200 μS/cm show higher level of nutrient enrichment [18]. During the present study conductivity reported was within the range of 149 μS/cm in December at site-II to 292 μS/cm in August at site- III. The values were higher at site-III because of more polluted water. A report that high level of conductivity reflects the pollution status as well as trophic level of the lake [19].
Dissolved oxygen
Dissolved oxygen is an important regulator of metabolic processes of the organisms and also the community as a whole [20]. Its concentrations in natural water depend on the physical, chemical and biological activities in the water body [21]. During the present study the highest dissolved oxygen level was observed at site-II in December viz., 8.8 mg/l and lowest in July at site-III viz., 2.5 mg/l. The higher values of dissolved oxygen during winter and low values during summer months thus clearly reflecting an inverse relation of dissolved oxygen with the temperature. Dissolved oxygen levels during winter can also be attributed to low biological activity [22].
Free carbon dioxide
Free carbon dioxide of most waters is not present in large quantities because of its reaction in the carbonate equilibrium and exchange with atmosphere [1]. In the present study lowest Co2 concentration was observed during July at site-I viz., 0.2 mg/l whereas the highest concentration of Co2 was reported at site-III viz., 13.4 mg/l in December. Slight temperature variation can alter solubility of oxygen and carbon dioxide in water [23]. The higher values towards winter may be due to the decreasing temperature and addition of high organic matter from catchment area.
Hydrogen ion concentration (pH)
All chemical and biological reactions are directly dependent upon pH of the water system [24]. The pH of this lake was found higher in all months due to addition of calcium in water from Kondabal. The highest value of pH was observed during July at site-I viz., 9.2 where as the lowest value was observed at site-III in December viz., 8.1. Fluctuations in pH seems to be influenced by the changes in the rate of photosynthesis and decomposition. This is in conformity with the conclusion drawn by [25]. Generally lower values were recorded in cold season.
Total alkalinity
The total alkalinity in the lake was less in July at site-II viz., 126 mg/l and highest at site-I viz., 237 mg/l in December. The increase in alkalinity during winter may be due to the accumulation of bicarbonate ions in these months as the rate of their uptake is declined. The decrease in the alkalinity in summer is due to the decrease in bicarbonate ions in summer because of its utilization by luxuriant growth of phytoplankton and macrophytes. These findings are in agreement with [26,27] observed that alkalinity of water is mainly due to bicarbonates of calcium and magnesium. Total alkalinity has been used as a rough index of lake productivity [28,29] designated the lake water having alkalinity values upto 40 mg/l as soft, those with 40-90 mg/l as medium hard and those with values above 90 mg/l as hard types. During present study alkalinity was reported above 126 mg/l at all the sites and hence is designated as hard type lake.
Total hardness
The two most common bivalent cations of lake water are Ca and Mg usually account for most of the hardness. The carbonate hardness of water which includes the portion equivalent to carbonate and bicarbonate in water has been called temporary hardness. Permanent hardness is caused by sulpates and chlorides of bivalent cations. During the present study highest total hardness value was observed during September at site-I viz., 218 mg/l and lowest was observed in November viz., 119 mg/l at site-II. Regards water with a hardness value of less than 24 mg/l CaCo3 as soft and above 24 mg/l as hard.
Chloride content
Chloride content in water is regarded as an indication of organic load of animal origin from the catchment area [30]. High chloride concentration in water body is related to organic pollution of animal origin [31]. During the present study highest chloride concentration was observed at site-III viz., 33.5 mg/l in November and lowest in July viz., 5.9 mg/l at site-II. The higher values at site-III may be due to the activities like washing of clothes, drying of dung cakes at the catchment area, domestic wastes etc.
Phosphorous and ortho-phosphorous
Phosphorus plays a central role in eutrophication of water bodies. The low orthophosphate-phosphorous content in waters is due to the formation of an insoluble calcium-phosphate complex. Such a phenomenon functions as scavenger of some inorganic nutrients and also acts as a removal agent of dissolved organic matter by absorption. During the present investigation highest concentration of orthophosphate-phosphorus was found at site-III in October viz 33 μg/l and lowest at site-II in December viz 4.3 μg/l. Highest concentration of phosphate- phosphorus was found at site-III in July viz 261 μg/l and lowest was found at site-II in December viz 83 μg/l. This can be attributed to the fact that the major sources of phosphorus are domestic sewage, detergents and agricultural effluents. Related the increased phosphorus concentration to sewage contamination [20] is of the opinion that the formation of algal bloom is due to high phosphorus concentration, which leads to the eutrophication as a result of which several water bodies have perished [32].
Ammonical-nitrogen
Ammonia is basically a product of decomposition. Its concentration during the study period was generally low because of the utilization of nitrogenous compounds like NH4-N by plants. During present study highest concentration of ammonical nitrogen was observed in December at site-III viz 193 μg/l and lowest at site-II in July viz 27 μg/l. Higher concentration at site-III may be due to the entry of domestic sewage and use of other nitrogenous pollutants like fertilizers in the catchment area. The lowest value of ammonical nitrogen during summer attributed to the photosynthetic assimilation by autotrophs during their growth in late spring and early summer [33].
Nitrate-nitrogen
The presence of nitrates in any aquatic ecosystem depends on the activity of nitrifying bacteria. The conversion of nitrates from ammonia in nitrification process by Nitrobacter and Nitrosomonas chiefly depends upon the presence of oxygen. Nitrate is the common form of inorganic nitrogen entering freshwater from the draining basin, ground water and precipitation and mostly occurs in low concentration [34]. During the present study highest concentration of nitrate was observed in July at site-III viz 286 μg/l and lowest at site-II in November (31 μg/l). This can be attributed to its locking up in luxuriant macrophytic population.
From the present study it can be inferred that the littoral sites were more polluted and eutrophic than central limnetic site. The most polluted area of lake was site-III (Hanji Mohalla) followed by site-I near Manasbal Garden (Ghat) and the least polluted was site-II (Central site). The higher values of nitrogen, phosphorus, chloride, alkalinity, hardness, conductivity, free Co2 and lower values of dissolved oxygen and transparency are clearly pointing towards higher trophic status of the lake especially at littoral sites. Some of the possible causes of deterioration of water quality of the lake include agricultural runoff and human settlements disposing sewage, besides anthropogenic stresses in the catchment. Hence, the present study urges the need for immediate remedial measures for protection and conservation of this lake in order to save it from further deterioration.