Research Article - (2025)Volume 11, Issue 1
Cloning and Expression of VP1 Protein for Large-Scale Production in E. coliTOP10
Elham Omer Mahgoub1* and Galal M. Abdella2Abstract
The VP1 capsid gene is essential for expressing a protein that enables the diagnosis of Chicken Anemia Virus (CAV) infection in chicken flocks. In this study, the prokaryotic expression vector pRSET–B expressed the VP1 gene in E. coli Top10. The VP1 protein was expressed in E. coli TOP10 as a soluble fusion protein. The solubility of the VP1 protein activates the immunogenic epitope to make it easily detected using an anti-VP1 monoclonal antibody at 50 kDa. The batch fermentation process was used to scale up the production of VP1 protein in E. coli. As a result, the recombinant VP1 protein successfully increased the yield of the expressed VP1 protein during high bacterial cell density culture. Dialysis and desalting increased the specific activity and the final yield of the VP1 protein fraction when the Tangential Flow Filtration (TFF) step was used. The statistical calculation of indirect and commercial ELISA tests indicated that indirect ELISA can compete with commercial tests with a lower amount of solution, lower costs, and higher specificity. The VP1 protein expressed in batch fermentation bacterial culture was tested as an antigen to detect antibodies to CAV in infected chickens using the developed indirect Enzyme-Linked Immunosorbent Assay (ELISA).
Keywords
VP1 capsid gene; E. coli TOP10; CAV; Batch fermentation; Indirect ELISA
Introduction
Worldwide, Chicken Anemia Virus (CAV) is reported as a viral disease infecting chickens, which causes plastic anemia in chickens [1,2]. The virus size is 2.3 kb and has the shape of icosahedra. CAV has a circular genome with small single-stranded DNA covered with the capsid gene [3,4]. Following vertical transmission in eggs, CAV affects young chicks. It is stated that the death connected with anemia, lymphoid depletion, and bone marrow hyperplasia among the infected young chicks is very high. It is also behind other predominant sub-disease problems in the affected farm [5,6]. Generally, CAV contains three significant proteins. First, the viral capsid protein is called Viral Protein 1 (VP1) [7-10]. The second protein in the early gene regulatory protein is called Viral Protein 2 (VP2) or a scaffold protein that interacts transiently with VPI [11-14]. The third is Viral Protein 3 (VP3), which has an essential role in forming CAV, which causes apoptosis in chicken flock-transmitted lymphoblastoid-infected cells [15,16].
Generally, the biological activity of VP1 protein is affected by the low quantity of the protein expressed in E. coli TOP10 either because the protein overlapped with E. coli TOP10 proteins or overlapped in low quantity. Accordingly, the high-scale production of E. coli in batch fermentation increases the construction of the VP1 capsid protein of the Chicken Anemia Virus (CAV). This technology is widely used to produce recombinant proteins in high quantities. Large-scale fermentation of E. coli is a technology operated in either batch or fed-batch mode [17]. A batch mode is an increasing number of organisms that host the protein of interest in fermentation processes. The host system can be bacteria, yeast, filamentous fungi, animal cells or insect cells [18-24]. This study used a batch fermentation mode in the E. coli bacterial host.
Large-scale fermentation of E. coli TOP10 is used to manufacture the VP1 recombinant protein of Chicken Anemia Virus (CAV) with high cell density [25]. The investigations focused on increasing unit cell concentrations in high cell density cultivation with little care for recombinant protein-specific cellular yield. However, maximizing the volumetric productivity of recombinant protein is the primary goal of batch fermentation research, i.e., to obtain the highest amount of product in a given volume in the shortest amount of time [26,27]. Furthermore, the specific cellular protein yield is usually maintained during high cell- density fermentation [28]. Recombinant protein yield in high cell density cultures depends on promoter systems, plasmid stability, plasmid copy number, and the effects of feeding strategies before and during induction [29-32]. Recombinant protein production has been further aided by automatic control algorithms that adjust the substrate feed rate based on feedback from acetic acid concentration and dissolved oxygen [33-36].
This study investigates the VP1 protein of CAV expressed in E. coli TOP10 host batch fermentation. The VP1 protein was expressed as a fusion protein to many Tage proteins connected with the pRSET-B expression vector. In addition, the metabolic load during the expression of viral protein-1 considering the low expression concentration within the particular development rate of E. coli TOP10 was examined during bunch maturation, which concurred with many studies [34,37,38]. In addition, an ineffective translocation/transport system of expressed proteins further significantly decreased the protein expression. Therefore, this study suggested that optimizing the transcription of heterologous genes is critical to escape these disadvantages and develop a successful fermentation system. The cultures appropriately induced the recombinant protein to maximum capacity. Therefore, this study hypothesized that the low yield of protein expressed by E. coli TOP10 could be overcome by optimizing growth parameters in batch fermentation. In this study, this finding proved statistically by calculating the differences in detection of indirect ELISA test and compares it with commercial IDEXX ELISA.
Materials and Methods
Construction of the pRSET-B plasmid
As described by Mahgoub, et al. and as shown in Figure 1, the VP1 protein was expressed as a fusion protein using the pRSET-B expression vector and a forward 5'GGGGTACCCCATGGCAAGACGAGCTCGCAGA3' and reverse 5'TACATGACCCCCTGCGTCGGGCCTTAAGGC3' set of primers [6]. The digestion reaction was carried out in a 40 μl volume containing 2 μl of EcoRI and 2 μl of KpnI, 10 μl of pRSET-B vector or 10 μl of VP1 gene, 6 μl of multicore buffer (Promega, USA), and 0.6 μl of bovine serum albumin (BSA) (Promega, USA), and the final volume was adjusted to 40 μl with distilled water. The digested mixture was incubated at 37°C overnight. The restricted fragments were separated by 0.4% gel electrophoresis. The desired bands were determined using UV light, cut into small slices containing the desired bands of 1.4 kb of VP1 and 2.9 kb of pRSET-B and purified using a gene clean purification kit.

Figure 1: Large-scale production of Vp1 protein using E. coli Top10 bacterial host using batch fermentation, the expressed active protein then used to prepare indirect ELISA.
The pRSET-B vector and VP1 gene were ligated in a reaction mixture containing 1 μl (80 ng/μl) of double digested vector, 3 μl (40 ng/μl) of VP1 gene, 1 μl of 10X-ligation-buffer and 1 μl of T4 ligase DNA (0.4 Weiss unit) (Promega, USA). The final volume of the reaction mixture was adjusted with distilled water to 10 μl and incubated at 16°C overnight. These methods were explained by Mahgoub, et al. [39].
Transformation of the pRSET-B plasmid into E. coli TOP10
E. coli TOP10 competent cells were mixed with VP1 gene and pRSET-B vector ligated products and incubated on ice for 30 min with slit mixing. Then, the mixture was placed in a water bath at 42°C for 90 s. The mixture was then moved to ice. Then, LB broth (250 μl) was added to the mixture and incubated at 37°C for 1 h. After 1 h of 37°C incubation, 50 and 100 μl of the mixture were streaked on the culture plates and incubated overnight at 37°C. Fifteen colonies were selected and inoculated into 25 ml of LB broth the following day. The colonies were then analyzed using two methods of positive cloning detection. First, double digestion of the recombinant plasmid with restriction enzymes (EcoRI and KpnI) was used further to confirm the presence of the VP1 gene in pRSET-B. The gene insertion was further directly investigated by PCR amplification using melted agarose gel containing the VP1 gene as a template. The 25-ml LB broth culture was then used to inoculate (250 ml) LB broth medium, which was added to the culture and incubated for 18-24 h until its optical density (OD600) reached 0.6. This final culture was then used as the first seed in the batch fermentation process.
Fermentations parameters and media
The fermentation experiment was carried out in 2 L of LB broth via seeding by 10% v/v (200 ml) of bacterial culture in a defined high cell density media to an optical density OD600=0.6 at 30°C. The batch medium contained 20 g/L glucose and 50 μg/ ml ampicillin, the pH was maintained at 7.0 and dissolved oxygen at levels greater than 100%, and the stirrer speed was 450 rpm. When needed during cultivation, sterile antifoam (Sigma) was added through a filtering syringe. The fermentation temperature was 30°C.
Analysis of fermentation parameters
The cell density was determined by measuring the culture's Optical Density (OD) at 600 nm with a UV-visible spectrophotometer (Eppendorf). Higher OD samples were suitably diluted to have absorbance in the range of 0.2-0.6. Dry cell weight was determined by centrifuging the sample broth at 10,000 rpm for 10 min at 4°C and drying the washed cells to constant weight at 105°C overnight. One absorbance unit was equivalent to 0.4 g/L Dry Cell Weight (DCW) for induced culture. The specific growth rate is (μ=(1/x) dx/DT), where x is the cell concentration [40]. The specific growth rate was calculated from the straight line slope obtained by plotting × versus time t using the exponential equation of the growth phase. In other words, the specific growth rate of the bacterial cell was calculated by counting the mass of the produced cells divided by the mass of original cells versus time. Samples for OD600 and DCW were taken at 0 (i.e., before initiation), 2, 4, 6, 8, 10, 12, 14, 16, 20, 22 and 24 h.
Bacterial strain and culture media
Recombinant E. coli was used for batch fermentation with protein expression. First, bacterial stock (25 ml) was placed into 200 LB broth medium and incubated at 30°C overnight on a rotary shaker (at 200 rpm) until an OD600 value of 0.6. Then, the fermenter was inoculated with a volume of 10% (200 LB) with 2 L of LB of exponentially growing bacterial culture and incubated at 30°C for 24 h until the OD600 value was 2.154. The expression of recombinant protein was induced near the end of the fermentation when the OD600 was 2.154 by adding 1.0 mM Isopropyl-��-D-Thiogalactopyranosides (IPTG) to induce the VP1 recombinant protein at 19 h (5 h before the reaction was stopped). Then, the growing bacterial culture samples were collected from the reactor at different time points and spun at 12,000 rpm for 30 min, and the cell pellet was resuspended in 200 ml of HEPES (pH 7.6). Next, the cell suspension was sonicated for lysis. Then, to remove contaminating salt and detergent, the cells were washed with distilled water and spun at 12,000 rpm for 30 min, and the pellet was resuspended in 200 ml of HEPES (pH 7.6). Samples of the supernatant of VP1 soluble protein were run into SDS-PAGE to estimate VP1 protein purity.
Protein precipitation
The protein was precipitated according to the following steps. First, solid ammonium persulfate (4.41 g) was added to 30 ml of the protein sample to obtain 55% saturation. Then, ammonium persulfate powder was slowly added to the soluble protein with constant stirring. The stirring continued until the desired saturation level was achieved. The solution was then placed on ice for 30 min to ensure that the protein was entirely precipitated. The precipitated protein was then centrifuged at 10,000 rpm at 4°C for 30 min. Finally, the collected pellet was resuspended in 30 ml of buffer A (HEPES pH 7.8). The protein was then ready to be added to buffer B (Tris sodium pH 8) to remove the ammonium persulfate and ready for the dialyzed step.
Protein dialysis and purification using TFF
Tangential Flow Filtration (TFF) ultrafiltration of a 10,000 MW- limit filter unit (Millipore) for protein desalting and concentration was used to dialyze and purify the protein samples. First, the protein sample was prepared using low-speed centrifugation. Then, the samples were subjected to dialysis against 500 ml of dialysis solution (150 mM NaCl and 50 mM CaCl250 mM, MgCl2, pH 5.4) for 120 min. Next, the dialyzed protein samples were further concentrated by centrifugation for 10 min at a speed of 10,000 rpm. Finally, the supernatant containing the purified VP1 protein samples was dialyzed against 500 ml of distilled water for 16 h. The protein content in the samples was determined using a Protein Assay Kit (Bio-Rad, USA). In addition, the collected samples were analyzed for VP1 protein by SDS-PAGE.
Protein characterization using western blot analysis
The transfer of protein gel to PVDF membrane was performed employing a semidry electroblotting framework (Bio-Rad, USA). The PVDF membrane was obtained from Immobilon-P, Millipore Corp, USA. The transfer process was performed in a buffer (192 mM glycine, 25 mM Tris-Base, and 20% (w/v) methanol) for 45 min at 15 V. The membrane blocking process was performed for one hour in a washing buffer of 0.05% Tween 20 in PBS and 1% bovine serum albumin in PBS. With gentle mixing, the membrane was incubated with an anti-VP1 monoclonal antibody (Trop Bio) in blocking buffer at 37°C for 120 min. The membrane was washed three times for 5 min each time. Immediately, the membrane was incubated with Bio-Rad conjugate (goat anti- mouse IgG-AP) for 120 min at 37°C. The conjugate contained blocking buffer with an addition to 150 mM NaCl and 100 mM Tris to decrease the imaging background. The membrane was washed three times for 5 min each time. Then, DAB substrate was added to the membrane and incubated in the dark for 5 min. The response was ceased with purified water. The protein band was observed under UV using a ChemiDoc System (Bio-Rad).
Statistical analysis for optimum indirect ELISA
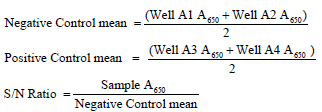
CAV ELISA procedure for antibody detection: The preparation and usage of the CAV-coated-antigen plate allowed for the detection of CAV antibodies. Plates A1 and A2 received 100 μl of negative sera, and plates A3 and A4 received 100 μl of positive sera. Additionally, duplicate plates were filled with 100 μl of the diluted serum samples (1:50), which were then incubated at 37°C for 60 minutes. The plate was then washed three times in 350 μl of washing solution. Following that, 100 μl of goat anti-chicken horseradish peroxidase conjugate had been added to each well. The plate was then rinsed with a washing solution after being incubated at 37°C for 30 minutes. Each well received a 100 μl TMB substrate, it was then kept at room temperature for 15 minutes. After that, the absorbance was measured using an ELISA reader (Dynatech, MR7000, USA) with a wavelength of 650 nm. xChek software (IDEXX Laboratories) was used to evaluate the commercial IDEXX ELISA. The sample-to-negative (S/N) ratio for each sample was used to determine whether or not CAV antibodies were present:
Antigen optimisation: In 0.05 M coated buffer (Appendix D2), the isolated VP1 protein was diluted at 1:10, 1:50, and 1:100, 100 (v/v). Each diluted Antigen was coated into the plate with 100 μl, and then the plate was covered with parafilm paper and left to incubate at 4°C overnight. Three washings with washing buffer were performed on the coated plate. The plate was then tapped dry. Following an overnight blocking step at 4°C with 100 μl of 2% Bovine Serum Albumin (BSA) made in washing buffer, the plate was then washed three times with washing buffer.
Conjugate optimisation: The ELISA test employed the goat anti-chicken IgG-HRP (KPL, USA) conjugate. The conjugate was initially diluted in washing buffer at dilutions of 1:1000, 1:2000, 1:4000, 1:8000, and 1:16000. The ideal incubation response time was subsequently established.
Determination of cut off OD level: ELISA performance should be evaluated using the cut-of level point. From SPF chickens, a total of 23 negative sera were collected. After that, the mean OD and Standard Deviation (SD) were calculated. The formula for the cutoff OD level was: Cutoff OD level=mean OD+3 SD. Standard curve of indirect ELISA.
To get the standard curve in serial dilutions, three sera were employed as reference sera. The following serial dilutions were made: 1:200, 1:400, 1:800, 1:1600, 1:3200, 1:6400, 1:12800, 1:25600, 1:51200,1:102400, 1:409600, 1:819200, 1:1638400 and 1: 3276800. Using an IDEXX commercial ELISA kit (IDEXX, Australia), the serum ODs of the three reference sera were determined to be 0.75, 0.812, and 0.852, respectively. With washing buffer, the reference sera were diluted. SPF chicken negative sera that had been diluted 1:500 times used as the negative controls. As a positive control, the positive sera from the SPF hens with OD (measured by IDEXX) were diluted at 1:500. Positive and negative controls were each given two wells on a plate. The absorbance values for the individually serially diluted reference serums were measured during the test tests and converted to sample-to-positive (S/P) ratio values, where:
SIP=Mean absorbance (samples-negative control)/Mean absorbance (positive control-negative control)
It was possible to obtain the standard curve relating optical density (OD650) to S/P. The regression equation line was created using the curve estimate regression function in the statistical program for social science (SPSS, 1999, version 10.0).
Indirect ELISA procedure for antibody detection: Each well was coated with diluted VP1 protein (1:100) then covered with parafilm paper before being incubated at 4°C overnight. The plate was rinsed three times with washing buffer. The plate was then dried by tapping. The plate was then blocked for two hours at 37°C using 100 μl of 2% BSA (prepared in washing buffer). The plate was then washed three times with washing buffer. The diluted serum samples of 1:100 were added into each well and incubated at 37°C for 90 min. The plate was then washed with washing buffer three times. Goat anti-chicken IgG-HRP conjugate (100 μl) diluted at 1:8000 was then added into each well. The plate was then incubated at 37°C for 1 hour. The plate was then washed with washing buffer three times.
The substrate Tetramethylbenzidine (TMB) was used for enzyme reaction. Just before use, the substrate and peroxidase solution B (KPL, USA) were combined in an equal volume. Each well received a total of 100 μl of the substrate, which was then incubated at room temperature for 10 minutes. After that, the reaction was read using an ELISA reader (Dynatech, MR7000, USA) at 650 nm of absorbance.
Newcastle disease virus (NDV) and Infected Bursal Disease Virus (IBDV) serum samples were used as a control to evaluate the specificity of the indirect ELISA. The sensitivity and specificity were calculated using the formulas given by Anon (1998) Table 1:
| Screening test | Positive for CAV | Negative for CAV | |
|---|---|---|---|
| Positive for CAV | a | b | Sensitivity a/(a+c)*100 |
| Negative for CAV | c | d | Specificity d/(b+d)*100 |
| Total | (a+c) | (b+d) |
Table 1: Calculations fosr Sensitivity and Specificity.
Sensitivity=a/(a+c )× 100
(Or)
Number of ELISA test-positive serum/Number of reference- positive serum × 100
Specificity=d/(b+d) × 100
(Or)
Number of ELISA test-negative serum/Several reference negative serums × 100
Results and Discussion
Analysis of VP1 capsid gene of CAV cloning in Prset-B vector
The heat shock method transformed the recombinant plasmid DNA into E. coli TOP 10 as described in details [41]. The PCR product of the VP1 gene was inserted into the frame within the lacZ gene of the (pRSET-B) vector, resulting in the insertional inactivation of the gene, which produced white colonies. As a result, the transformant E. coli Top 10 colonies containing the putative VP1 fragment produced a white colony. Accordingly, the analysis of transformers using the primer set in the PCR screening test is shown in Figure 2 and was used to detect positive cloning. The VP1 insert was cloned into the (pRSET-B) vector and confirmed to be positive when 11 out of 15 white colonies had a correct size band of 1.4 kDa in the PCR test.

Figure 2: The PCR screening of transformation products. M is a 1kb marker. 1.4kb of purified VP1 insert products were extracted from eleven colonies that confirmed positive. The rest of the colonies were considered negative.
Effect of time on Dry Cell Weight (DCW) and Optical Density (OD)
High cell density growth in batch fermentation was evaluated by measuring the optical density (OD600) and Dry Cell Weight (DCW), as shown in Figure 3. Time course data obtained during 24 h of batch fermentation show a maximum optical density OD600 of 2.154, a maximum specific growth rate of 0.2250 per hour, a maximum dry cell weight of 247.0 g/L, and a maximum specific growth rate of 0.103 per hour. It is also observed that the percentage of pure oxygen decreased from 100% to zero between 19 and 22 h. This drop in pure oxygen percentage is attributed to the increase in the bacterial growth rate. Finally, reducing the VP1 protein induction rate allows the percentage of pure oxygen to gradually increase to 7%. The production phase started after 5 h of induction.

Figure 3: Dry Cell Weight (DWC) and optical density OD compared to the time of batch fermentation of recombinant E. coli. Note: Samples were taken at 0 hour (i.e. before initiation) 2, 4, 6, 8, 10, 12, 14, 16, 20, 22 and 24 hours. The maximum optical density OD600 was 2.154; the maximum specific growth rate of optical density was 0.2250 OD600 per hour. The maximum dry cell weight was 2.470 g, and the maximum specific growth rate of dry cell weight was 0.103 g per hour. Recombinant protein-induced at OD600 was 2.154 during the growth phase.
Effect of time on protein induction
The difference in specific VP1 protein post-time induction amounts is shown in Figure 4. VP1 protein was successfully induced from E. coli Top 10 cells to the media using IPTG and expressed as soluble protein after achieving the maximum bacterial growth rate. However, the induction of VP1 protein from E. coli cells using 1.0 mM IPTG reduced cell growth. In the second phase, the specific VP1 protein yield was 17.5 μg/ml when the dry cell weight was 112 mg/l.

Figure 4: In each head of the hours. After three hours of bacterial cultivation during batch fermentation, the bacterial growth reaches its maximum rate, and then the VP1 protein induction starts in three induction stages as fellow: I-Early induction stage; II-The middle induction stage; III-The late induction stage.
Cell growth was reduced during IPTG induction at the middle induction stage. After 2 h of IPTG induction, cell growth was almost stopped when the dry cell weight was 247.0 g/L. In the case of induction at the induction stage, the specific yield of VP1 protein was observed to be low (32 μg/ml) despite high cell concentrations. The maximum increase in the specific cellular yield of VP1 protein was achieved during the 1-3 h postinduction period, where the yield increased from 17.5 to 64 μg/ml. The VP1 protein yield was recorded as 64 μg/ml at the late induction stage. The highest protein concentration value was later used in developing an indirect ELISA to detect CAV antibodies.
Characterization of recombinant VP1 protein
Analysis of recombinant VP1 protein using Coomassie-stained SDS-PAGE was performed for culture samples taken at different times during the fermentation process. The obtained results are shown in Figure 5. In lane 1, a significant amount of recombinant VP1 protein was already expressed at low cell density, while the recombinant VP1 protein in lane 2 was expressed after 3 h of induction culture. In addition, a 70 kDa recombinant VP1 protein (50 kDa) plus fusion protein (20 kDa) was observed in lanes 2 and 3.

Figure 5: a) Detection of protein expressed during batch fermentation of recombinant E. coli. SDS-PAGE stained with Coomassie blue. (b) Detection of purified VP1 protein. The purification and dialysis were done using a TFF machine, SDS-PAGE stained with Coomassie blue. Note: a) Lane 1: Sample taken in low cell density; Lane 2: Sample was taken after 5 hours of IPTG induction; Lane M: Protein ladder marker (15, 20, 25, 30, 40, 50, 60, 70, 85, 100, 120,150 and 200). b) Lane M is a protein ladder marker. Lane 1: whole-cell extract of an induced VP1 protein, lanes 2-4: samples taken after dialysis for purified VP1 protein. Note that the arrows indicate the VP1 band.
Purification of recombinant VP1 protein using TFF dialysis
A single-step dialysis process successfully purified the recombinant VP1 protein. First, E. coli Top10 protein extract containing the recombinant VP1 protein was dialyzed against high salt concentrations using a TFF membrane. The purification allowed almost all bacterial proteins to precipitate, as shown in Figure 5a. It is also evident that the recombinant VP1 protein remained in the solution after clearing by centrifugation. As analyzed by SDS-PAGE, the protein purity was also 95% (Figure 5b). It was also found that for 1000 ml of bacterial culture, the yield of the purified VP1 protein was 64 μg/ml. The samples taken after dialysis for purified VP1 protein were detected at 50 kDa, where the VP1 protein size before dialysis was 70 kDa and after dialysis reached 50 kDa after the purification removed the 20 kDa fusion protein.
Western blot detection of expressed VP1 protein
As shown in Figure 6, the Western blot test further confirmed the expression of VP1 protein in the Top 10 E. coli host in batch fermentation. In Western blot anti-VP1, a monoclonal antibody was used to detect VP1 protein in the whole cell extract in lane 1 and the purified form in lane 2 with a molecular weight of 50 kDa. After the fermentation product was purified, the 50 kDa band was the final product, and 20 kDa of the fusion protein was removed.

Figure 6: The soluble protein produced by E. coli Top10 in batch fermentation was found using the anti-VP1 monoclonal antibody. M: protein markers. Plasmid control is on lane 1. VP1 soluble protein fraction is in lanes 2 and 3. The anti-VP1 monoclonal antibody was used in high concentrations (1:50), and the conjugate was used in low concentrations (1:1000), to assess the solubility of the purified protein. As a substrate, DAB was utilized. After each process, the membrane was continuously rinsed to remove the image's background.
The indirect ELISA optimization and statistical analysis
Antigen optimization: Antigen optimization is determined, where Rows A-B show CAV-positive serum against VP1 antigen and Rows E-F show SPF CAV Negative Serum against VP1 Antigen. The optical density at 650 nm absorbance is directed against the antigen dilution in Figure 7a-7d. The coated plate's optimum antigen concentration was 1:100. Additionally, it was noted that, when compared to concentrations of 1:10 and 1:50, the antigen-coated well had the lowest absorbance value of the negative control samples at a concentration of 1:100. Conjugate optimization: Conjugate optimization is displayed. CAV-positive serum against the VP1 antigen is in Rows A through B, while SPF CAV-negative serum is in Rows E through F. The relationship between optical density and conjugate dilution is depicted in Figure 7(b). In this indirect ELISA. It should be noted that the ideal conjugate concentration was 1:8000. The conjugate produced the same resolution at dilutions of 1:8000 and 1:16000. On the other hand, employing the conjugate at dilutions of 1:1000 and 1:2000 led to an absorbance value resolution that was too high.

Figure 7: (a) As well as negative sera, serum of antibodies reacted against the VP1 antigen was plotted at various dilutions (1:10, 1:50, and 1:100); (b) As well as positive (1:100) and negative (1:100) sera, the VP1 antigen coated 20 g/ml was coated against various dilutions (1:1000, 1:2000, 1:4000, 1:8000, and 1:16000) of the conjugate, the conjugate serial dilutions were reacted at an absorbance of 650 nm, the findings were plotted against optical density; (c) Standard curve for indirect ELISA with resulted in R2 of 0.9332; (d) Comparison between indirect ELISA and IDEXX commercial ELISA using 6 samples of given sera for each mean, in which the mean optical density at the absorbance of 650nm of Serum plotted against S/P. Note: (a) Plots of the ensuing reactions verse optical density were made at 650 nm absorbance and the ratio indicated applies to antigen dilution; (b): The ratio given pertains to the dilution of conjugates; (d): The y-error bars stand for the standard error (Mean OD SD) to the indirect ELISA.
Determination of cut off-OD level: The ELISA result was classified as positive or negative using a cutoff OD value of 0.1375. This was accomplished using background levels measured against the serum of laboratory chickens. With a Standard Deviation (SD) value of 0.0381, the estimated mean OD value was 0.1375. The cutoff OD (mean OD plus three times SD) was 0.2520.
Standard curve of indirect ELISA: Regression curves are essential for describing the relationship between a dependent variable and one or more independent variables. Using the Equation derived from the regression curve, one can predict the dependent variables' future behavior at the independent variables' potential values.
The relationship between the optical density and S/P ratio of the new indirect ELISA was developed using the SPSS© software. Table 2 shows the settings of the regression procedures.
| Regression parameter | Symbol | Description |
|---|---|---|
| Procedure | Log-regression | Logistic regression |
| Independent variable (y) | y | Optical density |
| Dependent variable (x) | x | S/P ratio |
| Statistical tool | SPSS© | SPSS software |
Table 2: Logistic regression settings.
Figure 7c shows the standard curve of the new indirect ELISA using the inverse model in the regression curve. The curve formula is found to be below equation:
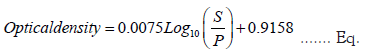
The accuracy of the regression is often measured using the coefficient of determination R2. This metric provides information about the goodness of fit of the regression model. Specifically, it measures the correlation between the regression line and the actual dataset. The R2 measure ranges between 0 and 1, with the highest value indicating the strongest correlation and the lowest value indicating the weakest. This study's results revealed a high R2 value of 0.9332, indicating that the curve model in Equation accurately describes the relationship between the optical capacity and the S/P ratio.
Independent two samples-based t-tests
The independent two-sample t-test is a statistical test widely used in literature for comparing the means of two independent samples to determine whether they have a significant difference. The word "independent" means that the two samples were drawn from two experiments or groups. However, this test is used in this study to the significance of the difference between the CAV positive serum and CAV negative serum results from the two methods, indirect and commercial ELISA. Table 3 shows the design settings of the two samples-t-tests.
| Design element | Indirect ELISA-Test 1 | Commercial ELISA-test2 |
|---|---|---|
| Test | Two samples T-test | Two samples T-test |
| Factor 1 | CAV-positive serum,  |
CAV-positive serum,  |
| Factor 2 | CAV-negative serum,  |
CAV-negative serum,  |
| H0 |  |
|
| H1 |  |
 |
| Level of Significance, α | 0.05 | 0.05 |
| Rejection criterion | P-value ≤ α | P-value ≤ α |
| Statistical tool | SPSS© | SPSS© |
Table 3: The design settings of the two samples-t-tests.
The two tests in Table 3 were conducted using the SPSS SPSS©
software. The results of the first test have revealed a p-value=0.001
(˂ 0.05), meaning that there is a significant difference between the In other words, the indirect ELISA can
differentiate between the two types of serum. The results of
the second test have also resulted in a relatively small p-value value=0.015 (˂ 0.05), meaning that the difference between is significant. Generally speaking, the intervention
produces a statistically significant difference between the means
of the CAV positive and negative serum in both tests when
α=0.05. As the t-test conclusion depends on the value of α, it is
always recommended to conduct the test at multiple values of
α before generating the conclusion; otherwise, the conclusion
should be limited to the value of α used in the test. For instance,
if α is set to 0.01, the results of the second test will be altered so
that the H0 is accepted, indicating the difference between is not significant, or
In other words, the indirect ELISA can
differentiate between the two types of serum. The results of
the second test have also resulted in a relatively small p-value value=0.015 (˂ 0.05), meaning that the difference between is significant. Generally speaking, the intervention
produces a statistically significant difference between the means
of the CAV positive and negative serum in both tests when
α=0.05. As the t-test conclusion depends on the value of α, it is
always recommended to conduct the test at multiple values of
α before generating the conclusion; otherwise, the conclusion
should be limited to the value of α used in the test. For instance,
if α is set to 0.01, the results of the second test will be altered so
that the H0 is accepted, indicating the difference between is not significant, or
Figure 7d shows that the indirect ELISA test optical density keeps increasing and displays high optical density values over the commercial ELISA kit. It is seen that the mean optical density for the serum samples of chickens at S/P of 0.3, 0.5, 0.8, and 1.0 are more significant than 1.5 and 2.8.
Sensitivity and specificity
As stated earlier, 100 sera samples were tested to determine the sensitivity and specificity of CAV using commercial ELISA and the new indirect ELISA, as listed in Tables 4 and 5.
| Screening test | Positive for CAV | Negative for CAV | |
|---|---|---|---|
| Positive for CAV | 53 | 0 | Sensitivity 93.3% |
| Negative for CAV | 7 | 40 | Specificity 100% |
| Total | 60 | 40 | 100 |
Table 4: Sensitivity and specificity of the indirect ELISA employing the recombinant VP1 protein as an antigen.
| Screening test | Positive for CAV | Negative for CAV | |
|---|---|---|---|
| Positive for CAV | 60 | 2 | Sensitivity 100% |
| Negative for CAV | 0 | 38 | Specificity 92% |
| Total | 60 | 40 | 100 |
Table 5: Sensitivity and Specificity of the commercial ELISA Kit I-DEXX, Australia.
Moreover, NDV and IBDV sera samples showed a negative reaction when they reacted against VP1 protein. These results indicated no cross-reactivity with common chicken viruses, especially the IBDV and NDV.
Since the main aim of this paper is to obtain a high protein concentration, the expression of recombinant VP1 protein was initiated with 1.0 mM IPTG at an optical density of 1.938 at the end of the log phase, as shown in Figure 4. As a result, the specific cellular yield of recombinant VP1 protein was increased during 1-3 h of induction, where the yield increased from 17.5 to 64.0 μg/ml (from the Figure 4). This result is considered high when compared and obtained a final concentration of 25 mg/l per hour [39]. Moreover, the media yielded a higher biomass concentration of 60.9 mg/L with 30% expression of recombinant cellulase protein in a similar fermentation system carried out by Shahzadi, et al. [27]. Furthermore, as Koch, et al. described, recombinant protein expression using E. coli as a host is frequently associated with forming intracellular aggregates as inclusion bodies [13]. Thus, the volumetric yield of a recombinant protein depends on the final cell concentration and the specific cellular protein yield, as described by Schwaighofer, et al. [42]. Therefore, high cell density has been used to maximize cell concentrations in addition to producing high cell density fermentation and cell concentrations. However, the expected increases in soluble protein production volumetric yield usually damage the bacterial cell. Therefore, the increase in the specific cellular yield of recombinant VP1 protein was associated with the reduction in the specific growth rate of the culture, which also indicates that the decrease in metabolic growth of bacterial cells is due to host cell ribosome damage, which accordingly decreases VP1 protein expression [43,44]. This finding is confirmed in Figure 5a when the curve of bacterial culture growth goes to a horizontal line when the protein expression reaches the maximum point.
Furthermore, the protein yield was recorded to be high in the case of induction at the mid-induction stage, even though the early induction stage-specific VP1 protein yield was 32.0 μg/ ml when the dry cell weight was 112 g/L. The elevated cell concentrations were sufficient within the center of the actuating arrangement, showing the significance of specific cellular protein abdication and elevated cell concentrations for maximizing the volumetric efficiency of the protein [41,42]. Within the case of acceptance at the early actuating arrangement, the particular decrease in recombinant VP1 protein was observed to be 17.5 (μg/ml) despite elevated cell concentrations. The induced recombinant VP1 protein concentration acceptance at the early actuating arrangement is explained by moderate cell development due to byproduct build-up, which was insufficient to specify the recombinant protein [40,43]. The low cell growth observed during the early induction stage was also credited to the lower biosynthetic capacity of the growing cells, as shown in Figure 3. Therefore, cell growth was suppressed during IPTG induction at the early induction stage [44,45]. The reduction in cell growth was more intense during IPTG induction at the early induction stage of the cultures. The final cell concentrations were nearly half of the uninduced bacterial cultures [46]. In the event of induction at the middle-inducing stage, the reduction in cell growth slowed, and the final biomass was found to be equal to that achieved for uninduced bacterial culture. In both cases, 4 h after IPTG induction, cell growth practically stopped when the dry cell weight was 247.0 g/L.
A primary concern during batch fermentation was minimizing acetate metabolism by adding 20 g/L glucose. As a result, pure oxygen decreased from 100% to zero between 19 and 22 h (Figures 2 and 3), indicating that carbon source limitation occurred. This finding is based on the fact that acetic acid is an inhibitor of growth for recombinant protein expression in E. coli [47-49]. Moreover, Wiebusch, et al. reported that acetate production was an indicator of catabolic inefficiency, resulting in low recombinant protein expression [50]. The decrease can be explained by the observance that the metabolic load imposed by recombinant protein expression reduces the specific growth rate by utilizing resources usually allocated for cell growth to produce foreign products [51]. However, as Wiebusch, et al. stated, the main problems arising from high cell densities are high oxygen and substrate uptake rates and accumulation of low molecular, growth-inhibiting metabolites in the cell suspension during 21 days of cultivation [50,52]. The same study also suggested that providing optimal growth conditions is essential to minimize the formation of inhibitors.
Different studies show that expression optimization was initially thought unnecessary in several described parameters, such as temperature, postinduction, induction time, and IPTG concentration [45]. The host cell temperature was considered the most critical parameter. The E. coli was incubated at 37°C in 25 ml of LB. Hence, it is worth indicating the effect of temperature range on protein concentration. It is evident that the temperature range significantly dominated the protein concentrations [29,53,54]. Furthermore, the obtained results showed higher fusion protein concentrations per optical density unit produced at lower temperatures (30°C in 2000 ml of LB). This result is attributed to the fact that inclusion body formation is avoided by employing low temperatures [39,45,55].
Furthermore, the resulting product was precipitated with ammonium persulfate and dialyzed to reach a sufficient concentration for the protein [39,56,57]. A single-step dialysis protocol purified the induced protein to near homogeneity in large amounts. The use of TFF dialysis membranes has been described as a suitable option for protein purification [50,58]. The dialysis process allowed the immediate removal of any other bacterial proteins (from Figure 5b). Additionally, the dialysis solution introduced the cations Ca2 and Mn2 into the sample, which were removed during washing with 500 ml of distilled water [39,58-61].
Statistically, the SPSS SPSS© software was used to conduct Indirect ELISA (Test 1), and Commercial ELISA (Test 2), as presented in Table 3. The first test's results showed a p-value of 0.001 (0.05), indicating a significant difference between the "CAV_IE+" and "CAV_IE-." In different wards, indirect ELISA is able to distinguish between the two kinds of serum [62,63]. The second test's results also produced a significantly low p-value of 0.015 (0.05), indicating that the difference between "CAV_IE+" and "CAV_IE-" is a significant difference. In both tests, the intervention typically results in a statistically significant difference between the means of CAV positive and negative serum when=0.05. Before generating the results, many studies suggested that to run the test at several values because the t-test conclusion depends on that value, as agreed with Lv, et al. [64]. Those calculations based on the antigen optimizations (Figure 7a-7b).
Furthermore, since this study clearly shows that the VP1 protein carried immunoreactive epitopes, the work was extended toward ELISA development [55,65]. Therefore, purified recombinant VP1-CAV protein from high cell density fermentation was successfully used in ELISA [66]. Furthermore, optimizations (such as the high dilution of serum samples for indirect ELISA) reduce the background between antigen and antibody reactions. Finally, the developed indirect ELISA had 93.3% greater sensitivity than the commercial CAV ELISA as shown in Tables 4 and 5. Therefore, it can be used for usual serological tests for a large-scale investigation in epidemiology studies.
Conclusion
In conclusion, this study successfully expressed the recombinant VP1 protein during high cell density in E. coli Top10 by continuing the protein induction during bacterial cultivation, which was valuable, in which the purified VP1 protein yield produced, was 64 μg/ml. Furthermore, a TFF filtration step and ammonium persulfate precipitation was necessary, increasing the specific activity and the final yield of the purified fraction. The indirect ELISA system developed from the purified VP1 protein is rapid, sensitive, and specific. Therefore, the ELISA developed in this study performs better than the commercial ELISA and is suitable for serological diagnosis of CAV in SPF and commercial chicken flocks.
References
- Yuasa N, Taniguchi T, Imada T, Hihara H. Distribution of Chicken Anemia Agent (CAA) and detection of neutralizing antibody in chicks experimentally inoculated with CAA. Natl Inst Anim Health Q. 1983;23(3):78-81.
[Google Scholar] [PubMed]
- Kaffashi A, Shrestha 1 S, Browning GF. Evaluation of chicken anaemia virus mutants as potential vaccine strains in 1-day-old chickens. Avian Pathol. 2008;37(1):109-114.
- Engström BE. Blue wing disease of chickens: Isolation of avian reovirus and chicken anaemia agent. Avian Pathol. 1988;17(1):23-32.
[Crossref] [Google Scholar] [PubMed]
- Zepeda-Cervantes J, Ramírez-Jarquín JO, Vaca L. Interaction between Virus-Like Particles (VLPs) and Pattern Recognition Receptors (PRRs) from Dendritic Cells (DCs): toward better engineering of VLPs. Front Immunol. 2020;11:1100.
- Murphy FA. Virus taxonomy; classification and nomenclature of viruses; 6th report of the international committee on taxonomy of viruses. Arch. Virol. Suppl. 1995;10:415-433.
- Mahgoub EO. The Development and application of an indirect elisa test for the detection of chicken anaemia virus (cav) by vp1 in chicken flock serum. OJGen. 2014.
- Todd D, Mawhinney KA, McNulty MS. Detection and differentiation of chicken anemia virus isolates by using the polymerase chain reaction. J Clin Microbiol. 1992 Jul;30(7):1661-1666.
- Noteborn MH, De Boer GF, van Roozelaar DJ, Karreman C, Kranenburg O, Vos JG, et al. Characterization of cloned chicken anemia virus DNA that contains all elements for the infectious replication cycle. J Virol. 1991;65(6):3131-3139.
- Kim HR, Kwon YK, Bae YC, Oem JK, Lee OS. Molecular characterization of chicken infectious anemia viruses detected from breeder and broiler chickens in South Korea. Poult Sci.;89(11):2426-2431.
- Trinh DQ, Ogawa H, Bui VN, Baatartsogt T, Kizito MK, Yamaguchi S, et al. Characterization of mAbs to chicken anemia virus and epitope mapping on its viral protein, VP1. J Gen Virol. 2015;96(5):1086-1097.
- Cardona C, Lucio B, O'Connell P, Jagne J, Schat KA. Humoral immune responses to chicken infectious anemia virus in three strains of chickens in a closed flock. Avian Dis. 2000:661-667.
- Feng C, Liang Y, Teodoro JG. The role of apoptin in chicken anemia virus replication. Pathogens. 2020;9(4):294.
- Koch G, van Roozelaar DJ, Verschueren CA, van der Eb AJ, Noteborn MH. Immunogenic and protective properties of chicken anaemia virus proteins expressed by baculovirus. Vaccine. 1995;13(8):763-770.
- Malla WA, Arora R, Khan RI, Mahajan S, Tiwari AK. Apoptin as a tumor-specific therapeutic agent: Current perspective on mechanism of action and delivery systems. Front Cell Dev Biol. 2020;8:524.
- Novak R, Ragland WL. Competitive DNA hybridization in microtitre plates for chicken anaemia virus. Mol Cell Probes. 2001;15(1):1-1.
- Schat KA, van Santen VL. Chicken infectious anemia and circovirus infections in commercial flocks. Diseases of poultry. 2020:284-320.
- Lange S, Schmitt J, Schmid RD. High-yield expression of the recombinant, atrazine-specific Fab fragment K411B by the methylotrophic yeast Pichia pastoris. J Immunol Methods. 2001;255(1-2):103-114.
- Hellebust H. Production of antibody fragments in a bioreactor. Methods Mol Biol. 2003:437-441.
- Cui S, Zhu D, Mao B, Ma F, Zhao J, Zhang H, et al. Rapid evaluation of optimal growth substrates and improvement of industrial production of Bifidobacterium adolescentis based on the automatic feedback feeding method. LWT. 2021;143:110960.
- Vieira Gomes AM, Souza Carmo T, Silva Carvalho L, Mendonça Bahia F, Parachin NS. Comparison of yeasts as hosts for recombinant protein production. Microorganisms. 2018;6(2):38.
- Bettin F, Rosa LO, Montanari Q, Zaccaria S, Dillon AJ, Silveira MM. Influence of oxygen supply on growth and laccases production by Pleurotus sajor-caju PS-2001 in submerged process. Braz Arch Biol Technol. 2020;63.
- Arndt MA, Krauss J, Kipriyanov SM, Pfreundschuh M, Little M. A bispecific diabody that mediates natural killer cell cytotoxicity against xenotransplantated human Hodgkin’s tumors. Am J Hematol. 1999;94(8):2562-2568.
- Kipriyanov SM. Generation of bispecific and tandem diabodies. Methods Mol Biol. 2009:177-193.
- Bonet Ragel K. Enzymatic synthesis of biodiesel from high free fatty acid feedstock using a recombinant Rhizopus oryzae lipase. 2018.
- Panda AK, Khan RH, Rao KA, Totey SM. Kinetics of inclusion body production in batch and high cell density fed-batch culture of Escherichia coli expressing ovine growth hormone. J Biotechnol. 1999;75(2-3):161-172.
- Vandermies M, Fickers P. Bioreactor-scale strategies for the production of recombinant protein in the yeast Yarrowia lipolytica. Microorganisms. 2019;7(2):40.
- Shahzadi I, Al-Ghamdi MA, Nadeem MS, Sajjad M, Ali A, Khan JA, et al. Scale-up fermentation of Escherichia coli for the production of recombinant endoglucanase from Clostridium thermocellum. Sci Rep. 2021;11(1):7145.
- Zhao C, Wang L, Li D, Li J, Ge Y, Liang T, et al. High-cell-density fermentation of Escherichia coli for expression of a recombinant phenylalanine dehydrogenase mutant and its purification. J Chem Technol Biotechnol. 2021;96(1):199-206.
- Seeger A, Schneppe B, McCarthy JE, Deckwer WD, Rinas U. Comparison of temperature-and isopropyl-β-D-thiogalacto-pyranoside-induced synthesis of basic fibroblast growth factor in high-cell-density cultures of recombinant Escherichia coli. Enzyme Microb Technol. 1995;17(10):947-953.
- Hellmuth K, Korz DJ, Sanders EA, Deckwer WD. Effect of growth rate on stability and gene expression of recombinant plasmids during continuous and high cell density cultivation of Escherichia coli TG1. J Biotechnol. 1994;32(3):289-298.
- Horn U, Strittmatter W, Krebber A, Knüpfer U, Kujau M, Wenderoth R, et al. High volumetric yields of functional dimeric miniantibodies in Escherichia coli, using an optimized expression vector and high-cell-density fermentation under non-limited growth conditions. Appl Microbiol Biotechnol. 1996;46:524-532.
- Shin CS, Hong MS, Bae CS, Lee J. Enhanced production of human mini-proinsulin in fed-batch cultures at high cell density of Escherichia coli BL21 (DE3)[pET-3aT2M2]. Biotechnol Prog. 1997;13(3):249-257.
- Turner C, Gregory ME, Thornhill NF. Closed-loop control of fed‐batch cultures of recombinant Escherichia coli using on-line HPLC. Biotechnol Bioeng. 1994;44(7):819-829.
- Shimizu N, Fukuzono SI, Nishimura N, Odawara Y, Fujiwara K. Cultivation of Escherichia coliharbouring hybrid plasmids. J Ferment Technol. 1987;65(1):7-10.
- Mahgoub IO, Ali AM, Hamid M, Alitheen NM. Single Chain Fragment Variable (scFv) Secondary Structure Prediction and Evaluation. 2011.
- Konstantinov K, Kishimoto M, Seki T, Yoshida T. A balanced DO-stat and its application to the control of acetic acid excretion by recombinant Escherichia coli. Biotechnol Bioeng. 1990;36(7):750-758.
- Mahgoub EO, Abdella GM. Improved exosome isolation methods from non-small lung cancer cells (NC1975) and their characterization using morphological and surface protein biomarker methods. J Cancer Res Clin Oncol. 2023:1-0.
- Mahgoub IO. Design, Expression and characterization of a single chain fragment variable anti-mcf-7 antibody; a humanized antibody derived from monoclonal antibody. Qatar Found Ann Res Conf Proc. 2014;2014(1):HBPP0705.
- Mahgoub IO. Expression and characterization of a functional single-chain variable fragment (scFv) protein recognizing MCF7 breast cancer cells in E. coli cytoplasm. Biochem Genet. 2012;50:625-641.
- Nair AJ. Principles of biochemistry and genetic engineering. 2010.
- Kovaøèík k. The development and application of an indirect ELISA test for the detection of antibodies to bovine respiratory syncytial virus in blood serum. Vet Med-Czech. 2001;46:29-34.
- Schwaighofer A, Ablasser S, Lux L, Kopp J, Herwig C, Spadiut O, et al. Production of active recombinant hyaluronidase inclusion bodies from apis mellifera in E. coli bl21 (de3) and characterization by ft-ir spectroscopy. Int J Mol Sci. 2020;21(11):3881.
- Dong H, Nilsson L, Kurland CG. Gratuitous overexpression of genes in Escherichia coli leads to growth inhibition and ribosome destruction. J Bacteriol. 1995;177(6):1497-1504.
- Lim HK, Jung KH. Improvement of heterologous protein productivity by controlling postinduction specific growth rate in recombinant Escherichia coli under control of the PL promoter. Biotechnol Prog. 1998;14(4):548-553.
- Gutiérrez-González M, Farías C, Tello S, Pérez-Etcheverry D, Romero A, Zúñiga R, et al. Optimization of culture conditions for the expression of three different insoluble proteins in Escherichia coli. Sci Rep. 2019;9(1):16850.
- Larentis AL, Nicolau JF, Esteves GD, Vareschini DT, de Almeida FV, dos Reis MG, et al. Evaluation of pre-induction temperature, cell growth at induction and IPTG concentration on the expression of a leptospiral protein in E. coli using shaking flasks and microbioreactor. BMC research notes. 2014;7(1):1-3.
- Salehmin MN, Annuar MS, Chisti Y. High cell density fed-batch fermentations for lipase production: feeding strategies and oxygen transfer. Bioprocess Biosyst Eng. 2013;36:1527-1543.
- Märkl H, Zenneck C, Dubach AC, Ogbonna JC. Cultivation of Escherichia coli to high cell densities in a dialysis reactor. Appl Microbiol Biotechnol. 1993;39:48-52.
- Wang H, Wang F, Wang W, Yao X, Wei D, Cheng H, et al. Improving the expression of recombinant proteins in E. coli BL21 (DE3) under acetate stress: An alkaline pH shift approach. PLoS One. 2014;9(11):e112777.
- Fuchs C, Köster D, Wiebusch S, Mahr K, Eisbrenner G, Märkl H. Scale-up of dialysis fermentation for high cell density cultivation of Escherichia coli. J Biotechnol. 2002;93(3):243-251.
- Glick BR. Metabolic load and heterologous gene expression. Biotechnol Adv. 1995;13(2):247-261.
- Voss I, Steinbüchel A. High cell density cultivation of Rhodococcus opacus for lipid production at a pilot-plant scale. Appl Microbiol Biotechnol. 2001;55:547-555.
- Allen SP, Polazzi JO, Gierse JK, Easton AM. Two novel heat shock genes encoding proteins produced in response to heterologous protein expression in Escherichia coli. J Bacteriol. 1992;174(21):6938-6947.
- Mahgoub EO. Single chain fragment variables antibody binding to EGF receptor in the surface of MCF7 breast cancer cell line: application and production review. Open J Genet. 2017;7(2):84-103.
- Mahgoub EO, Bolad A. Correctness and accuracy of template-based modeled single chain fragment variable (scFv) protein anti-breast cancer cell line (MCF-7). Open J Genet. 2013;3(03):183.
- Martins M, Soares BP, Santos JH, Bharmoria P, Torres Acosta MA, Dias AC, et al. Sustainable strategy based on induced precipitation for the purification of phycobiliproteins. ACS Sustain Chem Eng. 2021;9(10):3942-3954.
- Mahgoub E, Hussain A, Sharifi M, Falahati M, Marei HE, Hasan A. The therapeutic effects of tumor treating fields on cancer and noncancerous cells. Arab J Chem. 2021;14(10):103386.
- Saraswat M, Musante L, Ravidá A, Shortt B, Byrne B, Holthofer H. Preparative purification of recombinant proteins: current status and future trends. Biomed Res Int. 2013.
- Pörtner R, Märkl H. Dialysis cultures. Appl Microbiol Biotechnol. 1998;50:403-414.
- Mahgoub EO, Haik Y, Qadri S. Comparison study of exosomes molecules driven from (NCI1975) NSCLC cell culture supernatant isolation and characterization techniques. FASEB J. 2019;33(S1):647-622.
- Mahgoub I, Bolad AK, Mergani M. Generation and immune-characterization of single chain fragment variable (scFv) antibody recognize breast cancer cells line (MCF-7). J Immunother Cancer. 2014;2(1):1.
- Barzegar-Amini M, Mahmoudi M, Dadgarmoghaddam M, Farzad F, Najafabadi AQ, Jabbari-Azad F. Comparison of serum total IgA levels in severe and mild COVID-19 patients and control group. J Clin Immunol. 2022:1-9.
- Mahgoub EO, Razmara E, Bitaraf A, Norouzi FS, Montazeri M, Behzadi-Andouhjerdi R, et al. Advances of exosome isolation techniques in lung cancer. Mol Biol Rep. 2020;47:7229-7251.
- Lv MN, Zhu JB, Liao SQ, Yang ZX, Lin XH, Qi NS, Chen QL, et al. Seroprevalence of epizootic hemorrhagic disease virus in guangdong cattle farms during 2013-2017, china. Viruses. 2023;15(6):1263.
- Liu M, Zhang T, Zhang Y, Meng F, Li X, Hou Z, et al. Development and evaluation of a VP1-ELISA for detection of antibodies to duck hepatitis type 1 virus. J Virol Methods. 2010;169(1):66-69.
- Lee MS, Hseu YC, Lai GH, Chang WT, Chen HJ, Huang CH, et al. High yield expression in a recombinant E. coli of a codon optimized chicken anemia virus capsid protein VP1 useful for vaccine development. Microb Cell Fact. 2011;10(1):1-2.
Author Info
Elham Omer Mahgoub1* and Galal M. Abdella22Department of Mechanical and Industrial Engineering, College of Engineering, Qatar University, Doha, Qatar
Citation: Mahgoub EO (2025) Cloning and Expression of VP1 Protein for Large-Scale Production in E. coli TOP10. Appli Microbiol Open Access.11.358.
Received: 03-Aug-2023, Manuscript No. AMOA-23-25933; Editor assigned: 07-Aug-2023, Pre QC No. AMOA-23-25933(PQ); Reviewed: 23-Aug-2023, QC No. AMOA-23-25933; Revised: 31-Aug-2023, Manuscript No. AMOA-23-25933(R); Published: 08-Jan-2025 , DOI: 10.35284/2471-9315.25.11.358
Copyright: © 2025 Mahgoub EO. This is an open-access article distributed under the terms of the Creative Commons Attribution License, which permits unrestricted use, distribution, and reproduction in any medium, provided the original author and source are credited.