Journal of Thermodynamics & Catalysis
Open Access
ISSN: 2157-7544
+44 1300 500008
ISSN: 2157-7544
+44 1300 500008
Research Article - (2024)Volume 15, Issue 2
This work presents an integrated plant-wide process for co-gasification of waste biomass and plastics using steam and CO2 to produce an industrially important feed stock i.e., syngas with molar ratio of H2/CO2. The proposed plant wide process is designed with key feature of Carbon Capture and Utilization (CCU) and made self-sustainable by utilizing a fraction of syngas for meeting the heat, steam and CO2 demands with additional heat recovery and steam generation and power generation sections. Further, steady state plant wide models are developed using ASPEN Plus, and simulations are performed for the co-gasification of High-Density Polyethylene (HDPE) and Rice Husk (RH) at varying feed compositions (0%-100% HDPE). Further, rigorous sequential parametric sensitivity analysis is performed to determine the optimal process parameters and investigate the impact of feed composition on the product yield. Results revealed that Steam to Carbon ratio (S/C) should be maintained above 1.2 to attain complete carbon conversion within the gasifier which tends to enhance the overall performance of the integrated scheme. The comparative investigation on co-gasification of HDPE and RH revealed that an increase in weight percentage of HDPE in the feed mixture resulted in increased syngas production and plant efficiency due to the high carbon and low ash content of HDPE. Gasification of pure HDPE waste resulted in the maximum output of 2.2 kg of syngas/kg of feed with a net plant efficiency of 68%, while in the case of pure RH the syngas production and efficiency dropped to 0.60 kg/kg of feed and 35%, respectively.
Biofuel; Waste plastic; Rice husk; Co-gasification; Syngas
• Thermodynamic modelling for co-gasification of Rice Husk
(RH) and polyethylene.
•CO2 and steam used as gasifying agent fors yngas
production with H2/CO ratio of 2.
• Process steam and CO2 demand decreases with increase in
RH wt.% in feed mixture.
• Syngas production and efficiency decreases with increase in
RH wt.% in feed mixture.
Plastic waste is one of the major causes of environmental pollution, as it is not biodegradable and it can end up in landfills, oceans, and other natural environments, causing harm to wildlife and ecosystems. Moreover, plastic waste breaks down into micro plastics, it can enter the air, water and food chain leading to severe health hazards to humans and animals. Globally, more than 400 Million Tons per Annum (MTA) of plastic waste is generated and India ranks as the second-highest annual producer of plastic waste (27 MTA), behind the United States (34 MTA) [1]. Among the generated waste globally, only 9% is recycled, 12% is incinerated, and the remaining 79% ends up in landfills and dumps which becomes a major threat to the environment [2]. High Density Polyethylene (HDPE) accounts for most of the plastic waste generated globally, weighing in at ~40%, compared to India, where it makes up 35%-38%, as shown in Figure 1A. Another important class of waste generated in large quantities is agricultural waste such as rice husks, wheat straw, and corn stover which is estimated to be around 1400 MTA globally [3]. Among the various agricultural waste, rice husk is the most prevalent type as shown in Figure 1B. India and China together generates ~72 MTA i.e., almost 50% of the world’s rice husk [4]. According to statistics, ~0.30-0.70 kg of fuel (equivalent to petroleum) can be produced from 1 kg of biomass waste [5,6]. Since these abundant agricultural wastes are carbonaceous, they can be used as a replacement for fossil fuels and as a large-scale source of clean energy production, reducing the nation's reliance on imported gasoline and diesel (Figure 1).
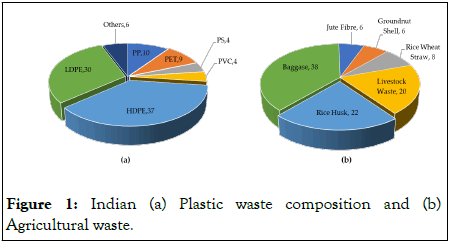
Figure 1: Indian (a) Plastic waste composition and (b) Agricultural waste.
However, most of these biomass/plastic wastes are either burned openly or disposed in landfills, resulting in release of greenhouse gases (CO2 and CH4) along with other hazardous gases (SOx and NOx) and particulate matters [7]. Utilization and conversion of waste to useful products are essential for addressing environmental, social, and economic challenges associated with plastic waste. As a result, over the past decade the attention has shifted to thermochemical conversion of plastic and biomass via pyrolysis, gasification, or combustion because of their potential to generate heat and power. Among those methods gasification has drawn the greatest interest because of its wide adaptability towards various feed and capability to produce different products depending upon the type and amount of the gasifying agents i.e., air, O2, steam or CO2 used. Lately, co-gasification of biomass and plastic waste has emerged as one of the most effective way to manage waste while also producing value added syngas [8]. It is also useful for waste reduction, makes energy recovery easier, helps to mitigate climate change, promotes resource conservation, and has several economic benefits by generating new jobs in waste management and energy production and lowering the cost of waste disposal and energy production. Through literature review on cogasification of biomass and plastic waste, through Web of Science with keywords “Co-gasification”, “plastic” and “biomass” in all fields yielded 133 results of which just 14 articles have performed thermodynamic modelling using ASPEN plus. Table 1 provides a detailed literature review on ASPEN plus modelling studies for co-gasification of different biomass and plastic waste. Various biomass such as Rice Husk (RH), sawdust, wood chips, wheat straw, olive pomace, hazelnut shells, Barley and vine pruning’s have been reported to be co-gasified with different waste plastics such as Polyethylene (PE), High Density Polyethylene (HDPE), Polypropylene (PP), Polyethylene Terephthalate (PET), Polystyrene (PS), Plastic Solid Waste (PSW), and Sachet Water Plastic Waste (SWPW). Except for one study that utilized CO2 and steam as gasifying agents, most of the reported thermodynamic studies have used air, O2 or steam both to produce syngas with varying H2/CO ratios. The major driving force of our study is to examine the thermodynamic viability and potential benefits of integrating “co-gasification of waste biomass and plastic” with “Carbon Capture and Utilization (CCU)” in terms of syngas generation, H2/CO ratio, CO2 utilization, and net plant efficiency. Co-gasification coupled with CCU process are still not developed sufficiently for commercialization, necessitating additional research to make ground-breaking discoveries. The current work is primarily focused on thermodynamic investigation of an integrated process for co-gasification of Rice Husk (RH) and High-Density Polyethylene (HDPE) for syngas production with CCU. Steady state plant wide models are developed using ASPEN Plus, for the co-gasification of RH and HDPE (at varying composition ranging from 0-100% RH) with CCU for syngas production with H2/CO of 2. The integrated scheme is made self-sustainable by burning a fraction of syngas produced to meet the process heat and steam demand along with the incorporation of Heat Recovery and Steam Generation (HRSG) and power generation sections. Further, sequential parametric sensitivity analysis is performed to determine the optimal process parameters and investigate the impact of feed composition (i.e., wt.% of plastic in total feed), steam to carbon ratio, and CO2 to carbon ratio on the overall performance of the integrated scheme (Table 1).
| Process type | Feed | T (°C) | Gasifying agents | Product | References | |
|---|---|---|---|---|---|---|
| Biomass | Plastic | |||||
| Co-gasification | Rice husk | PE | 850 | Air, steam | Syngas | Tian, et al. |
| Co-gasification | Sawdust | HDPE | 700 | Steam, CO2 | Syngas | Chai, et al. |
| Co-gasification | Sawdust | PE, PP | 750 | Steam | Syngas | Singh, et al. |
| Co-gasification | Algae | PE | 800 | O2 | H2 | Rosha, et al. |
| Co-Pyrolysis | Fiberglass, olive pomace | PP | 500 | - | Syngas | Ouazzani, et al. |
| Pyrolysis | Wood chips | PS | 500 | - | Power | Gunukula and Tran |
| Co-gasification | Barley and wheat straw | PE, PP | 850 | Air | Bio-jet fuel | López-Fernández, et al. |
| Co-gasification | Vine prunings | PET | 800 | Air, steam | Syngas | Tavares, et al. |
| Co-gasification | Vine prunings | PET | 600 | O2 | Syngas | Ramos, et al. |
| Co-gasification | Rice husk | SWPW | 850 | Steam | Power | Salisu, et al. |
| Co-gasification | Hazelnut shells | Sewage sludges | 850 | Air | Syngas | Barontini, et al. |
| Plasma gasification | MSW | PSW | 850 | O2, steam | Syngas, H2 | Mazzoni and Janajreh |
Table 1: Modelling studies on plastic waste and biomass conversion.
Process description
Figure 1 provides the plant-wide schematic for the conversion of waste plastic to syngas. In this work, a feed mixture consisting of RH and HDPE is investigated at mass ratios ranging from 0 to100% of RH in the feed mixture. The proximate and ultimate analysis of RH and HDPE is provided in Table 2. Initially, the waste plastics are cleansed to remove the dirt and sand with an equal mass ratio of water, then crushed to 1-3 mm particle size. Plastic waste is then completely dried to remove all the moisture content, at 140°C. Similarly, RH was crushed to 1-3 mm size without washing. The crushed waste materials were then co-fed to the gasifier, where they were initially paralyzed at 500°C into their volatile constituents and char. The char obtained is then completely gasified at 850°C using steam to produce syngas. The lower hydrocarbons/volatile matters obtained during gasification and pyrolysis are then reformed using CO2 and steam at 850°C to obtain syngas with H2/CO molar ratio of 2. The outlet gas (or reformer gas) from the gasifier is then cooled to 150°C in Heat Recovery and Steam Generation (HRSG) section to produce High Pressure (HP) steam at 80 atm, which is expanded in a Steam Turbine (ST) to generate power. The exhaust from ST at 1 atm is sent to the gasification and reforming sections to meet the process steam demand. The reformer gas at 150°C from the HRSG section is then used for drying/preheating the feed mixture to 140°C. The reformer gas then enters the gas cleanup section where it undergoes cleaning in three stages for the removal of moisture in condenser, sulfur impurities via Selexol process and finally CO2 capture. The energy required during the Selexol process and CO2 capture unit were reported to be 5000 kJ/kg of SOx and 3950 kJ/kg of CO2, respectively. A fraction of the CO2 captured was utilized during the gasification/reforming. The clean syngas obtained with H2/CO of 2 was then compressed to 5 atm and stored. A fraction of the compressed syngas was burnt in the combustor using compressed air at 5 atm. The products of combustion were then expanded in the gas turbine to generate power. The hot exhaust from the gas turbine was further used to jacket the gasifier to supply the required heat to the process (Figure 2 and Table 2).
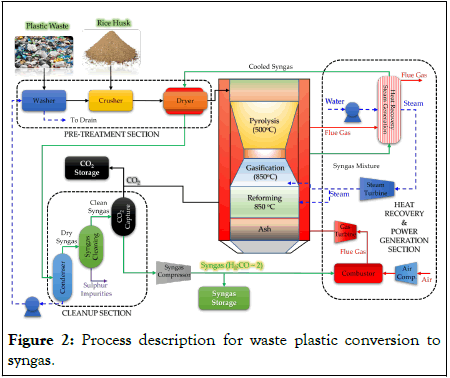
Figure 2: Process description for waste plastic conversion to syngas.
| Proximate analysis | ||
|---|---|---|
| Components | Rice husk | HDPE |
| Moisture | 9.88 | 0 |
| VM | 66.12 | 99.9 |
| FC | 14.18 | 0 |
| Ash | 19.7 | 0.1 |
| Ultimate analysis (dry basis) | ||
| C | 37.55 | 83.3 |
| H2 | 4.61 | 13.9 |
| N2 | 0.46 | 0.13 |
| S | 0.01 | 0.07 |
| O2 | 37.67 | 2.5 |
| Ash | 19.7 | 0.1 |
Table 2: Proximate and ultimate analysis of different waste plastics.
Process modelling and simulation
Self-sustained steady state plant-wide ASPEN Plus models were developed for co-gasification of RH with HDPE to produce syngas coupled with CCU. The models were developed and optimized individually for 11 different compositions of RH and HDPE feed mixture ranging from 0-100% RH. The ASPEN Plus model flow sheet for the integrated process is shown in Figure 2. A stream class called MCINCPSD is defined before the simulation begins, as the overall process contains RH and HDPE, which are categorized as non-conventional streams with particle size distribution, while H2, CO, CH4, CO2, NO2, NO, O2, H2O, S, SO2, and SO3 are regarded as conventional streams, and C is a pure solid representing char. The enthalpy and density of the feed mixture in this case were evaluated using the HCOALGEN and DCOALIGT methods. The Peng Robinson-Boston Mathias (PR-BM) method was used to simulate the properties of all components. No tar formation is considered during thermochemical conversion due to high gasification temperature and use of oxidizing agents (steam and CO2) in excess [9,10]. 100 kg/h of feed mixture was taken as the basis for the comparison of the 11 different cases of feed composition. The crushed feed of RH and HDPE were initially pyrolyzed using separate RYield reactors (B5 and B7) to break them down into its constituent elements based on their respective ultimate analysis as reported in Table 2. The constituent’s elements of RH and HDPE obtained from the RYield reactors are mixed and co-fed to the RGibbs reactor (B9) which acts as a gasifier. The char is gasified using steam and products are obtained from the RGibbs reactor based on the minimization of Gibbs free energy. Further the product gas from B9 unit enters another RGibbs reactor which acts as the reformer where the unconverted hydrocarbons/volatile matters such as CH4 is converted using CO2 and steam to syngas with H2/CO ratio of 2. The syngas obtained is cooled in HeatX (B9) unit while simultaneously producing HP steam. The partially cooled syngas is further used as jacket (B13) for pre-heating/drying the plastic waste. The cooled syngas is then purified by moisture removal in Flash (B14), sulfur removal in Separator (B15), CO2 removal in Separator (B16) units. The energy required for sulfur and CO2 separation were assumed to be 5000 kJ/kg of SOx and 3950 kJ/kg of CO2, respectively. The cleaned syngas was then compressed and a fraction of it was burnt to meet the process energy needs [11,12]. Table 3 gives detailed specifications of the ASPEN Plus modules that were used during the modelling. Multiple design specs and calculator blocks are used as feed backward and feed forward controllers to manage the process parameters heat, steam, CO2 and temperature demands. The details of the design specs and calculator blocks used is provided in Tables 4 and 5, respectively (Figure 3 and Tables 3-5).
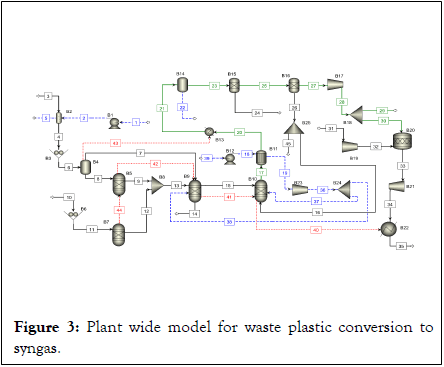
Figure 3: Plant wide model for waste plastic conversion to syngas.
| Unit | Module | Description | Operating conditions |
|---|---|---|---|
| B1 | Pump | Water pumping for washing | Discharge Pressure (DP): 1.1 atm |
| B2 | Sep | Washing plastic waste | Water in WP=5 wt. % |
| B3 | Crusher | Reducing particle size to <3 mm | PSD: 1 mm-3 mm |
| B4 | Flash2 | Dryer: Removing all moisture | T:140°C, P:1 atm |
| B5 | RYield | Pyrolyzer: Decomposing plastic waste to its elemental composition | T:500°C, P:1 atm |
| B6 | Crusher | Reducing particle size to <3 mm | PSD: 1 mm-3 mm |
| B7 | RYield | Pyrolyzer: Decomposing Rice Husk its elemental composition | T:500°C, P:1 atm |
| B8 | Mixer | To mix both streams coming from pyrolyzer 1 and 2 | |
| B9 | RGibbs | Gasifier: Convert fixed carbon and other volatile matter using steam | T:850°C, P:1 atm |
| B10 | RGibbs | Reformer: To obtain H2/CO molar ratio of 2 using CO2 and steam | T:850°C, P:1 atm |
| B11 | HeatX | HP Steam generator and cools RG | Hot stream outlet T: 150°C |
| B12 | Pump | Pumping water for HP steam | P: 80 atm |
| B13 | Heater | Jacketing dryer using RG | P: 1 atm |
| B14 | Flash2 | Removing moisture from SG | T:25°C, P:1 atm |
| B15 | Sep | Removing sulphur impurities | S, SO2, SO3 in stream 19 is 0 |
| B16 | Sep | CO2 separation | CO2 in stream 21 is 0 |
| B17 | Compr | SG compressor | DP: 5 atm, Isentropic Efficiency: 0.9 |
| B18 | Splitter | Splits SG for burning and storing | Split fraction controlled by Design Spec |
| B19 | Compr | Air compressor | DP: 5 atm, Isentropic Efficiency: 0.9 |
| B20 | RStoic | SG combustion | Q: 0 kW, P: 5 atm |
| B21 | Compr | Gas turbine | DP: 1 atm, Isentropic Efficiency: 0.9 |
| B22 | Heater | Jackets the waste plastic conversion process i.e., reactors B5, B7, B9 and B10 | P: 1 atm |
| B23 | Compr | Steam turbine | DP: 1 atm, Isentropic Efficiency: 0.9 |
| B24 | Splitter | Splits hot steam to the gasification and reforming units | Split fraction controlled by design spec |
| B25 | Splitter | Splits captured CO2 | Split fraction controlled by design spec |
Table 3: Details of ASPEN Plus modules used.
| S. no. | Design specifications | Target variable | Manipulated variable |
|---|---|---|---|
| DS1 | To obtain syngas with desired H2/CO ratio of 2 by varying the mass flowrate of captured CO2 entering the reformer | H2/CO in steam 17: 2 | Mass flowrate of stream 16 |
| DS2 | To allow HDPE to retain only 5% of moisture content during washing | Mass fraction of H2O in stream 4: 0.05 | Mass flowrate of stream 5 |
| DS3 | To avoid violation of 2nd law of thermodynamics by keeping the temperature of the exhaust gas (from gas turbine) after supplying heat to the gasifier, 10°C above the dried HDPE feed temperature (140°C) by burning the required amount of syngas in the combustor | Temperature of stream 35: 150°C | Mass flowrate of stream 30 |
| DS4 | Minimum amount of steam required to be sent to the gasifier to completely convert all the char obtained during pyrolysis of RH and HDPE to syngas | Mass flowrate of stream 38: (1.46* mass flow rate of C in stream 13) mass flowrate of stream 7 | Split fraction of B24 |
Table 4: Design Specifications (DS) considered in the proposed schemes model development.
| S. no. | Description | Manipulated variable |
|---|---|---|
| CB1 | Excess air required to maintain the combustor temperature of 1300°C, which in turn avoids the temperature of the exhaust gas to not fall below 150°C, after supplying the process heat | Molar flowrate of stream 31: 2.65* stoichiometric air required to burn H2, CO and CH4 in stream 30 |
| CB2 | Amount of HP-steam to be generated should be 20% in excess to the steam demand of the gasifier | Mass flowrate of stream 39: 1.2* Mass flowrate of stream 38 |
| CB3 | Amount of water required for washing HDPE should be equal to the mass flowrate of HDPE | Mass flowrate of stream 1: Mass flowrate of stream 3 |
Table 5: Calculator Blocks (CB) considered in the proposed schemes model development.
Sequential parametric sensitivity analysis is used to analyze and obtain the optimal process parameters for each of the 11 cases of different feed mixture ranging from 0 to 100% HDPE. Figure 4 shows the effect of varying the Steam to Carbon (S/C) ratio from 0.8 to 2, on carbon conversion within the gasifier for the case of 50% of RH and 50% of HDPE at 850°C. It was found that as the S/C ratio rises, the amount of unconverted carbon in the gasifier reduces which becomes zero at a S/C ratio of 1.2 [13-15].
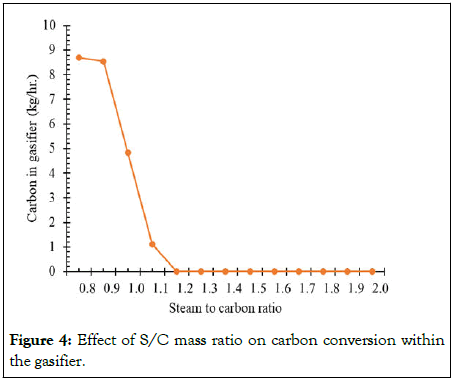
Figure 4: Effect of S/C mass ratio on carbon conversion within the gasifier.
Figure 5 shows the effect of S/C ratio on the overall syngas production, net amount of syngas consumed to meet the process heat demand and net plant efficiency. It was observed that as the S/C ratio increased from 0.8 to 1.4 the net plant efficiency increased from 50.57% to a maximum of 61.08%. Further increase in S/C ratio from 1.4 to 2 tends to gradually decrease the net plant efficiency from 61.08% to 52.07% due to the increase in consumption/burning of produced syngas from 50.76% to 56.87%, respectively. Therefore, S/C of 1.4 within the gasifier is chosen as the optimal ratio for all the cases [16].
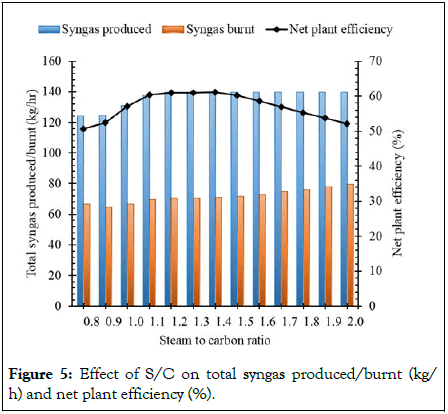
Figure 5: Effect of S/C on total syngas produced/burnt (kg/ h) and net plant efficiency (%).
Table 6 compares the optimal results from the 11 different cases with various feed ratios. The comparison was based on the cogasification of 100 kg/h of feed mixture to produce syngas with H2/CO ratio of 2 while supplying process heat by burning a portion of the produced syngas [17].
Table 6 shows that when RH concentration rises, less steam and CO2 are needed for gasification and reforming since there is less carbon in the feed mixture. Further, the concentration of O2 in the feed mixture also increases as a result of the increase in RH weight percent, which tends to partially oxidize and reform the hydrocarbons and char, thereby reducing the demand for steam and CO2 as oxidizing agents. Further it can also be observed from the Table 6 and Figure 6 that with the increase in HDPE weight% in the feed mixture (or decrease in weight% of RH) the amount of syngas produced is increased due to the higher carbon content in feed which is in agreement with the results reported by Chai, et al. [3,18]. Air compression requires the majority of the process power, followed by syngas compression and CO2 separation. Results also show that the power needed for CO2 compression rises with an increase in RH weight percent because more CO2 is produced during the gasification stage due to an increase in intrinsic O2 content in the feed. Almost the same amount of power was required for crushing RH and HDPE in each case. The amount of water pumped for washing HDPE and HP steam generation was found to be decreasing with an increase in RH weight percent. The energy required for sulphur removal was also found to be decreasing with the increase in RH weight percent due to the lower sulphur content of RH compared to HDPE [11]. Further, it was observed that increase in the weight% of RH in the feed mixture resulted in decrease in the amount of syngas production and amount of syngas burnt to meet the process heat demand. However, it was also observed that a rise in RH weight percent in feed was inversely proportional to the fraction produced syngas that was burnt. Approximately 50% of the produced syngas was burnt in case of pure HDPE, compared to 60% in case of pure RH [12]. Table 6 also shows that more than 90% of the captured CO2 was recycled back for co-gasification, demonstrating the efficacy of the proposed process to utilize CO2. However, as the HDPE content in the feed mixture drops, the CO2 utilization is found to decline, and it falls to just 11% in the case of pure RH. Finally, the net power generation and net plant efficiency tend to decrease with the increase in RH content in the feed mixture. The overall plant efficiency was found to be highest at 68% in case of pure HDPE which decreased to almost half i.e., 35% in case of pure RH, due to the high ash content of the RH in comparison to no ash content in case of HDPE [19,20].
| Parameters | Units | Composition of rice husk with HDPE | ||||||||||
|---|---|---|---|---|---|---|---|---|---|---|---|---|
| Case 1 | Case 2 | Case 3 | Case 4 | Case 5 | Case 6 | Case 7 | Case 8 | Case 9 | Case 10 | Case 11 | ||
| RH flowrate | kg/h | 0 | 10 | 20 | 30 | 40 | 50 | 60 | 70 | 80 | 90 | 100 |
| HDPE flowrate | 100 | 90 | 80 | 70 | 60 | 50 | 40 | 30 | 20 | 10 | 0 | |
| Steam to gasifier | 121.3 | 109.7 | 98.1 | 86.8 | 79.6 | 73.7 | 67.9 | 62 | 56.2 | 50.3 | 50 | |
| Steam to reformer | 27.3 | 30.4 | 33.5 | 36.3 | 35 | 32.4 | 29.7 | 27.1 | 24.4 | 21.8 | 13.6 | |
| CO2 to reformer | 31.6 | 29 | 26.4 | 23.8 | 21.1 | 18.5 | 15.9 | 13.2 | 10.6 | 8 | 5.3 | |
| Reformer gas mass flow | ||||||||||||
| C | kg/h | 0 | 0 | 0 | 0 | 0 | 0 | 0 | 0 | 0 | 0 | 0 |
| CH4 | 0.6 | 0.5 | 0.4 | 0.3 | 0.2 | 0.2 | 0.1 | 0.1 | 0.1 | 0 | 0 | |
| H2 | 27.5 | 25.5 | 23.5 | 21.6 | 19.6 | 17.6 | 15.6 | 13.6 | 11.6 | 9.6 | 7.6 | |
| CO | 191.1 | 177.4 | 163.6 | 149.8 | 136 | 122.1 | 108.3 | 94.4 | 80.5 | 66.5 | 52.6 | |
| CO2 | 35 | 36.3 | 37.5 | 38.8 | 40.1 | 41.4 | 42.7 | 44 | 45.3 | 46.6 | 48 | |
| H2O | 31 | 32.1 | 33.2 | 34.3 | 35.5 | 36.6 | 37.8 | 38.9 | 40.1 | 41.2 | 42.4 | |
| O2 | 0 | 0 | 0 | 0 | 0 | 0 | 0 | 0 | 0 | 0 | 0 | |
| N2 | 0.1 | 0.2 | 0.2 | 0.2 | 0.2 | 0.3 | 0.3 | 0.3 | 0.4 | 0.4 | 0.4 | |
| NO2 | 0 | 0 | 0 | 0 | 0 | 0 | 0 | 0 | 0 | 0 | 0 | |
| NO | 0 | 0 | 0 | 0 | 0 | 0 | 0 | 0 | 0 | 0 | 0 | |
| S | 0 | 0 | 0 | 0 | 0 | 0 | 0 | 0 | 0 | 0 | 0 | |
| SO2 | 0.12 | 0.12 | 0.11 | 0.1 | 0.09 | 0.08 | 0.07 | 0.05 | 0.04 | 0.03 | 0.02 | |
| SO3 | 0 | 0 | 0 | 0 | 0 | 0 | 0 | 0 | 0 | 0 | 0 | |
| Power/energy requirement | ||||||||||||
| Crushing | kW | 0.1 | 0.1 | 0.1 | 0.1 | 0.1 | 0.1 | 0.1 | 0.1 | 0.1 | 0.1 | 0.1 |
| Pumping water | 0.4 | 0.4 | 0.4 | 0.4 | 0.3 | 0.3 | 0.3 | 0.3 | 0.2 | 0.2 | 0.2 | |
| SG compressor | 32.1 | 29.8 | 27.5 | 25.1 | 22.8 | 20.5 | 18.2 | 15.8 | 13.5 | 11.2 | 8.8 | |
| Air compressor | 100.7 | 94 | 87.3 | 80.6 | 73.9 | 67.1 | 60.4 | 53.7 | 46.9 | 40.2 | 33.4 | |
| SG cleaning | 0.18 | 0.17 | 0.15 | 0.14 | 0.12 | 0.11 | 0.09 | 0.08 | 0.06 | 0.04 | 0.03 | |
| CO2 separation from SG | 37.9 | 39.3 | 40.6 | 42 | 43.4 | 44.8 | 46.2 | 47.6 | 49.1 | 50.5 | 51.9 | |
| Power generated | ||||||||||||
| Gas turbine | kW | 307.2 | 286.8 | 266.4 | 246 | 225.5 | 205 | 184.5 | 163.9 | 143.4 | 122.8 | 102.2 |
| Steam turbine | 36.7 | 34.7 | 32.6 | 30.6 | 28.5 | 26.4 | 24.4 | 22.3 | 20.3 | 18.2 | 16.1 | |
| SG details | ||||||||||||
| Total SG produced | kg/h | 219.2 | 203.4 | 187.5 | 171.7 | 155.8 | 139.9 | 124 | 108 | 92.1 | 76.1 | 60.2 |
| SG burnt | 108.6 | 101.5 | 94.3 | 87.1 | 79.8 | 72.6 | 65.4 | 58.1 | 50.8 | 43.5 | 36.2 | |
| Fraction of SG burnt | % | 49.6 | 49.9 | 50.3 | 50.7 | 51.3 | 51.9 | 52.7 | 53.8 | 55.2 | 57.2 | 60.2 |
| SG stored | kg/h | 110.6 | 101.9 | 93.3 | 84.6 | 75.9 | 67.3 | 58.6 | 49.9 | 41.3 | 32.6 | 23.9 |
| CO2 utilization | % | 90.4 | 80 | 70.3 | 61.2 | 52.7 | 44.7 | 37.2 | 30.1 | 23.4 | 17.1 | 11.1 |
| H2/CO | 2 | 2 | 2 | 2 | 2 | 2 | 2 | 2 | 2 | 2 | 2 | |
| LHV of SG stored | kW | 733 | 675.9 | 618.7 | 561.4 | 504.1 | 446.7 | 389.3 | 331.7 | 274.2 | 216.6 | 159 |
| Total amount of power/energy required | 171.4 | 163.7 | 156 | 148.4 | 140.7 | 133 | 125.3 | 117.6 | 109.9 | 102.2 | 94.6 | |
| Total power generated | 343.9 | 321.5 | 299 | 276.5 | 254 | 231.4 | 208.8 | 186.2 | 163.6 | 141 | 118.3 | |
| Net power generated | 172.5 | 157.7 | 143 | 128.2 | 113.3 | 98.4 | 83.5 | 68.6 | 53.7 | 38.7 | 23.8 | |
| Net plant efficiency | % | 68.4 | 67.1 | 65.6 | 63.9 | 61.8 | 59.4 | 56.5 | 53 | 48.6 | 43 | 35.7 |
Table 6: Performance comparison for syngas production.
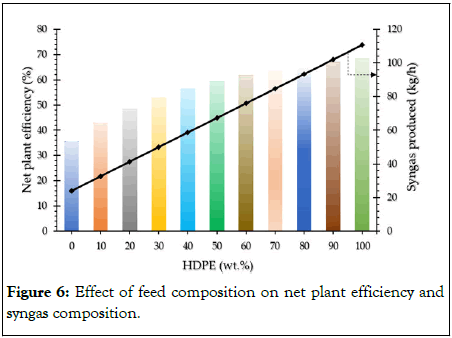
Figure 6: Effect of feed composition on net plant efficiency and syngas composition.
Thermodynamic models for the co-gasification of Rice Husk (RH) and High-Density Polyethylene (HDPE) with a Carbon Capture and Utilization (CCU) system was developed using ASPEN Plus for the generation of syngas with H2/CO ratio of 2. The integrated system was made self-sustainable by adding heat recovery and steam generation and power generation section to meet the process steam and power requirements. The heat demand of the gasifier and reformer is met by burning a fraction of the produced syngas. Sequential parametric sensitivity analysis performed for the case of 50% RH and HDPE showed that complete carbon conversion to syngas within the gasifier can be attained at Steam to Carbon (S/C) ratio of 1.2. However, the net plant efficiency was found to be maximizing at S/C ratio of 1.4. Further the comparative analysis of the 11 different co-gasification cases revealed that the increase in weight percent of RH in feed mixture, resulted in lower carbon content, but higher O2 and ash content during gasification which resulted in
• Decrease in process steam and CO2 demand.
• Decrease in amount of syngas produced.
• Increase in fraction of produced syngas that was burnt to meet process heat demand.
• Decrease in utilization of the captured CO2.
• Decrease in net power generation and net plant efficiency.
Due to the high ash concentration of the RH in comparison to the absence of ash content in the case of HDPE, the total plant efficiency was found to be at its best in the case of pure HDPE at 68% and decreased to practically half (35%), in the case of pure RH.
The authors are grateful to the Director, CSIR-Indian Institute of Chemical Technology, for providing a platform and facilities for carrying out the research. The authors also would like to acknowledge the financial support of Council of Scientific and Industrial Research, India RA Fellowship (Award No. 31/0014(13248)/2022-EMR-I).
[Crossref] [Google Scholar] [PubMed]
Citation: Sravani P, Povari S, Alam S, Nakka L, Srinath S, Chenna S (2024) Co-gasification of Waste Biomass and Plastic for Syngas Production with CO2 Capture and Utilization: Thermodynamic Investigation. J Thermodyn Catal. 15:379.
Received: 23-Jun-2023, Manuscript No. JTC-23-25262; Editor assigned: 26-Jun-2023, Pre QC No. JTC-23-25262 (PQ); Reviewed: 10-Jul-2023, QC No. JTC-23-25262; Revised: 05-Mar-2024, Manuscript No. JTC-23-25262 (R); Published: 12-Mar-2024 , DOI: 10.35248/2157-7544.24.15.379
Copyright: © 2024 Sravani P, et al. This is an open-access article distributed under the terms of the Creative Commons Attribution License, which permits unrestricted use, distribution, and reproduction in any medium, provided the original author and source are credited.