Mycobacterial Diseases
Open Access
ISSN: 2161-1068
ISSN: 2161-1068
Research Article - (2017) Volume 7, Issue 3
The laboratory diagnosis of pulmonary tuberculosis and smear-negative pulmonary tuberculosis in resourcelimited countries are often based on X-ray and sputum smear microscopy. These diagnostic tools require experts, have long turnaround time, and cannot detect resistance to Tuberculosis (TB) drugs and TB in individuals with Human immunodeficiency virus. Recently there was development of GeneXpert MTB/Rif assay that has a short turnaround time and can detect resistance to rifampicin among TB patients but its utility has not been evaluated in Kenya. This study investigated the comparative sensitivity and specificity of smear microscopy and culture relative to GeneXpert MTB/Rif assay among suspected TB patients. A cross-sectional study was conducted in Nyamira County Referral Hospital among suspected TB patients and both results recorded. Culture for Mycobacterium tuberculosis served as the reference standard. The results of this study showed that among 682 enrolled participants, 182(26.69%) were diagnosed TB positive while 500 (73.31%) no TB. GeneXpert mtb/rif had a higher sensitivity (100%) and specificity (99.4%) relative to culture and a positive predictive value of (98.4%) and a negative predictive value of (100%). Smear microscopy revealed low sensitivity (26.4%) and a higher specificity (98.2%). A concordance analysis of smear microscopy and GeneXpert was done. The findings revealed a significant (patients showed resistance to either one of the TB drugs (rifampicin, isoniazid and Ethambutol) while none of the enrolled patients were resistant to streptomycin. In conclusion Gene Xpert MTB/Rif test had high sensitivity compared to smear microscopy. For rifampicin resistance detection, it provided accurate results. My recommendation to the Division of TB and lung diseases is to roll out the Gene Xpert mtb/rif machines to all health care facilities.
Keywords: Gene Xpert assay;Mycobacterium tuberculosis; HIV; Smear microscopy
Globally TB is associated with a lot of morbidity and mortality [1]. More so in high burden like Countries like Kenya where high prevalence of HIV has further compounded this problem leading to resurgence of TB [2]. Moreover, the emergence of MDR- and XDR-TB coupled with inefficient diagnosis is a major challenge to TB control leading to TB being one of the major public health problem in poor resource countries like Kenya [1]. The interaction between TB and HIV has driven TB epidemic in Kenya with 39% of all notified TB cases being HIV-positive individuals [3]. Indeed a recent study found a high prevalence of TB among HIV-exposed infants in Kenya [4].
Geographically, Nyanza region contributes up to 20% of TB cases reported in Kenya [5]. The high incidence of TB cases in this region is partly attributed to high HIV prevalence since the region has a prevalence of 15.1%, which is almost three times the national average of 5.6% [6]. Of note is that 75% of TB patients notified in Nyanza are HIV co-infected [7] further indicating that HIV is impacting on the epidemiology of TB in this region [6]. In addition, Nyamira County in Nyanza region has TB notification rate of 131 cases per 100,000 and the County has enrolled 10 cases of MDR-TB [8]and HIV prevalence of 14.8% [9].
Of note both microscopy and culture assays that are currently used in Nyamira County referral hospital may give conflicting results of smear positive and culture negative TB and not sensitive in detecting TB in immunocompromised individuals such as HIV infected individuals[10-12]. Although the sensitivity of culture assays can be improved by adding mycolic acid and resuscitation factor proteins [13], this approach is not currently widely applied in Counties with limited laboratory capacity like Nyamira. Therefore, this study will analyze the utility of Gene Xpert assay in diagnosing TB in relation to diagnostic assays currently in use to determine the most sensitive and specific assay that be applied for efficient manage of treatment of TB in the TB program at large that has recently introduced the Gene Xpert Mtb/rif machines in Country [14].
Study area
The study area was Nyamira County Referral Hospital which is in Nyamira County. Nyamira County is in the former Nyanza Province of Kenya. Nyamira County Referral Hospital lies between latitudes 0° 30| and 0° 45| south and longitudes 350 45| and 350 00| east. It was formerly part of the present Kisii County when County was a district before 1986; it is sometimes called North Kisii County. The county has a population of 598,252 with a population density of 724 persons per square kilometer [15]. Its capital and largest town is Nyamira, with an urban population of around 41,668 [15]. Nyamira County is surrounded with Kisii County from the South, Kericho County from the North, Homa Bay County from the West and Bomet County from the East. The County has a TB prevalence of 12.0% and HIV prevalence of 6.4% [9]. The number of health facilities is 182 with 37 facilities with diagnostic laboratories. The County is rich in agriculture with tea being the main cash crop.
Study population
The study participants included male and female suspected TB cases aged ≥ 2 years either coming for diagnosis or relapse cases.
Sample size calculation
Since the primary aim of this study was to determine the efficiency of Gene Xpert assay compared to smear microscopy and DST in an area with high HIV and TB prevalence [16], This study calculated the sample size using a formula developed by [17] for epidemiological studies as shown below;
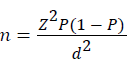
Where, n = sample size
Z = Z statistic for a level of confidence
P = expected prevalence or proportion
d = precision
Given that 39% of all notified TB cases in Kenya are HIV-positive individuals [18] and assuming a precision, d, of 0.05, which is half of P , and Z is 1.96 (95%CI). The sample size is calculated as shown below;
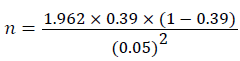
n = 366
Assuming an attrition of 20% then the study will need 439 study participants
Sampling technique
After identifying all the potential study participants from the target population, a systematic random sampling was then used to choose the study population
Ethics statement
Ethical approval for this study was obtained from the Ethical Review Board of University of East Africa Baraton (REC.UEAB/18/02/2016).
Data management and analysis
All analysis were be performed using SAS version 9.2 (SAS Institute Inc., Cary, North Carolina, USA) using the sample survey procedures to take into account the sampling technique (Systematic). Kappa statistics (K) was used to determine agreement beyond what would be expected by chance between smear microscopy result, Gene Xpert mtb/rif assay and the actual test result. Following convention [17,18], four levels of agreement for kappa: <0.40 (poor), 0.40-0.59 (fair), 0.60-0.80 (good), and >0.80 (excellent) was reported. Standard epidemiological measures of validity (sensitivity, specificity, negative and positive predictive values) were computed using ROC curves.
Sensitivity was computed as the ratio of those who correctly identified themselves as being definite (positive) tuberculosis to all those who were positive on the test. Specificity was calculated as the ratio of those correctly identifying themselves as being non-definite (negative) tuberculosis to all those who were negative on the test. The positive predictive values was determined by the ratio of true positive to the number of individuals reporting they were HIV positive while the negative predictive value will be calculated as the ratio of those truly negative to those reporting they were HIV negative. Chi square test to investigate association between selected background characteristics and the concordance of tuberculosis test report and the test report. The entire test was significant at p ≤ 0.05.
Reason for choosing the level of significant
A small p-value (typically ≤ 0.05) indicates strong evidence against the null hypothesis, so you reject the null hypothesis. A large p-value (>0.05) indicates weak evidence against the null hypothesis, so you fail to reject the null hypothesis.
P Values. The P value, or calculated probability, is the probability of finding the observed, or more extreme, results when the null hypothesis (H0) of a study question is true – the definition of 'extreme' depends on how the hypothesis is being tested.
In the majority of analyses, an alpha of 0.05 is used as the cutoff for significance. If the p-value is less than 0.05, we reject the null hypothesis that there's no difference between the means and conclude that a significant difference does exist
Social demographic and clinical characteristics of the study population
Among the 682 patients enrolled in this study (Table 1) 182(26.68%) were diagnosed with definite TB (positive reference) while 500 (73.31%) non- definite TB (negative reference). One hundred and two (102) out of the 182 patients with definite TB were males while for non- definite TB cases there were 265 males. In terms of patient types there were 2 (0.29%)MDR cases, 138(20.23%) new cases, 3 (0.44%) follow up after two months, 28 (4.11%) of relapse cases, 6(0.88%) return after default cases, 1(0.15%) return after completing treatment case and there no patients with treatment failures among the definite TB cases.
| Definite | Non- definite | P-value | |
|---|---|---|---|
| Patients (n) | 182(26.68%) | 500(73.31%) | |
| Gender | 0.481 | ||
| Male | 102(14.96%) | 265(38.86%) | |
| Female | 80(11.73%) | 235(34.46%) | |
| Patient type | 0.001 | ||
| Multidrug resistant | 2(0.29%) | 3(0.44%) | |
| New | 138(20.23%) | 419(61.44%) | |
| Follow up second month | 3(0.44%) | 18(2.63%) | |
| Follow up second month | 3(0.44%) | 18(2.63%) | |
| Relapse | 28(4.11%) | 48(7.01%) | |
| Return after default | 6(0.88%) | 11(1.61%) | |
| Return after completing treatment | 1(0.15%) | 1(0.15%) | |
| TB treatment failure | 0(0.00%) | 4(0.59%) | |
| Time of specimen taken | 0.07 | ||
| Morning | 166(24.34%) | 430(63.05%) | |
| Spot | 16(2.34%) | 70(10.26%) | |
| Type of specimen | 0.569 | ||
| Blood stained | 4(0.59%) | 4(0.59%) | |
| Gastric lavage | 11(1.60%) | 32(4.70%) | |
| Muco-purulent | 151(22.14%) | 411(60.32%) | |
| Purulent | 0(0%) | 3(0.44%) | |
| Saliva | 16(2.34%) | 50(7.33%) | |
| HIV status | 0.002 | ||
| Positive | 125(18.32%) | 278(40.76%) | |
| Negative | 57(8.36%) | 222(32.55%) | |
| Occupation | 0.045 | ||
| Health worker | 11(1.60%) | 56(8.21%) | |
| Non health worker | 171(25.07%) | 444(55.10%) | |
| Smear microscopy | 0.001 | ||
| Positive | 48(7.01%) | 9(1.32%) | |
| Negative | 134(19.65%) | 491(72.00%) | |
| Gene Xpert mtb/rif | 0.001 | ||
| Positive | 182(26.69%) | 3(0.44%) | |
| Negative | 0(0.00%) | 497(72.87%) | |
Table 1: Baseline characteristic of definite and non-definite tuberculosis.
Among the 500 non definite TB patients, 3 (0.44%) were MDR cases, 419 (61.44%) were new cases, 18 (2.63% were follow up to 2 moth cases, 48(7.01%) were relapse cases, 11 (1.61%) were return after default cases, 1(0.15%) return after completing and 4 (0.59%) were TB treatment failure cases. Overall there was a significant difference in terms of patient type (p<0.001). One sixty six of patients with definite TB had morning sputum specimen taken while 16 had spot sputum specimen taken.
For the non -definite TB cases those with morning sputum specimen were 430 (63.05%) while those whose spot sputum specimen were taken were 70 (10.26%) but there was no significant difference in the type of specimen taken (p=0.070).
Chi-square test was used for all analysis
The most common type of specimen taken was muco-purulent 151(22.14%), followed by saliva 16 (2.34%), gastric lavage 11 (1.60%), blood stained 4 (0.59%) and purulent was 0 among the definite TB patients.
For non -definite TB patients, the most common specimen taken was muco-purulent 411 (60.32%), then saliva 50 (7.33%), gastric lavage 32 (4.70%), blood stained 4 (0.59%), purulent were 3 (0.44%). There was significant differences in the type of specimen taken (p=0.569).
Analysis of the patients by HIV status revealed that a majority of definite TB patients 125 (18.32%) were HIV positive while 57 (8.36%) were HIV negative. Two hundred seventy eight patients (40.76%) out of 500 non-definite TB patients were HIV positive while 222 (32.55%) were HIV negative. There were significant differences in TB patients by their HIV status (p=0.002).
Further analysis revealed that majority of patients with definite TB was non- health workers 171 (25.07%) while health workers were 11 (1.60%). Similarly for non-definite TB, 444 (55.10%) were non-health workers while 56 (8.21%) were health workers.
These data revealed that there was a significant difference in the occupation of enrolled patients (p=0.045). Diagnosis with smear microscopy revealed that a majority of definite TB patients 134(19.65%) were smear negative while 48 (7.01%) were smear positive. Similarly for non-definite TB a majority of the enrolled patients were smear negative 491 (72.00%) while 9 (1.32%) were smear positive and there was statistical difference between smear negative and positive patients (p=0.001).
All the definite TB patients were also TB patients when diagnosed with Gene Xpert Mtb/rif test while for non-definite TB 3 were positive by Gene Xpert mtb/rif while 497 were TB negative by Gene Xpert mtb/ rif . Further analysis revealed that there significant differences Gene Xpert mtb/rif positive and negative TB patients (p=0.001).
Comparative performance of Smear Microscopy and Gene Xpert mtb/rif relative to culture
As shown in Table 2 and Figure 1, the results of this study show that relative to culture, smear microscopy had a low sensitivity (26.4%, 95% CI :20.1-33.4). However, smear microscopy had a higher specificity (98.2%, 95%CI: 96.6-99.2).
| Culture versus | Sensitivity% (95% CI) | Specificity% (95% CI) | PPV% (95% CI) | NPV% (95% CI) |
+LR (95% CI) |
-LR (95% CI) |
|---|---|---|---|---|---|---|
| Smear microscopy | 26.4 (20.1-33.4) |
98.2 (96.6-99.2) |
84.2 (72.1-92.5) |
78.5 (75.1-81.6) |
14.65 (7.33-29.25) |
0.75 (0.69-0.82) |
| Gene Xpert MTB/RIF | 100 (98.0-100) |
99.4 (98.3-99.9) |
98.4 (95.3-99.7) |
100 (99.3-100) |
167 (54.15-517.07) |
0 |
Table 2: Performance of smear microscopy and Gene Xpertmtb/rif tests based on sensitivity, specificity, predictive values and likelihood ratios

Figure 1: Performance of smear microscopy and Gene Xpertmtb/rif tests based on sensitivity, specificity, predictive values and likelihood ratios.
The positive predictive value was (84.2%, 95% CI: 72.1-92.5) while the negative predictive value was (78.5%, 95% C1:75.1-88.16). The two assays had a positive likelihood ration of (14.65%, 95% CI : (( 7.33-29.25) while the negative likelihood ration was (0.75%, 95% CI: 0.69-0.82).
Further analysis revealed that Gene Xpert mtb/rif had a higher sensitivity (100%, 95% CI: 98.0-100) and specificity (99.4%, 95% CI: 98.3-99.9) relative to culture. In addition they a positive predictive value of (98.4%, 95% CI: 95.3-99.7) and a negative predictive value of (100%, 95% CI: 99.3-100).
The two methods had a positive likelihood ration of (167%, 95% CI: 54.15-517.07) while there negative likelihood ratio was zero (0). A positive MTB (Mycobacterium tuberculosis) fluid culture and/or positive MTB sputum culture with MTB infection used as a reference.
Concordance among smear microscopy, GeneXpert and culture results
As shown in Table 3, the percentage of study participants who were reported to be TB positive by smear microscopy were less than those who were reported to be TB positive by GeneXpert mtb/rif (7.01 versus 19.65%, respectively ). A comparison of smear microscopy and GeneXpert was done to gauge the concordance of Smear microscopy results and GeneXpert mtb/rif results, the findings revealed a significant (p<0.0001) variation in agreement between the two the two assays 113.78% with a Cohen’s kappa, 0.3181(CI=0.2424 - 0.3938).
| Gene Xpert mtb/rif assay | ||||||
|---|---|---|---|---|---|---|
| Smear microscopy | Positive n (%) |
Negative n (%) |
Agreement | Kappa* | 95% CI | P - value |
| Positive | 48(7.04) | 9(1.34) | 113.78 | 0.3181 | 0.2424-0.3938 | <.0001 |
| Negative | 134(19.65) | 491(71.99) | ||||
Table 3a: Kappa score on reliability of smear microscopy and Gene Xpert.
| Culture | ||||||
|---|---|---|---|---|---|---|
| Smear microscopy | Positive n (%) |
Negative n (%) |
Agreement | Kappa* | 95% CI | P–value |
| Positive | 48(7.04) | 9(1.34) | 112.22 | 0.3099 | 0.2342-0.3856 | <.0001 |
| Negative | 134(19.65) | 491(71.99) | ||||
Table 3b: Kappa score on reliability of smear microscopy and culture.
| Culture | ||||||
|---|---|---|---|---|---|---|
| Gene Xpert Mtb/rif | Positive n (%) |
Negative n (%) |
Agreement | Kappa* | 95% CI | P–value |
| Positive | 182(26.69) | 3(0.44) | 3 | 0.9888 | 0.9762-1.0000 | <0.0001 |
| Negative | 0(0.00) | 499(73.17) | ||||
Table 3c: Kappa score on reliability of smear microscopy and culture.
Similarly the percentage of participants who were reported to be TB positive by smear microscopy was less than those who were reported to be TB positive by culture (7.01 versus 19.65%, respectively). A comparison of smear microscopy and culture test were done to gauge the concordance of Smear microscopy results and culture results, the findings revealed a significant (p<0.0001) variation in agreement between the two the two assays, 112.22% with a Cohen’s kappa, 0.3099 (CI=0.2342-0.3856).
Further analysis revealed that there was no difference in percentages of the study participants who reported to be TB positive by both culture and GeneXpert assays (26.69%).
There was a marginal variation in agreement between culture and GeneXpert , 97.5% with a Cohen’s kappa of 0.9888(0.9762-1.0000).
Resistance to first and second-line TB drugs
The results of this study indicate that 36 (5.28%) out of 682 enrolled patients showed resistance to either one of the first line TB drugs (rifampicin, isoniazid and Ethambutol) while none of the enrolled patients were resistant to streptomycin which is a second line TB drugs. Drug resistance test using GeneXpert mtb/rift and DST revealed that 22(3.23%) were resistant to rifampicin.
Further analysis using DST revealed that 25(3.67%) of the enrolled patients were resistant to isoniazid and 18 (2.6%) were resistant to Ethambutol while none was resistant to streptomycin. Stratification of the patients by HIV status revealed that 15 out of 22 who were resistant to rifampicin based on GeneXpert mtb/rif results were HIV positive while 14 out of the 22 who were rifampicin resistant based direct culture and sensitivity were also HIV positive. Seventeen out of 24 TB patients who were resistant to Isoniazid were also HIV positive. For Ethambutol there were 15 out of 18 TB patients who were HIV positive.
These data indicate that a majority of those manifesting resistant to TB drugs were HIV positive patients (62) but HIV negative patients who were resistant were (24). HIV status further revealed that 7 out of 22 who were resistant to rifampicin based on GeneXpert mtb/rif results were HIV negative while 7 out of the 21 who were rifampicin resistant based direct culture and sensitivity were also HIV negative. Seven out of 24 TB patients who were resistant to Isoniazid were also HIV negative.
For Ethambutol there were 3 out of 18 TB patients who were HIV positive. The data also revealed that 12 out 14 patients were sensitive to rifampicin based on GeneXpert mtb/rif results were HIV positive while 13 out of the 15 who were rifampicin sensitive based direct culture and sensitivity were also HIV positive. Ten out of 12 TB patients who were sensitive to Isoniazid were also HIV positive. For Ethambutol there were 12 out of 18 TB patients who were HIV positive. For Streptomycin 27 out 36 who were sensitive were HIV positive These data indicate that a majority of those manifesting sensitive to TB drugs were HIV positive patients (74) but HIV negative patients who were sensitive were(21).
Gene Xpert MTB/rif assay has high sensitivity and specificity in the detection tuberculosis among suspected Tb cases. Gene Xpert MTB/RIF assay likely to perform well in any setting using sputum for pulmonary tuberculosis diagnosis compared to smear microscopy and also has higher sensitivity in TB detection among smear negative patients.
There is concordance between Gene Xpert and Culture in the detection of rifampicin resistance tuberculosis among TB suspected cases, it provided accurate results and it can used in earlier initiation of MDR-TB treatment pending results from convectional DST. A majority of smear negative tuberculosis cases were HIV positive.
There is low prevalence of resistance against first line anttuberculosis drugs while there is no resistance to streptomycin which is a second line anti-tuberculosis drug.
Although smear microscopy is widely available, sensitivity is suboptimal, as we and others have previously demonstrated. Nevertheless, it remains a widely available relatively low cost test. Diagnosing drugresistant pulmonary TB also merits cost consideration.
As much the test is expensive, Government should be encouraged to procure more of these machines to help earlier and prompt start of treatment to improve TB out come in high burden TB-HIV coinfection settings however should be used among smear negative patients whether HIV positive or negative