Journal of Proteomics & Bioinformatics
Open Access
ISSN: 0974-276X
ISSN: 0974-276X
Research - (2024)Volume 17, Issue 1
The COVID-19 pandemic, driven by the SARS-CoV-2 virus, has emerged as an unparalleled global public health crisis. Despite extensive research efforts, the precise etiology of this disease remains enigmatic. In this study, we employ in-silico methods to analyze publicly available gene expression datasets from the Gene Expression Omnibus (GEO), aiming to uncover the underlying molecular mechanisms. Gene expression datasets were retrieved from GEO and differential gene expression patterns were identified using the GEO 2R pipeline. Subsequent analyses included the generation of heatmaps, Principal Component Analysis (PCA), construction of Protein-Protein Interaction (PPIs) networks and Kyoto Encyclopedia of Genes and Genomes (KEGG) pathway predictions through network analyst and Database for Annotation, Visualization and Integrated Discovery (DAVID). We also examined key hub genes, micro Ribonucleic Acids (miRNA) targets and potential drug targets to elucidate the molecular intricacies involved. Our analysis revealed pivotal hub genes, such as Von Willebrand Factor (VWF), Tumor Necrosis Factor (TNF), E2F 1, Interleukin 1β (IL1β), Interleukin 10 (IL 10), Interleukin-12A (IL-12A), Integrin subunit Beta-5 (ITGβ-5), Elastase, Neutrophil Expressed (ELANE) and Polo-Like Kinase 1 (PLK 1), alongside significant miRNAs like hsa- mir193b-3p, hsa-mir-92a-3p, hsa-mir-16-5p, hsa-mir-1925p, hsa-let-7b-5p, hsa-mir26a-5p, hsa-mir1865p, hsa-mir243a- 5p and hsa-mir-34a-5p. Pathways linked to inflammation, including neutrophil extracellular trap formation, systemic lupus erythematous, complement and coagulation cascades and the Coronavirus Disease-19 (COVID-19) pathway, played crucial roles in COVID-19 pathogenesis. Additionally, these identified genes and microRNAs hold promise as potential drug targets and biomarkers. In summary, this research offers valuable insights into the pathways, biomarkers, including gene targets and microRNA targets, as well as potential drug targets associated with the inflammatory and coagulation aspects of COVID-19. These discoveries enhance our understanding of the disease's molecular intricacies and open doors to the development of precisely targeted therapeutic interventions.
COVID-19; RNA seq data; miRNA; In-silico analysis; Inflammation; Coagulation
The global impact of the Severe Acute Respiratory Syndrome- Coronavirus-2 (SARS-CoV-2), responsible for the Coronavirus Disease-2019 (COVID-19) pandemic, cannot be overstated. Emerging from Wuhan, China, three years ago, this highly contagious virus has posed a profound and ongoing public health challenge [1-3]. It manifests through a diverse array of symptoms, including cough, fever, myalgias, headache, loss of smell, pain and skin rashes.
Left untreated, these symptoms can escalate to life-threatening conditions such as septic shock, respiratory failure, multi-organ failure and regrettably, fatality. Strikingly, the duration of these symptoms exhibits wide variability, ranging from a relatively brief 10-15 days to persistent affliction spanning months [4-6]. As of 25 October, 2023, a staggering 696,939,069 cases have been documented globally, with 6,931,480 lives tragically lost [7].
SARS-CoV-2's primary targets within the human body include lung cells, olfactory epithelial cells, vascular cells and intestinal cells. Infection by this virus triggers intricate immunological responses, often resulting in cellular damage [8]. However, the precise mechanisms governing these processes remain elusive, representing a critical knowledge gap in our understanding of COVID-19.
With the advent of the modern era, bioinformatics has emerged as a vital component of comprehension [9]. By providing access to an extensive array of web-based tools, databases and expansive datasets, bioinformatics has democratized access to critical research resources. Leveraging publicly available datasets, this endeavor aspires to contribute significantly to our elucidation of the intricate molecular underpinnings of SARS-CoV-2 infection, thereby offering potential avenues for the development of more efficacious therapeutic interventions [4,10-12]. The present study is dedicated to harnessing these resources to conduct an in-silico analysis, with the primary objectives of scrutinizing genes, Ribonucleic Acid (RNA) targets, pathways and the identification of novel drug targets as shown in schematic workflow (Figure 1).
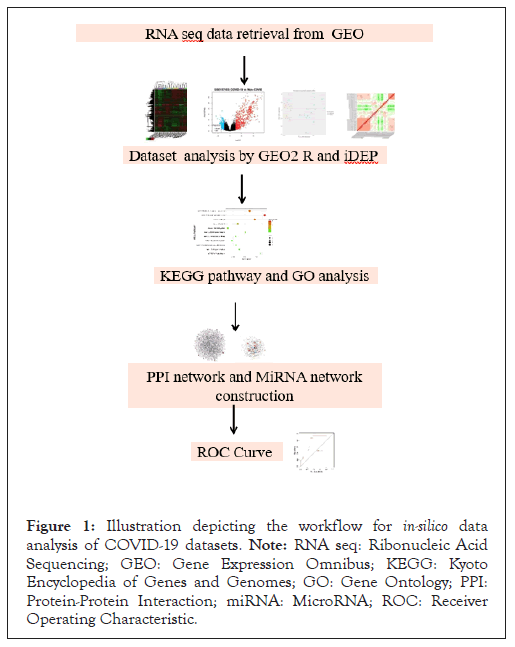
Figure 1: Illustration depicting the workflow for in-silico data analysis of COVID-19 datasets. Note: RNA seq: Ribonucleic Acid Sequencing; GEO: Gene Expression Omnibus; KEGG: Kyoto Encyclopedia of Genes and Genomes; GO: Gene Ontology; PPI: Protein-Protein Interaction; miRNA: MicroRNA; ROC: Receiver Operating Characteristic.
Dataset selection
We accessed publicly available datasets, namely GSE 157103 and GSE 152418, from the Gene Expression Omnibus (GEO) [12,13]. Differential gene expression analysis was performed using GEO 2R with Differential Expression analysis (DESeq) which works on R package [14]. Differentially Expressed Genes (DEGs) were defined based on a fold change of 1.0 or greater and a p-value threshold of less than 0.05. Additionally, we conducted heat map and PCA using Integrated Differential Expression and Pathway analysis (IDEP) for exploratory data visualization [15,16] (Table 1).
| S.no. | GEO ID series | Tissue type | Case-control group | Experiment Type | Platform | Journal | Year |
|---|---|---|---|---|---|---|---|
| 1 | GSE15710 3 | Leukocytes from whole blood | 100 COVID- 26 control | Expression profiling by high throughput | GPL24676 | Cell Syst 2021 Ref 12 |
Aug-20 |
| 2 | GSE15241 8 | PBMC | 17 COVID- 19 | Expression profiling by high throughput sequencing | GPL24676 | Science 2020 Ref 13 |
20-Jul |
Note: GEO: Gene Expression Omnibus; PBMC: Peripheral Blood Mononuclear Cells.
Table 1: Dataset details used in the study.
KEGG pathway enrichment analysis
To gain insights into the biological processes associated with hub genes, we performed KEGG pathway enrichment analysis using DAVID 2.0 [17,18]. This analysis encompassed molecular, cellular and biological processes, with a focus on pathways exhibiting adjusted p-values below 0.05. The bubble plot was plotted with the help of SR Plot Bio-info online software [19].
Protein-Protein Interaction (PPI) network construction
To elucidate potential interactions among the identified genes, we constructed a PPI network of list of combined proteins from both the datasets. The duplicates proteins were also removed. This network was created using network analyst 3.0 drawing on literature-curated databases [20].
miRNA target gene analysis
We identified miRNAs associated with hub genes and constructed miRNA-target gene interaction networks. This analysis was conducted using network analyst 3.0 enhancing our understanding of potential regulatory mechanisms [20].
Drug-gene interaction database
To identify potential therapeutic avenues, we evaluated drugtarget interactions related to hub genes. This analysis relied on a drug target interaction database, shedding light on potential drug candidates for further investigation [21].
Expression analysis of inflammation and coagulation genes
Expression patterns of inflammation and coagulation related genes were explored by generating heat maps in each dataset using IDEP. Receiver Operating Characteristic (ROC) analysis was also conducted to assess the diagnostic potential of important genes.
Statistical analysis
We carried DEG analysis of GSE 152418 and GSE 157103 datasets with the help of GEO 2R which uses DESeq which works on R package and DEG genes with Benjamini-Hochberg method with adjust P-value<0.05-fold change ± 1, were considered as significant [14]. For Gene Ontology (GO) and KEGG pathways with FDR<0.05 considered as significantly enriched pathways and terms. Correlation matrix plot uses pearson's correlation coefficient. In heat map the genes are clustered on the basis of average linkage, euclidean distance with the help of IDEP software [15,16].
Dataset analysis and DEG identification
We have analyzed datasets GSE 152418 and GSE 157103 through GEOR and IDEP which uses differential gene expression analysis based on the negative binomial distribution DESeq 2 which works on R package fold change ± 1, P-value<0.05 in dataset GSE 157103, we found 1315 significantly differently expressed genes (Figures 2A- 2F). PCA plot is used to visualize characteristics of RNA sequence data, the data of COVID patients shown in red are clustered in lower right side of the axis (Figure 2B). The heat map of 10,000 genes which are differently expressed clustered together based on average linkage for hierarchical clustering in dataset have been shown (Figure 2E). The red color showed upregulated gene expression while green color shows that gene expression is downregulated. The correlation matrix illustrated person's correlation coefficient, red color which means strong correlation between samples whereas green showed weak correlation. The samples are placed in similar order both vertically and horizontally (Figure 2D). The quality of RNA samples was good and similar in both the group as shown in (Figure 2F).
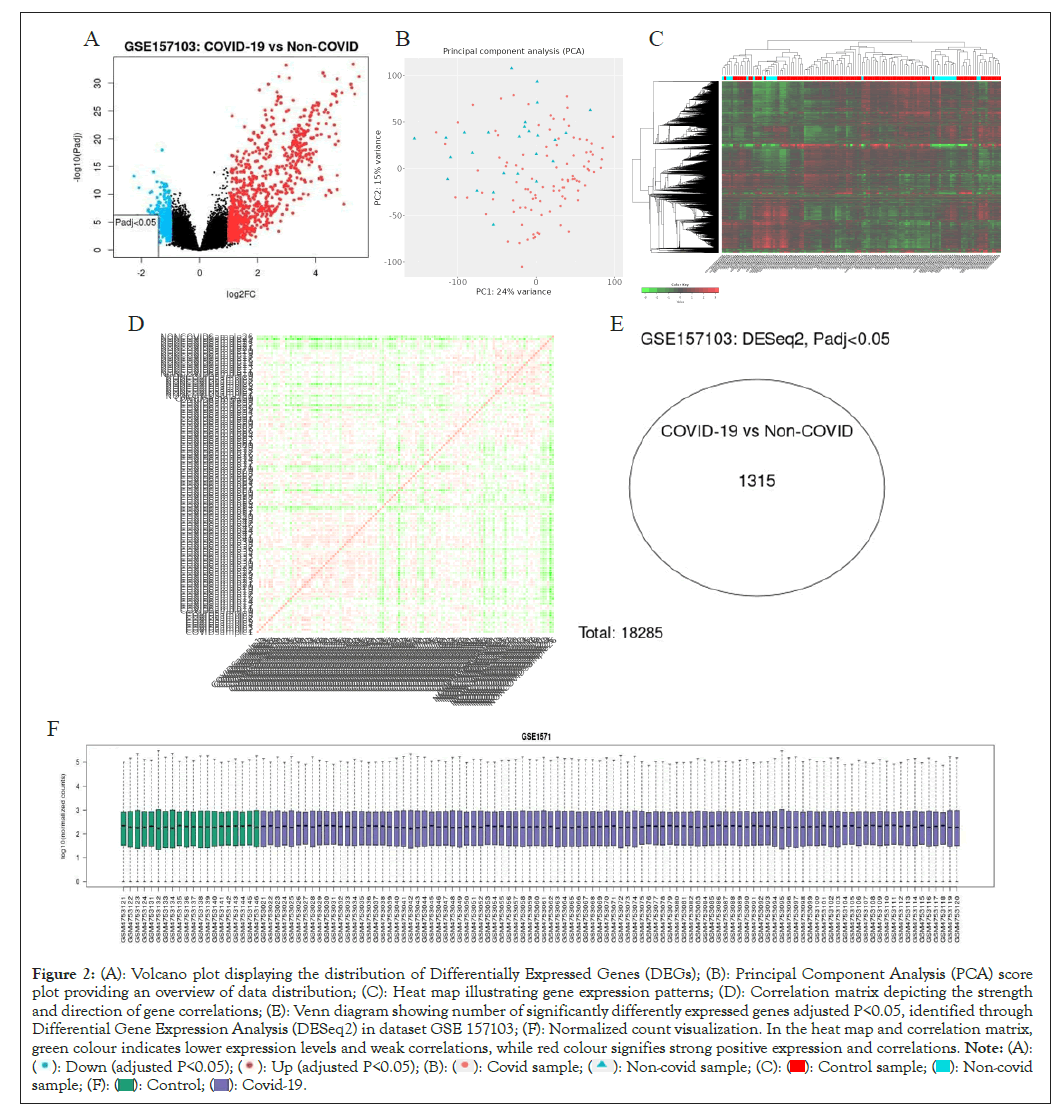
Figure 2: (A): Volcano plot displaying the distribution of Differentially Expressed Genes (DEGs); (B): Principal Component Analysis (PCA) score
plot providing an overview of data distribution; (C): Heat map illustrating gene expression patterns; (D): Correlation matrix depicting the strength
and direction of gene correlations; (E): Venn diagram showing number of significantly differently expressed genes adjusted P<0.05, identified through
Differential Gene Expression Analysis (DESeq2) in dataset GSE 157103; (F): Normalized count visualization. In the heat map and correlation matrix,
green colour indicates lower expression levels and weak correlations, while red colour signifies strong positive expression and correlations. Note: (A): 

We have analyzed datasets GSE 152418 through GEOR and IDEP which uses DESeq 2 which works on R package fold change ± 1, P-value<0.05 in dataset GSE 152418, we found 1120 significantly differently expressed genes (Figures 3A-3F). PCA plot is used to visualize characteristics of RNA sequence data, all data of COVID and healthy patients are grouped in two different clusters (Figure 3B).
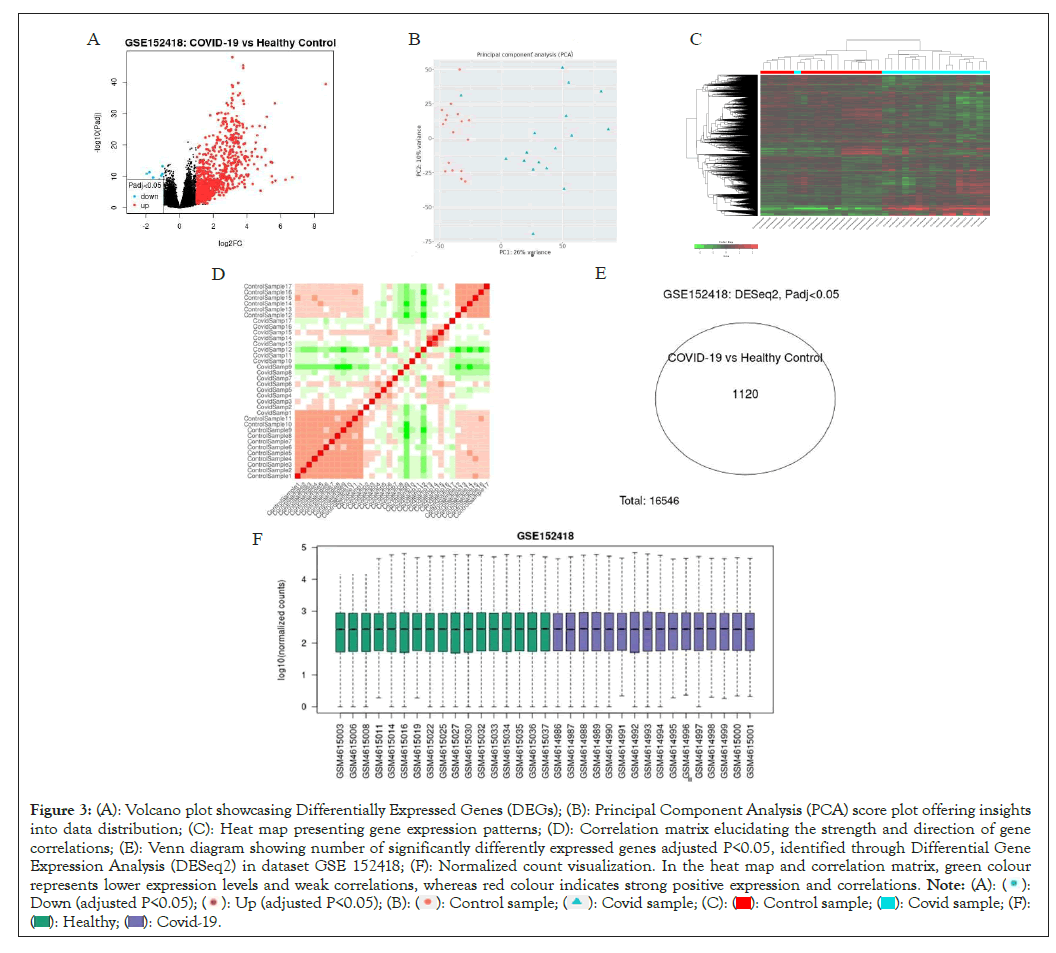
Figure 3: (A): Volcano plot showcasing Differentially Expressed Genes (DEGs); (B): Principal Component Analysis (PCA) score plot offering insights
into data distribution; (C): Heat map presenting gene expression patterns; (D): Correlation matrix elucidating the strength and direction of gene
correlations; (E): Venn diagram showing number of significantly differently expressed genes adjusted P<0.05, identified through Differential Gene
Expression Analysis (DESeq2) in dataset GSE 152418; (F): Normalized count visualization. In the heat map and correlation matrix, green colour
represents lower expression levels and weak correlations, whereas red colour indicates strong positive expression and correlations. 


The control samples mainly clustered in left side while COVID patients’ samples are clustered on right side of the axis; The heat map of 10,000 genes which are differently expressed clustered together based on average linkage for hierarchical clustering in dataset have been shown (Figure 3C). The red color showed upregulated gene expression while green color shows that gene expression is downregulated The correlation matrix illustrated pearson's correlation coefficient, red color which means strong correlation between samples whereas green showed weak correlation. The samples are placed in similar order for both vertically and horizontally (Figure 3D). The quality of RNA samples in the form of normalized courts was good and similar in both the group as shown in (Figure 3F).
KEGG pathway and go analysis
In dataset 152418 the enriched KEGG pathway adjust P<0.05 are; neutrophil extracellular trap formation, systemic lupus erythematous, cell cycle, complement and cascades, tumor suppressor signaling p53 pathway, anti-folate resistance, dilated cardiomyopathy, Extracellular Matrix (ECM)-receptor interaction. The major biological function is adaptive immune response, immunoglobulin production, immune response, complement activation-classical pathway, phagocytosis- engulfment, immunoglobulin mediated immune response, Deoxyribonucleic Acid (DNA) replication, positive regulation of endothelial cell proliferation. The molecular functions are; DNA binding, antigen binding, peroxidase activity, protein hetero-dimerization activity, microtubule binding, oxygen transporter activity, haptoglobin binding. The major cellular components are; plasma membrane, extracellular region, extracellular space, immunoglobulin complex, platelet alpha granule lumen, hemoglobin complex, haptoglobin-hemolobin complex, Immunoglobulin G (IgG) complex, Immunoglobulin M (IgM) complex, Immunoglobulin A (IgG) complex (Figures 4A-4D).
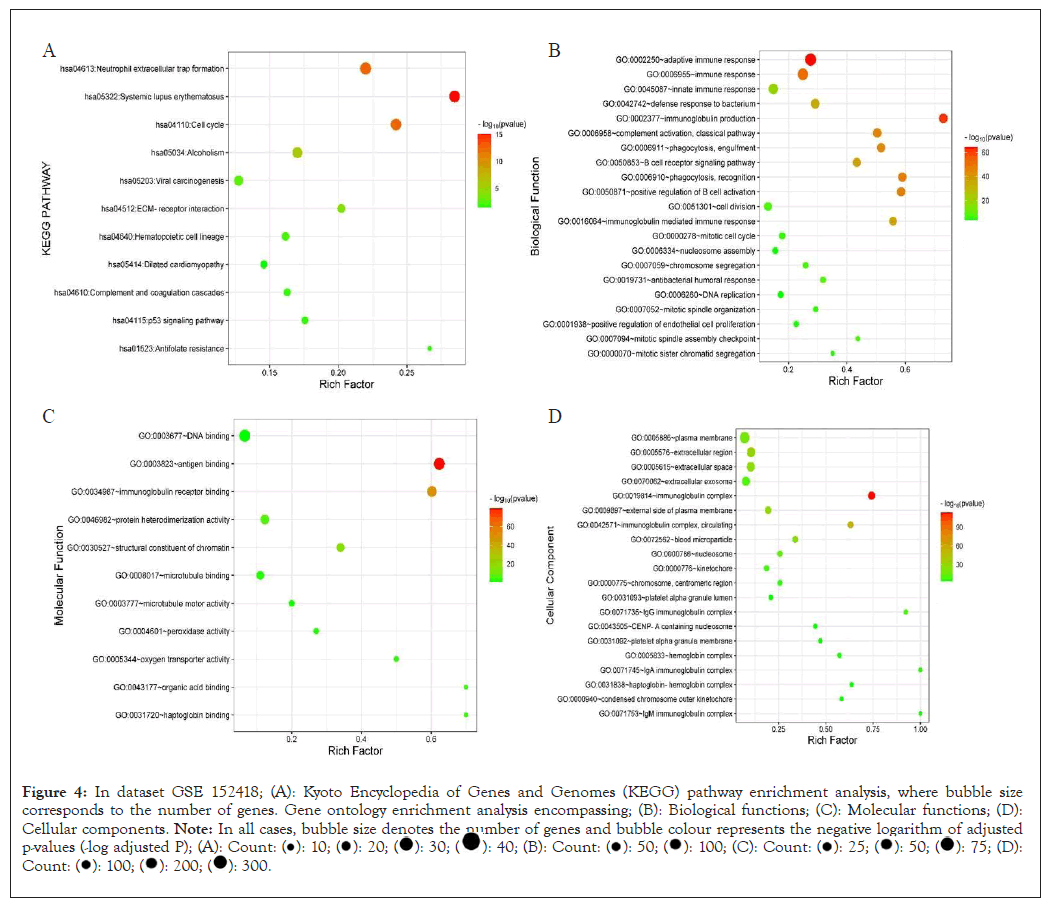
Figure 4: In dataset GSE 152418; (A): Kyoto Encyclopedia of Genes and Genomes (KEGG) pathway enrichment analysis, where bubble size
corresponds to the number of genes. Gene ontology enrichment analysis encompassing; (B): Biological functions; (C): Molecular functions; (D):
Cellular components. Note: In all cases, bubble size denotes the number of genes and bubble colour represents the negative logarithm of adjusted 

In dataset 157103 the enriched KEGG pathway, adjust P<0.05 are; cell cycle, COVID-19, motor proteins, ribosome, neutrophil extracellular trap formation. Enriched biological function were; adaptive immune response, immunoglobulin production, immune response, complement activation-classical pathway, phagocytosisengulfment, immunoglobulin mediated immune response, DNA replication, positive regulation of endothelial cell proliferation, B cell receptor signaling pathway, defense response to virus, response to virus, negative regulation of viral genome, chromosome segregation, innate immune response to mucosa, mitotic spindle organization, mitotic sister chromatid segregation, mitotic spindle check point. The molecular function was; Adenosine Triphosphate (ATP) binding, immunoglobulin-receptor binding, microtubule motor activity. The major cellular components are; plasma membrane, extracellular region, extracellular space, immunoglobulin complex, platelet alpha granule lumen, hemoglobin complex, haptoglobinhemolobin complex, IgG immunoglobulin complex, IgM immunoglobulin complex, IgA immunoglobulin complex, midbody, blood micro-particle, spindle, mitotic spindle. Specific granule lumen, Immunoglobulin D (IgD) complex, kinectochore, external side of plasma membrane (Figures 5A-5D).
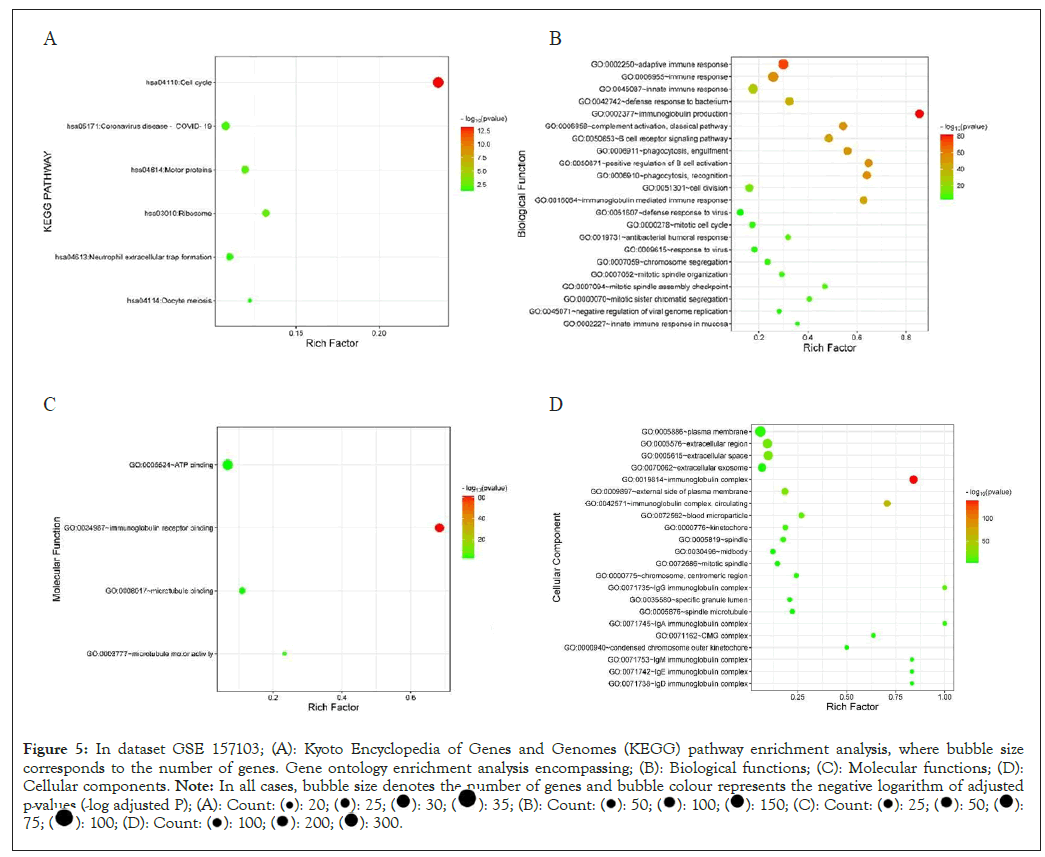
Figure 5: In dataset GSE 157103; (A): Kyoto Encyclopedia of Genes and Genomes (KEGG) pathway enrichment analysis, where bubble size
corresponds to the number of genes. Gene ontology enrichment analysis encompassing; (B): Biological functions; (C): Molecular functions; (D):
Cellular components. Note: In all cases, bubble size denotes the number of genes and bubble colour represents the negative logarithm of adjusted
p-values (-log adjusted P); (A): 

PPI network formation
The significantly expressed genes from both the datasets were combined together and duplicates genes were removed. The genes were subjected to form PPI network. The network has 476 nodes and 915 edges (Figure 5). The degree ranges from 38 to 1 and betweeness ranges from 16451 to 0 (Table 2).
| Label | Degree | Betweenness |
|---|---|---|
| Cyclin-Dependent Kinase 1 ( CDK1) | 38 | 16451.79 |
| Polo-Like Kinase 1 (PLK1) | 25 | 7026.08 |
| E2F Transcription Factor 1 (E2F1) | 24 | 8839.72 |
| Cell Division Cycle Protein 20 (CDC20) | 22 | 4203.84 |
| Aurora kinase B (AURKB) | 19 | 4445.41 |
| Cyclin B1 (CCNB1) | 19 | 2657 |
| Interferon-Stimulated Gene 15 (ISG15) | 18 | 8456.9 |
| Cyclin A2 (CCNA2) | 17 | 3406.49 |
| Minichromosome Maintenance Complex Component 6 (MCM6) | 16 | 1938.23 |
| Minichromosome Maintenance Complex Component 2 (MCM2) | 15 | 5542.74 |
| Cell Division Cycle 6 (CDC6) | 15 | 1155.15 |
| Cyclin A1 (CCNA1) | 14 | 2353.25 |
| Chromatin licensing and DNA replication factor 1 (CDT1) | 14 | 722.44 |
| BUB1 Mitotic Checkpoint Serine/Threonine Kinase B (BUB1B) | 13 | 1019.79 |
| Ribosomal Protein S2 (RPS2) | 12 | 861.02 |
| Elastase, Neutrophil Expressed (ELANE) | 11 | 7037.99 |
| Budding Uninhibited by Benzimidazole 1 (BUB1) | 11 | 1214.7 |
| Cyclin E1 (CCNE1) | 11 | 459.55 |
| Origin Recognition Complex Subunit 1 (ORC1) | 11 | 251.3 |
| Cell Division Cycle Protein 45 (CDC45) | 9 | 1840.14 |
| Ribosomal Protein S19 (RPS19) | 9 | 632.29 |
| Ribosomal Protein L36 (RPL36) | 8 | 129.54 |
| Ribosomal Protein S15 (RPS15) | 8 | 121.9 |
| Cell Division Cycle 7 (CDC7) | 8 | 64.72 |
| Minichromosome Maintenance Complex Component 4 (MCM4) | 8 | 49.59 |
| Eukaryotic Translation Initiation Factor 2 Alpha Kinase 2 (EIF2AK2) | 7 | 1704.81 |
| Ribosomal Protein Lateral Stalk Subunit P1 (RPLP1) | 7 | 420.59 |
| Checkpoint Kinase 1 (CHEK1) | 7 | 230.32 |
| Origin Recognition Complex Subunit 6 (ORC6) | 7 | 12.06 |
| Ribosomal Protein S28 (RPS28) | 7 | 2.15 |
| Hemoglobin Subunit Alpha 1 (HBA1) | 6 | 2092.73 |
| Cell Division Cycle 25 A (CDC25A) | 6 | 517.18 |
| Ribosomal Protein L18a (RPL18A) | 6 | 475.12 |
| MAD2 Mitotic Arrest Deficient-Like 1 (MAD2L1) | 6 | 243.73 |
| Ribosomal Protein L13 (RPL13) | 6 | 238.79 |
| Ribosomal Protein Lateral Stalk Subunit P2 (RPLP2) | 6 | 118.77 |
| Thyroid Receptor-Interacting Protein 13 (TRIP13) | 5 | 2359 |
| Complement C1q Subcomponent Subunit A (C1QA) | 5 | 1520.72 |
| Tumor Necrosis Factor (TNF) | 5 | 1153.37 |
| F-Box Protein 5 (FBXO5) | 5 | 106.44 |
| Ribosomal Protein L8 (RPL8) | 5 | 105.47 |
| Cyclin-Dependent Kinase Inhibitor 2A (CDKN1C) | 4 | 745.13 |
| Pituitary Tumor Transforming Gene 1 (PTTG1) | 4 | 476.8 |
| Complement C1q C Chain (C1QC) | 4 | 107.07 |
| Ribosomal Protein L35 (RPL35) | 4 | 73.84 |
| Cyclic Adenosine Monophosphate (CAMP) | 3 | 774.98 |
| MX Dynamin Like GTPase 1 (MX1) | 3 | 545.46 |
| Serine/Threonine Kinase (WEE1) | 3 | 512.12 |
| Threonine Tyrosine Kinase (TTK) | 3 | 34.99 |
| Azurocidin 1 (AZU1) | 2 | 946 |
| Mitogen-Activated Protein Kinase 11 (MAPK11) | 2 | 474 |
| Integrin Subunit Alpha 2b (ITGA2B) | 2 | 474 |
| Interleukin 12A (IL12A) | 2 | 474 |
| Von Willebrand factor (VWF) | 2 | 461.15 |
Table 2: Topological properties of important genes which are playing crucial role in inflammation and coagulation in the Protein-Protein Interaction (PPI) network.
The important genes which are crucial role in inflammation and coagulation are; Cyclin-Dependent Kinase-1 (CDK-1), PLK 1, E2F 1, Minichromosome Maintenance Complex component (MCM6), MCM2, Cell Division Cycle 6 (CDC 6), Ribosomal Proteins S19 (RPS19), TNF, VWF, Interleukin 12A (IL12A), Ribosomal Proteins-L8 (RP-L8), Cluster of Differentiation-34 (CD-34), Myeloperoxidase (MPO), IL10, IL1B, etc. (Figure 6).
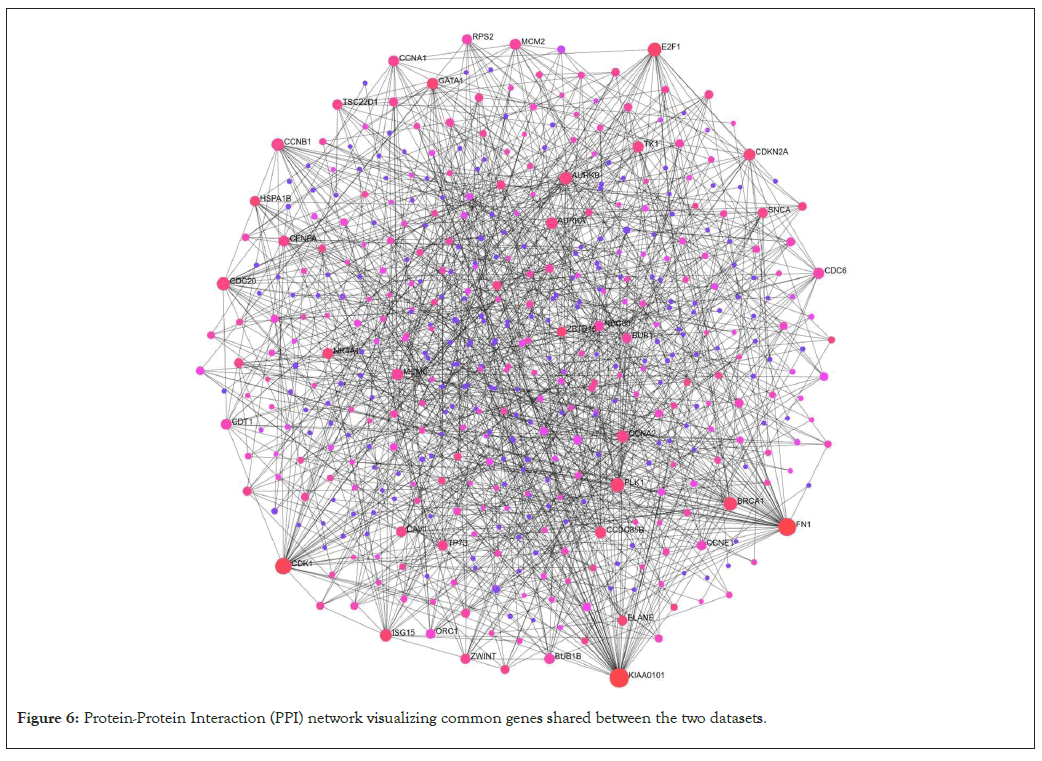
Figure 6: Protein-Protein Interaction (PPI) network visualizing common genes shared between the two datasets.
Gene-miRNA network analysis
Gene-MiRNA network has 126 nodes and 331 edges (Figure 7). The hub miRNAs are; hsa-mir193b-3p, hsa-mir-92a-3p, hsa-mir-16- 5p, hsa-mir-1925p, hsa-let-7b-5p, hsa-mir26a-5p, hsa-mir1865p, hsamir243a- 5p and hsa-mir-34a-5p (Table 3).
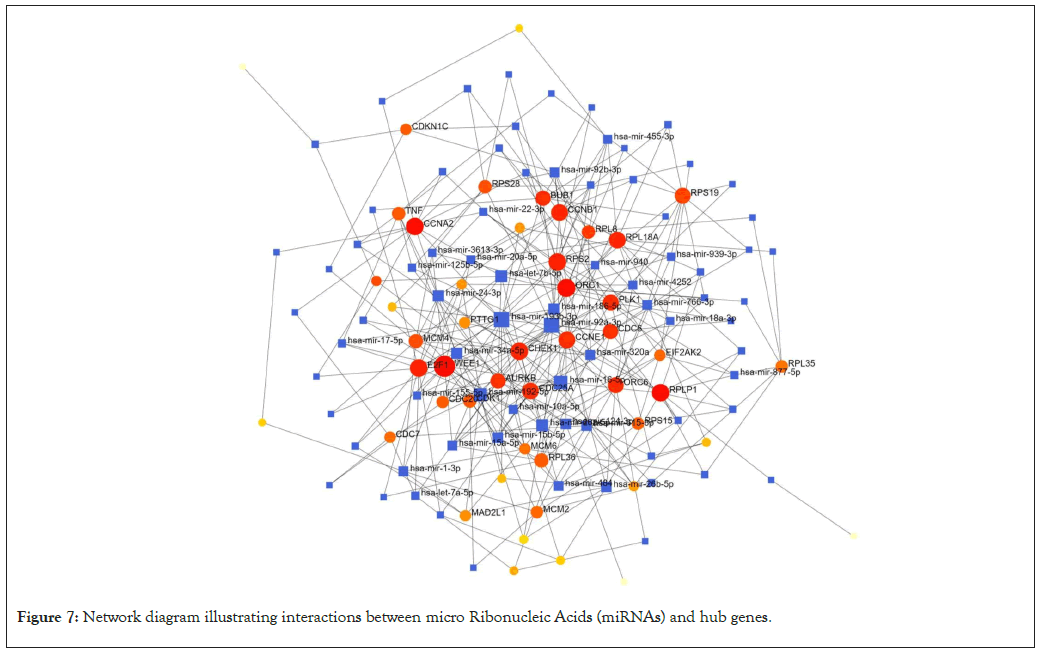
Figure 7: Network diagram illustrating interactions between micro Ribonucleic Acids (miRNAs) and hub genes.
| Label | Degree | Betweenness |
|---|---|---|
| Serine/Threonine Kinase (WEE1) | 18 | 848.71 |
| hsa-mir-193b-3p | 16 | 822.41 |
| hsa-mir-92a-3p | 15 | 775.73 |
| Origin Recognition Complex Subunit 1 (ORC1) | 13 | 617.12 |
| Ribosomal Protein Lateral Stalk Subunit P1 (RPLP1) | 12 | 622.47 |
| Cyclin A2 (CCNA2) | 12 | 570.23 |
| hsa-mir-16-5p | 12 | 461.82 |
| Ribosomal Protein S2 (RPS2) | 12 | 458.63 |
| E2F Transcription Factor 1 (E2F1) | 12 | 420.89 |
| Checkpoint Kinase 1 (CHEK1) | 12 | 384.38 |
| Ribosomal Protein L18a (RPL18A) | 11 | 393.15 |
| Cyclin B1 (CCNB1) | 11 | 370.25 |
| Cyclin E1 (CCNE1) | 11 | 329.58 |
| hsa-mir-192-5p | 11 | 326.48 |
| Cell Division Cycle 25 A (CDC25A) | 11 | 303.61 |
| Polo-Like Kinase 1 (PLK1) | 10 | 344.57 |
| Origin Recognition Complex Subunit 6 (ORC6) | 1 | 343.24 |
| Ribosomal Protein S19 (RPS19) | 10 | 228.41 |
| hsa-let-7b-5p | 9 | 402.84 |
| Budding Uninhibited by Benzimidazole 1 (BUB1) | 9 | 348.35 |
| Cell Division Cycle 6 (CDC6) | 9 | 319.2 |
| Aurora kinase B (AURKB) | 9 | 307.1 |
| hsa-mir-26a-5p | 9 | 219.13 |
| hsa-mir-186-5p | 8 | 280.29 |
| hsa-mir-24-3p | 8 | 216.9 |
| hsa-mir-34a-5p | 8 | 195.96 |
| Minichromosome Maintenance Complex Component 4 (MCM4) | 8 | 176.6 |
| Ribosomal Protein L36 (RPL36) | 8 | 131.66 |
| hsa-mir-124-3p | 7 | 324.46 |
| Ribosomal Protein L8 (RPL8) | 7 | 245.79 |
| hsa-mir-615-3p | 7 | 167.02 |
| Ribosomal Protein S28 (RPS28) | 7 | 163.31 |
| hsa-mir-26b-5p | 7 | 153.75 |
| Cyclin-Dependent Kinase 1 (CDK1) | 7 | 140.94 |
| Tumor Necrosis Factor (TNF) | 7 | 138.87 |
| hsa-mir-15b-5p | 7 | 124.88 |
| hsa-mir-92b-3p | 6 | 179.43 |
| hsa-mir-1-3p | 6 | 173.37 |
| hsa-mir-766-3p | 6 | 149.1 |
| Cell Division Cycle Protein 20 (CDC20) | 6 | 143.46 |
| hsa-mir-320a | 6 | 135.13 |
| Ribosomal Protein S15 (RPS15) | 6 | 125.44 |
| hsa-mir-484 | 6 | 112.53 |
| Minichromosome Maintenance Complex Component 2 (MCM2) | 6 | 100.22 |
| Ribosomal Protein L35 (RPL35) | 6 | 87.92 |
| hsa-mir-15a-5p | 6 | 54.02 |
| hsa-mir-455-3p | 5 | 146.45 |
| hsa-mir-10a-5p | 5 | 131.43 |
| Cyclin-Dependent Kinase Inhibitor 2A (CDKN1C) | 5 | 128.97 |
| Eukaryotic Translation Initiation Factor 2 Alpha Kinase 2 (EIF2AK2) | 5 | 116.67 |
| Minichromosome Maintenance Complex Component 6 (MCM6) | 5 | 92.98 |
| Cell Division Cycle 7 (CDC7) | 5 | 92.94 |
| hsa-mir-20a-5p | 5 | 89.75 |
| hsa-mir-4252 | 5 | 77.11 |
Table 3: Topological properties of hub genes and micro Ribonucleic Acids (miRNAs) targets the Protein-Protein Interaction (PPI) network.
Drug gene interaction
With the help of drug gene interaction databases, we found drugs for various DEG; E2F1 has bortezoimb, flurouracil, etoposide, methotrexate, cisplatin, irinotecan. TNF has hydroxychloroqine, thalidomide, gemcitabine, carboplatin, lenalidomide, sorafenib. VWF has mitomycin, prednisone, streptozoin, thalidomide, vincristine. Mitogen-Activated Protein Kinase 11 (MAPK11) has sorafenib and pirfenidone. These drugs serve as a crucial role in treating pathogenesis of COVID-19 (Table 4).
| Search term | Match term | Gene | Drug | Interaction-types | Sources | PubMed Identifier (PMIDS) |
|---|---|---|---|---|---|---|
| E2F1 | E2F1 | E2F1 | Bortezomib | NCI | 11489836 | |
| E2F1 | E2F1 | E2F1 | Fluorouracil | NCI | 9766655 | |
| E2F1 | E2F1 | E2F1 | Carmustine | NCI | 11445852 | |
| E2F1 | E2F1 | E2F1 | Etoposide | NCI | 9766655|16849574 | |
| E2F1 | E2F1 | E2F1 | Methotrexate | NCI | 14654896 | |
| E2F1 | E2F1 | E2F1 | Irinotecan | NCI | 9766655 | |
| E2F1 | E2F1 | E2F1 | Paclitaxel | NCI | 16849574 | |
| E2F1 | E2F1 | E2F1 | Cisplatin | NCI | 16849574 | |
| AURKB | AURKB | AURKB | Sorafenib | DTC | - | |
| AURKB | AURKB | AURKB | Dasatinib | DTC | - | |
| AURKB | AURKB | AURKB | Pazopanib | DTC | - | |
| ISG15 | ISG15 | ISG15 | Irinotecan | Inhibitor | MyCancerGenomeClinicalTrial | |
| CCNE1 | CCNE1 | CCNE1 | Palbociclib | CIViC | 25557169|27020857|30807234 | |
| RPS19 | RPS19 | RPS19 | Dexamethasone | NCI | 15755903 | |
| CHEK1 | CHEK1 | CHEK1 | Olaparib | CIViC | 28490518 | |
| CHEK1 | CHEK1 | CHEK1 | Cisplatin | CIViC | 28490518 | |
| CHEK1 | CHEK1 | CHEK1 | Gemcitabine | NCI | 17245119 | |
| CHEK1 | CHEK1 | CHEK1 | Etoposide | DTC | 22364746 | |
| CHEK1 | CHEK1 | CHEK1 | Palbociclib | DTC | - | |
| RPL13 | RPL13 | RPL13 | Thalidomide | PharmGKB | 20038957 | |
| RPL13 | RPL13 | RPL13 | Docetaxel | PharmGKB | 20038957 | |
| TNF | TNF | TNF | Hydroxychloroquine | NCI | 9002011 | |
| TNF | TNF | TNF | Gemcitabine | PharmGKB | 31616045 | |
| TNF | TNF | TNF | Thalidomide | Inhibitor | TdgClinicalTrial|TEND|TTD | 8755512|12046682|12167383|12105857|12102294|11752352|12113124 |
| TNF | TNF | TNF | Lenalidomide | ClearityFoundationClinicalTrial|TTD | ||
| TNF | TNF | TNF | Sorafenib | PharmGKB | 22736425 | |
| TNF | TNF | TNF | Carboplatin | PharmGKB | 31616045 | |
| WEE1 | WEE1 | WEE1 | Gemcitabine | CIViC | 26057002 | |
| MAPK11 | MAPK11 | MAPK11 | Sorafenib | PharmGKB | 20124951 | |
| MAPK | MAPK11 | MAPK11 | Pirfenidone | TdgClinicalTrial | ||
| VWF | VWF | VWF | Mitomycin | NCI | 2104558 | |
| VWF | VWF | VWF | Prednisone | NCI | 3146197 | |
| VWF | VWF | VWF | Streptozocin | NCI | 16422885|3928783 | |
| VWF | VWF | VWF | Thalidomide | NCI | 12871448 | |
| VWF | VWF | VWF | Vincristine | NCI | 3875694 | |
Note: E2F1: E2F Transcription Factor 1; AURKB: Aurora kinase B; ISG15: Interferon-Stimulated Gene 15; CCNE1: Cyclin E1; RPS19: Ribosomal Protein S19; CHEK1: Checkpoint Kinase 1; RPL13: Ribosomal Protein L13; TNF: Tumor Necrosis Factor; WEE1: Serine/Threonine Kinase; MAPK11: Mitogen-Activated Protein Kinase 11; VWF: Von Willebrand factor; NCI: National Cancer Institute; DTC: Direct to Consumer; CIViC: Clinical Interpretation of Variants in Cancer; PharmGKB: Pharmacogenomics Knowledge Base; TTD: Time to Treatment Discontinuation.
Table 4: Important genes and their drug targets.
Expression and ROC analysis of genes related to inflammation and coagulation
From KEGG pathways and GO analysis of both datasets, we found inflammation and coagulation pathways plays an important role in the pathogenesis of COVID-19. We constructed the heat map of those genes which are responsible for inflammation pathways and coagulation in both the datasets i.e. GSE 157103 and 152418. The expression of these genes are VWF, TNF, CD34, IL10, IL12A, MPO, RPL8, RPL35 has been shown in (Figures 8A and 8B). In ROC, Area Under the Curve (AUC) value of VWF, TNF, IL-1B, CD34 is 0.703, 0.781, 0.721, 0.073 respectively (Figures 9A-9D). This AUC value suggesting that these molecules could be serving as a potential biomarker in COVID-19.
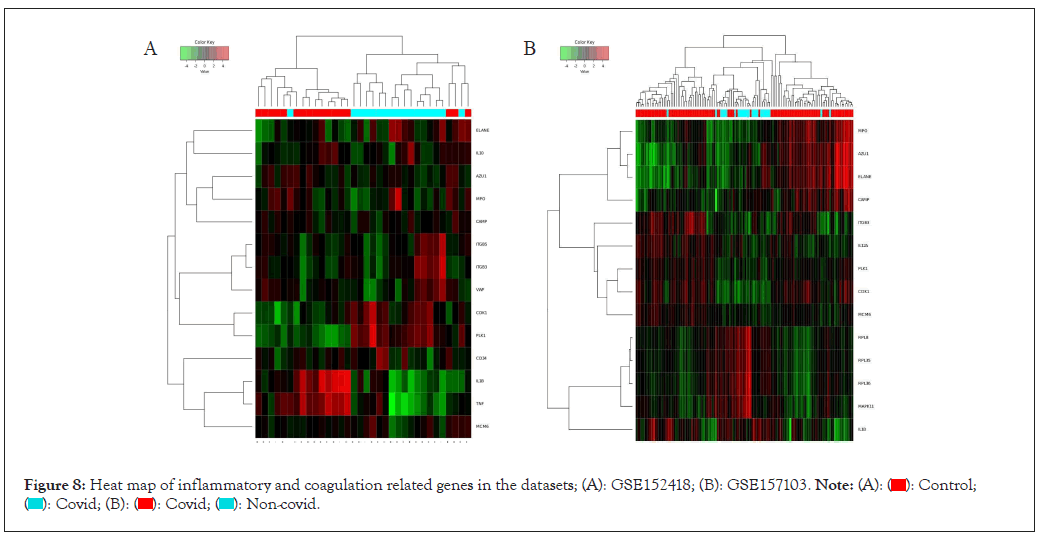
Figure 8: Heat map of inflammatory and coagulation related genes in the datasets; (A): GSE152418; (B): GSE157103. 

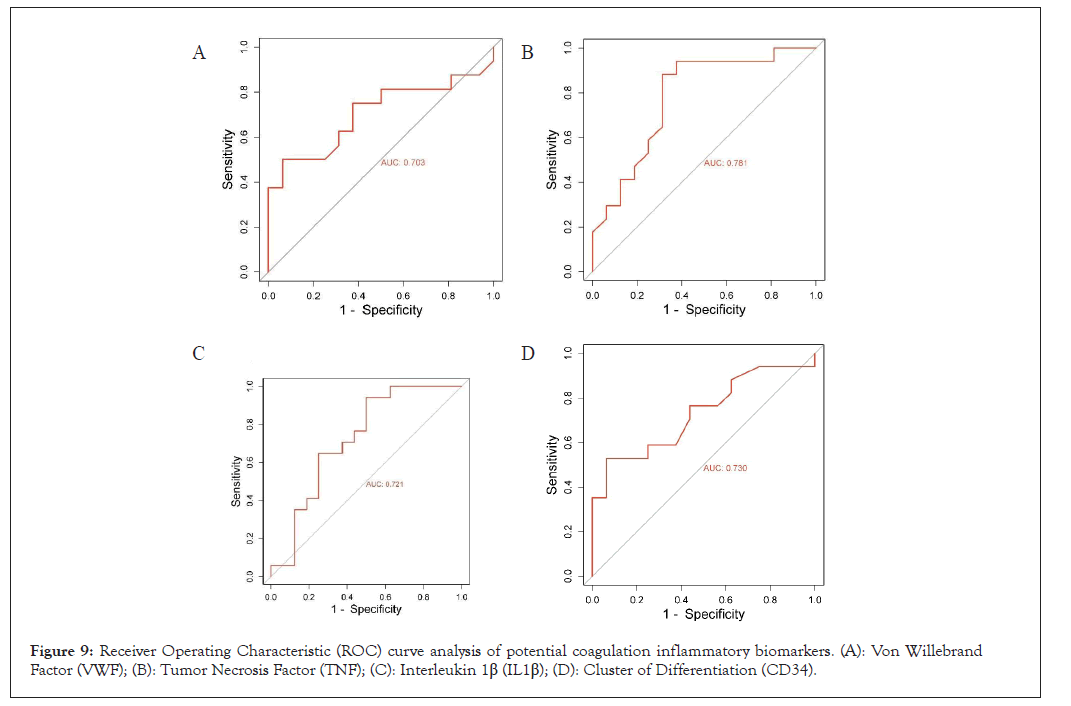
Figure 9: Receiver Operating Characteristic (ROC) curve analysis of potential coagulation inflammatory biomarkers. (A): Von Willebrand Factor (VWF); (B): Tumor Necrosis Factor (TNF); (C): Interleukin 1β (IL1β); (D): Cluster of Differentiation (CD34).
This manuscript uses in-silico analysis of publicly available gene expression datasets from the GEO database to uncover molecular mechanisms behind COVID-19. It identifies DEGs using the GEO 2R pipeline, crucial for understanding COVID-19's molecular basis. Heat maps and PCA are used to visualize and analyze gene expression patterns. The study constructs protein-protein interaction networks and predicts KEGG pathways related to DEGs, offering insights into COVID-19's molecular pathways and potential drug targets for tailored therapies in the ongoing pandemic.
One of main protein related to coagulation in our study is VWF. It is a multimeric glycoprotein which plays an important role in primary hemostasis [22]. It binds to factor VIII and increases its half-life 8-12 hours which responsible for blood clotting. Literature showed VWF plays an important role thrombosis and COVID-19. Studies have shown VWF are associated with inflammation in COVID-19 related thrombosis patients [23-25]. In our study we found similar result in dataset GSE 152418 that VWF is significantly upregulated in COVID-19. Also, from other studies and our ROC data supports that could be used a potential risk biomarker for coagulation prediction.
TNF serves as a pivotal regulator of the immune response in COVID-19. Its disruption can result in immune deficiencies, which in turn contribute to the development of severe inflammatory diseases [26,27]. While several studies have reported elevated TNF levels in COVID-19 patients, our research revealed a contrary trend, showing decreased TNF levels in individuals with the virus. In our study, another crucial protein, IL1B, is also implicated in the formation of cytokine storms and is found to be decreased in COVID-19 cases [28]. Both TNF and IL1B have emerged as potential markers for assessing immunological responses in COVID-19, based on insights from the literature and ROC analysis.
In our study, we identified pathways such as neutrophil extracellular trap formation, the complement system and the coagulation cascade, along with the coronavirus-19 disease pathways. These pathways play a role in attracting neutrophils, which subsequently lead to inflammation, thrombus formation and lung injury in COVID-19 patients [29-32]. Micro RNAs are a fascinating class of small noncoding RNA molecules that play a crucial role in the regulation of gene expression in various organisms [33]. In our study, hsamir193b- 3p, hsa-mir-92a-3p, hsa-mir-16-5p, hsa-mir-1925p, hsa-let- 7b-5p, hsa-mir26a- 5p, hsa-mir1865p, hsa-mir243a-5p and hsa-mir- 34a-5p are associated with differential expressed genes and could be serve as potential biomarkers in COVID-19 [34,35]. Also, our drug gene interaction VWF, TNF, MAPK11, Ribosomal Protein L13 (RP L13) could be serve as therapeutic targets for COVID-19.
First, analysis criteria dependency; DEG identification is influenced by analysis criteria; altering criteria such fold change and adjust P-value may yield different results. Second, limited dataset scope; our study relies on a small number of selected datasets, potentially limiting the generalizability of our findings. Third, need for clinical validation; while the in-silico analysis provides insights, clinical sample validation is essential to confirm real-world applicability.
Our study identifies pivotal genes like VWF, TNF, IL10, IL12A, MPO, IL-1B, CD34 and microRNAs such as hsa-mir-34a-5p, hsa-mir92a-3p, hsa-mir-16-5p, hsa-mir-1925p, hsa-mir26a-5p, hsa-mir243a- 5p and hsa-mir-34a-5p in COVID-19's molecular landscape. These findings offer promise for precision medicine in combatting the pandemic. We emphasize the need for multidisciplinary approaches in understanding complex diseases. As COVID-19 evolves, our research contributes to global efforts to mitigate its impact and guide future therapeutic strategies, marking a crucial step forward in the battle against this unprecedented public health challenge.
The author expresses gratitude for the availability of publicly accessible COVID-19-related datasets on Gene Expression Omnibus (GEO).
[Crossref] [Google Scholar] [PubMed]
[Crossref] [Google Scholar] [PubMed]
[Crossref] [Google Scholar] [PubMed]
[Crossref] [Google Scholar] [PubMed]
[Crossref] [Google Scholar] [PubMed]
[Crossref] [Google Scholar] [PubMed]
[Crossref] [Google Scholar] [PubMed]
[Crossref] [Google Scholar] [PubMed]
[Crossref] [Google Scholar] [PubMed]
[Crossref] [Google Scholar] [PubMed]
[Crossref] [Google Scholar] [PubMed]
[Crossref] [Google Scholar] [PubMed]
[Crossref] [Google Scholar] [PubMed]
[Crossref] [Google Scholar] [PubMed]
[Crossref] [Google Scholar] [PubMed]
[Crossref] [Google Scholar] [PubMed]
[Crossref] [Google Scholar] [PubMed]
[Crossref] [Google Scholar] [PubMed]
[Crossref] [Google Scholar] [PubMed]
[Crossref] [Google Scholar] [PubMed]
[Crossref] [Google Scholar] [PubMed]
[Crossref] [Google Scholar] [PubMed]
[Crossref] [Google Scholar] [PubMed]
[Crossref] [Google Scholar] [PubMed]
[Crossref] [Google Scholar] [PubMed]
[Crossref] [Google Scholar] [PubMed]
[Crossref] [Google Scholar] [PubMed]
[Crossref] [Google Scholar] [PubMed]
[Crossref] [Google Scholar] [PubMed]
[Crossref] [Google Scholar] [PubMed]
[Crossref] [Google Scholar] [PubMed]
[Crossref] [Google Scholar] [PubMed]
Citation: Chhabra V (2024) Computational Profiling of Inflammatory and Coagulation Responses in COVID-19 via Ribonucleic Acid Sequencing (RNA-Seq). J Proteomics Bioinform. 17:662.
Received: 02-Feb-2024, Manuscript No. JPB-24-29474; Editor assigned: 05-Feb-2024, Pre QC No. JPB-24-29474 (PQ); Reviewed: 19-Feb-2024, QC No. JPB-24-29474; Revised: 26-Feb-2024, Manuscript No. JPB-24-29474 (R); Published: 04-Mar-2024 , DOI: 10.35248/0974-276X.24.17.662
Copyright: © 2024 Chhabra V. This is an open-access article distributed under the terms of the Creative Commons Attribution License, which permits unrestricted use, distribution and reproduction in any medium, provided the original author and source are credited.