Journal of Geography & Natural Disasters
Open Access
ISSN: 2167-0587
+44-77-2385-9429
ISSN: 2167-0587
+44-77-2385-9429
Research Article - (2024)Volume 14, Issue 2
In the urban and suburban areas of Lanzhou, a petrochemical industry city located in Northwest China, 99 Volatile Organic Compounds (VOCs) excluding aldehydes and ketones were measured using both PAMS and TO-15 methods between 2021 and 2022. The analysis of the collected data aimed to explore the seasonal trends in air pollution and its correlation with respiratory diseases in Lanzhou. The average annual concentrations of VOCs were found to be 121 ppbv for urban living areas, 165 ppbv for industrial areas, and 114 ppbv for background areas, with industrial areas exhibiting the highest concentration. These VOCs consist of various organic compounds, including alkanes, olefins, halogenated hydrocarbons, and aromatic hydrocarbons, which act as organic tracers of specific marker molecules or their sources. By employing principal component analysis and grouping the species using the maximum variance method, the VOC concentration levels were assessed across different regions. Subsequently, the associated changes were calculated based on the number of reported respiratory morbidity cases from public health hospitals in each region. The results suggest a correlation between VOC concentration levels and the onset of respiratory illnesses during the fall and winter seasons. Therefore, reducing VOC emissions during these months can effectively mitigate the public health risks associated with respiratory illnesses.
Relevance; Volatile organic compounds; Principal component analysis; Respiratory diseases
The emission of VOCs into the troposphere is a natural byproduct of human daily production and living activities [1]. Numerous VOCs have been identified as contributors to ozone formation, and the correlation between these airborne chemicals and disease has garnered increasing attention in recent years [2-7] The association between toxic chemicals and disease burden is a widely discussed topic in the medical field, although it lacks precise definition [8,9]. In China, surveillance activities related to VOCs have intensified in response to public concerns for public health safety [10-12]. The complex array of chemicals plays a crucial role in quantifying the relationship between environmental factors and human disease [13]. VOC data is dispersed across various scientific journals and reports, and the complexity of the mixture necessitates the ultratrace analysis of organic chemicals [14-16]. The intricacy of the air mixture and the sophistication required for ultratrace analysis of organic chemicals have posed challenges. However, there has been significant progress in analyzing airborne VOCs through pre-concentrators coupled with GC-MS, capable of capturing more than one hundred trace amounts of ozone-depleting substances, thus providing a reliable means for in-depth study and analysis of the association between airborne VOCs and disease [17-19]. In recent years, numerous researchers have conducted pioneering studies on the analysis of VOCs in ambient air [20,21].
The availability of a wide variety of VOC data necessitates more precise mathematical and statistical tools [22]. Principal Component Analysis (PCA) is highly valuable for data exploration due to its unsupervised nature and has been proven to be a powerful multivariate exploratory tool for processing and interpreting high-dimensional data in fields such as engineering, physical, and biological sciences [23-25]. PCA has been extensively applied to address various environmental problems, providing either a direct or an indirect solution [26]. Undoubtedly, PCA has emerged as one of the most popular multivariate tools [27]. It is beneficial for data exploration due to its capability to elucidate the latent structure of high-dimensional data without prior information about the data [28]. This is the first time that the applied strategies of PCA, including clustering, classification and identification, and discrimination/differentiation, have been utilized for the analysis and disease correlation of a large amount of VOC data. Statistical scoring of multiple VOC concentration data using PCA and then matching the scoring data with public health data yields credible results.
Sampling sites
Three sampling sites were established in distinct functional regions within the city, namely industrial areas, residential areas, and scenic spots. The VOC sampler was situated at the top of a building, approximately 20 meters above the ground level, as illustrated in Figure 1. The surrounding area of each sampling site was chosen to best represent the characteristics of its particular location. Samples were collected from a height of 2 meters above the rooftop. Clear differentiation of characteristic emission sources in each area was made to facilitate subsequent discussion.
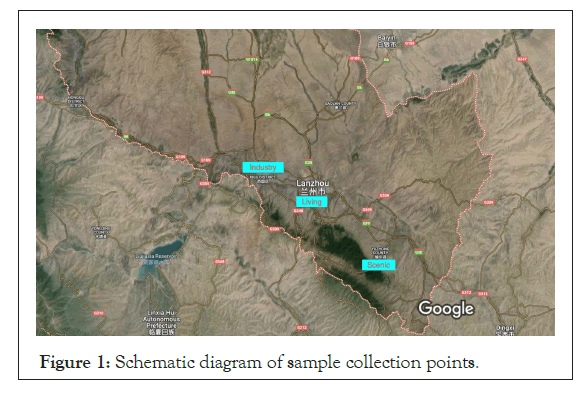
Figure 1: Schematic diagram of sample collection points.
Sample collection
VOC sampling tanks were installed at each site, which were salinized and inserted to collect ambient air samples for twelve hours of the daylight using an integral flow valve. A total of 339 samples were collected over the study period for a full year from spring 2021 to spring 2022.
Instruments and equipment
In this study, the atmospheric preconcentration system cooperate Agilent 7890A Gas chromatography and Agilent 5975C mass spectrometry is used. The system is equipped with Deans-Switch center cutting device, cold column oven and FID. The samples are preconcentrated by cold trap, water and inert gas are removed, and then separated by GC. The low carbon components are analyzed by HP Plot Q column and FID, others are observed by DB-1 and MS.
Gas Chromatography (GC) (Agilent 7890A, U.S.A) is given SSL injection port, FID detector, liquid nitrogen cooled column oven, Deans-Switch center cutting system and Pneumatic Control Modules (PCM). Mass Spectrometer (MS-5975C) also purchase from Agilent U.S.A. The volume of Summa canister (Entech, U.S.A) with inert inner wall is 3.2 L and the volume of Liquid nitrogen container (Lanzhou, China) is 200 L. 7200 atmospheric preconcentration, 3100A wash tank instrument, 4700 dynamic gas diluter and 7016D automatic sampler all were used, which are from Entech manufacturer, U.S.A.
Standards and reagents
Standards and reagents Calibrating gases including 57 PAMS (1 μmol/mol, 1 L), 65 TO15 (1 μmol/mol, 1 L), and the internal standard gas composition (1 μmol/mol, 1 L) containing Bromochloromethane, chlorobenzene-d5, and 1,2-Difluorobenzene were purchased from Linde Industrial Gases in Germany. Before usage, dilute the calibrating and internal standard gases to 5 nmol/mol with high-purity nitrogen (>99.999%). Their validity period is 30 days.
Instrument parameter
Agilent DB-1 (60 m × 0.25 mm × 1.0 µm) and Agilent HP-PLOT Q PT (30 m × 0.32 mm × 20 µm) belong to capillary column. The temperature of injector and FID is 250°C and the center cut time is 10.45 min. The carrier gas Helium (He) enters the column in a constant flow with the flow rates 1.0 mL/min for DB-1 and 2.3 mL/min for HP-PLOT Q. The flow rate of H2 is 35 mL/min, air is 400 mL/min and the tail gas N2 is 30 mL/min. Temperature program is adopted, -20°C, hold for 3 min, going up to 150°C at a speed of 5°C/min and hold for 5 min, then climbing to 220°C at a speed of 15°C/min and hold for 8 min. The MS ion source is inert Plus and its temperature is 250°C, SIM scanning mode is adopted. The temperature of the quadrupole and the transmission line are 150°C, 250°C respectively.
Data analysis and model development
For data analysis and model development, PCA was performed using SPSS version 20 to apportion sources of measured VOC constituents such as alkanes, PAHs, Halogenated hydrocarbons, Aromatics, and n-alkanoic acids. Varimax rotation was used to obtain principal components that indicate the association of each measured species with each factor.
Public health data collection
Respiratory case data was collected from respective regional public health data platforms, and Pearson correlation studies were conducted to assess the public health implications, using daily environmental surveillance data matched with eventmatched respiratory case data.
VOC analysis test results
Substantial differences in VOC concentration levels were observed across various urban functional areas. Annual average VOC levels were 121 ppbv in residential areas, 165 ppbv in industrial areas, and 114 ppbv in background areas, with industrial areas exhibiting the highest annual average concentrations. The proportions of VOC components also varied between different areas, reflecting their respective characteristics. Significant variations in compound composition were noted among scenic, industrial, and residential areas. Figure 2 details the year-round composition of VOCs in different regions and their comparative results. Throughout the entire sampling period, alkanes and halogenated compounds were the most abundant chemical groups, each accounting for an average of 45.1% and 16.8%, respectively, while alkenes (11.3%), aromatics (9.0%), and other compounds followed. Alkanes were the predominant VOC component in all three specific areas, accompanied by alkenes and aromatics the two other major components. As shown in Figure 3, VOC types varied significantly by season, both in terms of concentration and composition. Table 1 illustrates the top ten VOC categories in the different regions. Ethane, propane, n-butane, isobutane, n-pentane, and isopentane are the most abundant alkane species. Among them, ethane is the main component of natural gas, while propane, n-butane, and isobutane are important tracers of LPG [29]. Aromatic VOCs such as benzene, toluene, and xylene mainly originate from solvent emissions and industrial processes. Dichloromethane is the most abundant of the halogenated hydrocarbons and is an important substance in solvent use.
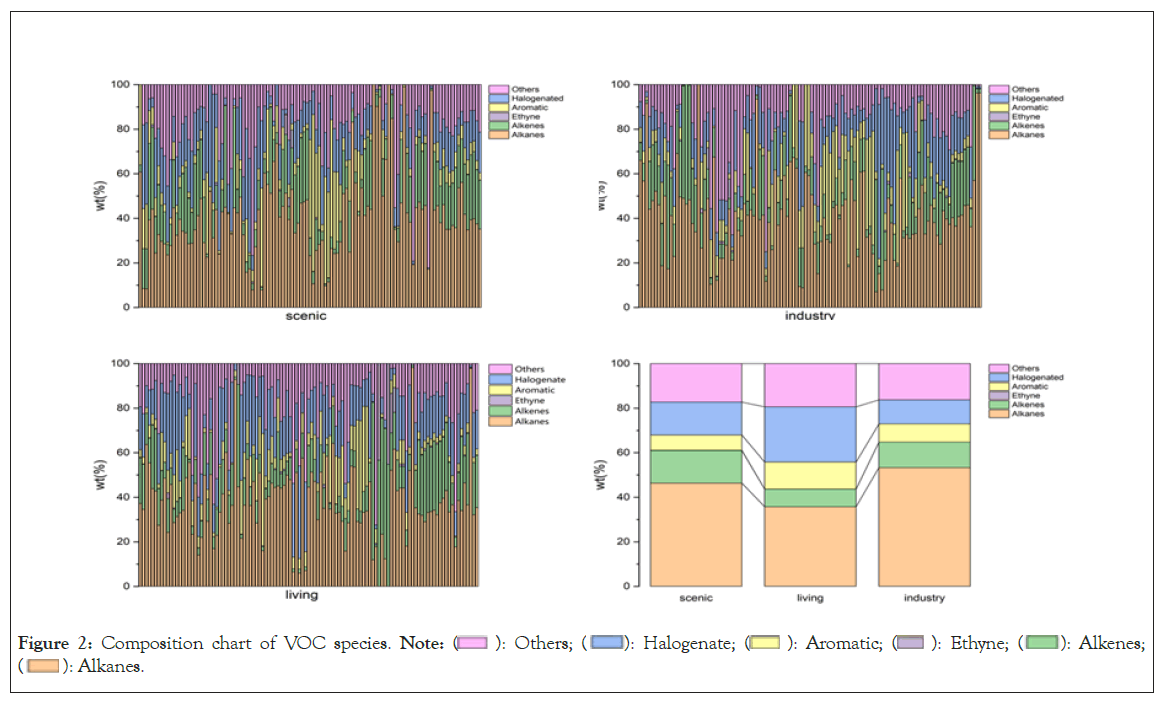
Figure 2: Composition chart of VOC species. 

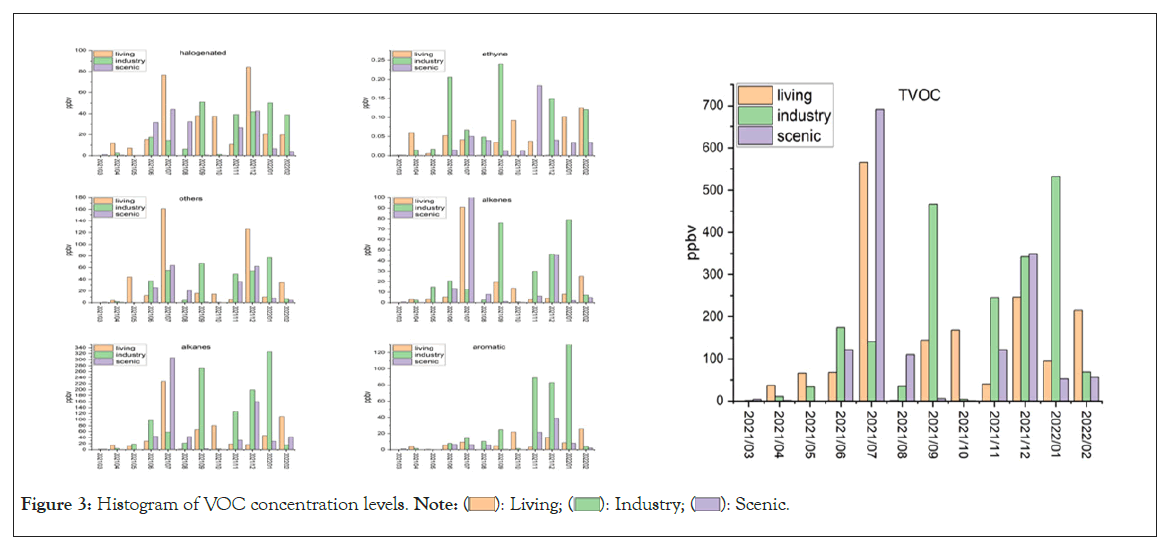
Figure 3: Histogram of VOC concentration levels. 
| Living | Industry | Scenic | |||
|---|---|---|---|---|---|
| Species | Average | Species | Average | Species | Average |
| Dichloromethane | 11.3 | Isopentane | 17.4 | 3-Methylpentane | 11.3 |
| Isopentane | 10.3 | n-butane | 14 | Butane | 6.54 |
| n-butane | 9.72 | Benzene | 11.1 | Isopentane | 5.66 |
| Methyl tertbutyl ether | 5.71 | Ethyl acetate | 8.76 | 2-Methylheptane | 4.78 |
| Methyl chloride | 4.95 | n-hexane | 7.97 | n-hexane | 3.8 |
| vinyl acetate | 4.88 | Toluene | 7.9 | Ethyl acetate | 3.48 |
| 2-Methylpentane | 4.4 | Isobutane | 6.04 | Chloromethane | 3.06 |
| 1-Hexene | 4.26 | n-pentane | 6.03 | Benzene | 3.05 |
| n-pentane | 4.18 | Dichloromethane | 5.18 | Cyclohexane | 3.01 |
| n-hexane | 3.69 | Hexene | 4.61 | Isopropyl alcohol | 2.99 |
Table 1: The top ten compounds of VOC emissions in different regions.
Chloromethane also ranks prominently, mainly originating from the effects of biomass combustion, such as winter heating and cooking [30]. Additionally, acetylene provides insight into incomplete combustion in the atmosphere. Overall, propane, C2-C6 alkanes, ethylene, benzene, and toluene are typical vehicle exhaust markers [31,32]. Vehicle exhaust is therefore a significant source of VOCs in the region. Finally, it is important to note that methylene chloride, xylene, toluene, 1,2-dichloropropane, benzene, and chloromethane are toxic compounds and can pose a public health risk.
Results of principal component analysis
PCA was applied to the combined concentration data of 99 PAMs TO-15 VOCs, excluding aldehydes and ketones, and the Principal Components (PCs) were extracted, with the component loadings shown in Table 2. The number of principal components to be retained was determined by examining the scree plot and variance explained by the PCAs. Components with an Eigenvalue greater than one were considered for further analysis of source identification. The variance explained by the components after PC15 is insufficient to extract interpretable information. The VOCs in the three regions were attributed to fifteen principal component factors. These fifteen principal component factors could explain 92% of the components in industrial areas, 93% in living areas, and 88.3% in scenic areas. However, the general interpretation of eigenvalues ≤ 2 is not significant. The relative relationship between the principal factors and VOC species was attributed to the top five categories of principal components and their main contributions: short-chain alkanes, halogenated hydrocarbons, olefins, aromatic hydrocarbons, and long-chain alkanes.
| Living | Industry | Scenic | |||||||
|---|---|---|---|---|---|---|---|---|---|
| Initial eigenvalues | Initial eigenvalues | Initial eigenvalues | |||||||
| Total | % of variance | Cumulative % | Total | % of variance | Cumulative % | Total | % of Variance | Cumulative % | |
| FACT 1 | 27.325 | 27.054 | 27.054 | 33.019 | 32.692 | 32.692 | 34.533 | 34.191 | 34.191 |
| FACT 2 | 17.896 | 17.719 | 44.773 | 17.201 | 17.031 | 49.723 | 12.835 | 12.708 | 46.899 |
| FACT 3 | 10.382 | 10.279 | 55.052 | 11.254 | 11.142 | 60.866 | 7.542 | 7.468 | 54.367 |
| FACT 4 | 9.505 | 9.411 | 64.463 | 7.079 | 7.008 | 67.874 | 5.996 | 5.936 | 60.303 |
| FACT 5 | 6.523 | 6.458 | 70.922 | 5.107 | 5.057 | 72.931 | 4.778 | 4.731 | 65.034 |
| FACT 6 | 5.695 | 5.639 | 76.56 | 3.586 | 3.551 | 76.481 | 4.065 | 4.025 | 69.059 |
| FACT 7 | 3.683 | 3.647 | 80.207 | 3.048 | 3.018 | 79.5 | 3.587 | 3.552 | 72.611 |
| FACT 8 | 2.303 | 2.28 | 82.488 | 2.281 | 2.258 | 81.758 | 2.814 | 2.786 | 75.397 |
| FACT 9 | 2.148 | 2.127 | 84.614 | 2.029 | 2.009 | 83.767 | 2.602 | 2.576 | 77.973 |
| FACT 10 | 2.041 | 2.021 | 86.635 | 1.746 | 1.729 | 85.496 | 2.331 | 2.308 | 80.28 |
| FACT 11 | 1.694 | 1.677 | 88.312 | 1.69 | 1.673 | 87.169 | 2.014 | 1.994 | 82.274 |
| FACT 12 | 1.326 | 1.313 | 89.625 | 1.649 | 1.632 | 88.801 | 1.765 | 1.747 | 84.021 |
| FACT 13 | 1.263 | 1.251 | 90.876 | 1.314 | 1.301 | 90.102 | 1.633 | 1.617 | 85.638 |
| FACT 14 | 1.135 | 1.124 | 92 | 1.158 | 1.146 | 91.248 | 1.471 | 1.456 | 87.094 |
| FACT 15 | 1.019 | 1.009 | 93.009 | 1.015 | 1.005 | 92.254 | 1.287 | 1.275 | 88.369 |
Table 2: PCA principal component accumulation variance and eigenvalues.
In the living district, the main components with a significant contribution ratio include toluene, chlorobenzene, xylene, 2,3-dimethylpentane, 2-methylhexane, etc. The main component two contributes significantly to 2-butene, 1-butene, pentene, carbon tetrachloride, tetrachloroethylene, etc. Main component three contributes significantly to monobromomethane, chloroethane, dichloromethane, methyl tert-butyl ether, etc. The major component four contributes significantly to isopropylbenzene, trimethylbenzene, di-ethylbenzene, etc. The main component five contributes significantly to n-decane, undecane, etc. Therefore, the main sources of pollution in the living district are solvents and traffic emissions.
In the industry district, the main component one contributes significantly to chloromethane, n-butane, isopentane, methyl tert-butyl ether, etc. Main component two contributes significantly to methylhexane, trichloroethane, chlorobenzene, ethylbenzene, xylene, etc. Main component three contributes significantly to n-decane, n-undecane, n-dodecane, isopropylbenzene, diethylbenzene, etc. The major component four contributes significantly to trichloromethane, dichloroethylene, dichlorobenzene, etc. The major component five contributes significantly to ethylene, propylene, butylene, etc. Therefore, the main emission sources in the Industry District are solvent emissions and petrochemical industry emissions.
In the Scenic district, the major component I contributes significantly to dimethylpentane, isopropylbenzene, diethylbenzene, dichlorobenzene, etc. Main component two contributes significantly to butane, vinyl chloride, pentene, pentane, etc. The major component three contributes significantly to methyl pentane, octane, xylene, toluene, etc. The major component four contributes significantly to ethane, propylene, ethylene, etc. Major component five contributes significantly to cyclohexane, carbon tetrachloride, n-undecane, n-dodecane, etc. Therefore, the main sources of pollution in the Scenic District are biomass combustion and traffic emissions.
The principal component factors with variance greater than 1.00 in the PCA results were collected and scored together using the Formula 1. The monthly averages of the principal component analysis scores are detailed in Figure 4. The composite scores were applied to respiratory cases for correlation studies.
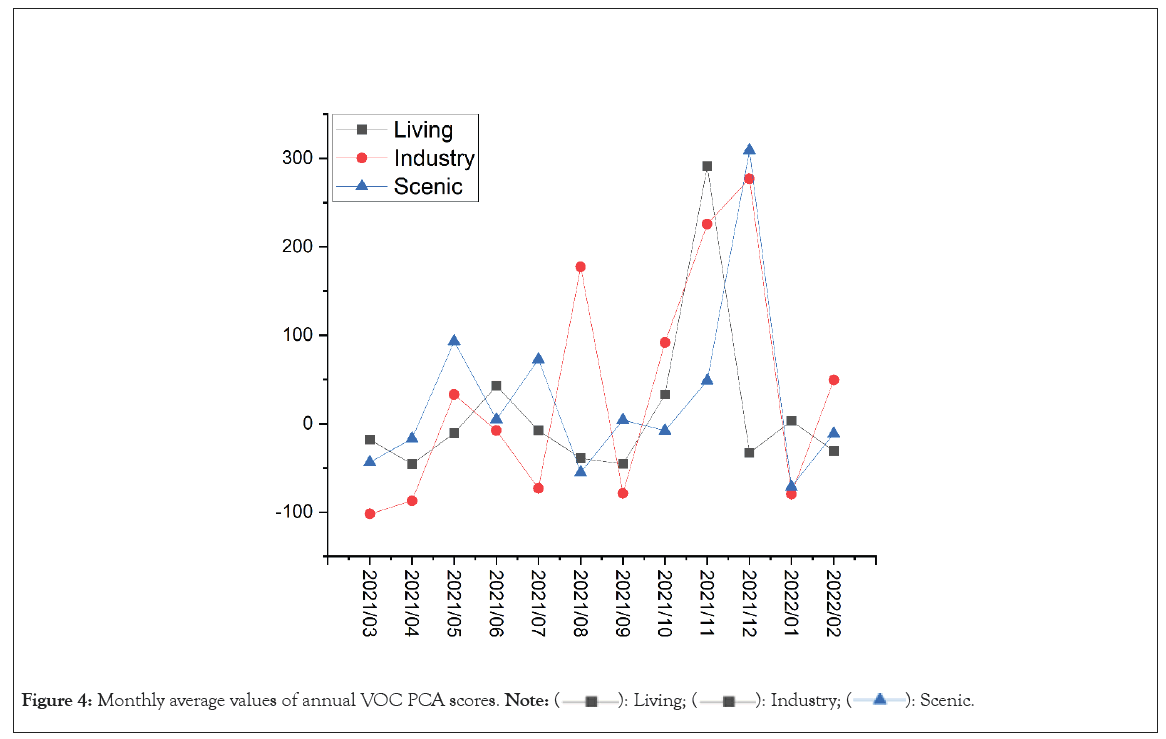
Figure 4: Monthly average values of annual VOC PCA scores. 


y: Scoring of principal components; F: Principal component factors; λ: Eigenvalues of principal components; S (%): Variance of principal components.
Description of public health respiratory diseases
Table 3 presents the descriptive statistics of the number of respiratory disease visits in the Living, Industry, and Scenic areas of Lanzhou City from March 2021 to June 2022. It is evident from the table that the Living area had the highest number of visits during the observation period, with 6325 cases, averaging about 16 visits per day. This was followed by the Industry area with 3962 cases, averaging 10 visits per day, and the Scenic area with the lowest number of visits, 2988 cases, averaging about 8 cases per day. These numbers are influenced by the population base and the number of health institutions in each functional area.
| Living | Industry | Scenic | |||||
|---|---|---|---|---|---|---|---|
| Case | Proportion | Case | Proportion | Case | Proportion | ||
| Disease type | Respiratory infections | 4745 | 75 | 2741 | 69.2 | 2514 | 84.1 |
| Pneumonia | 1359 | 21.5 | 1164 | 29.4 | 464 | 15.5 | |
| COPD | 220 | 3.5 | 57 | 1.4 | 10 | 0.3 | |
| Gender | Female | 3069 | 48.8 | 1781 | 45 | 1422 | 47.6 |
| Male | 3255 | 51.5 | 2181 | 55 | 1566 | 52.4 | |
| Age | <10 | 3165 | 50 | 1706 | 43.1 | 1123 | 37.6 |
| 11~60 | 2573 | 40.7 | 1647 | 41.6 | 1602 | 53.6 | |
| >60 | 586 | 9.3 | 608 | 15.3 | 263 | 8.8 | |
Table 3: Statistical description of respiratory disease.
The monthly number of cases of respiratory diseases in different regions is depicted in Figure 5. Among the selected types of respiratory diseases, the highest number and proportion of people suffering from respiratory infections were observed, followed by pneumonia, with the lowest number and proportion of people suffering from chronic obstructive pulmonary disease.
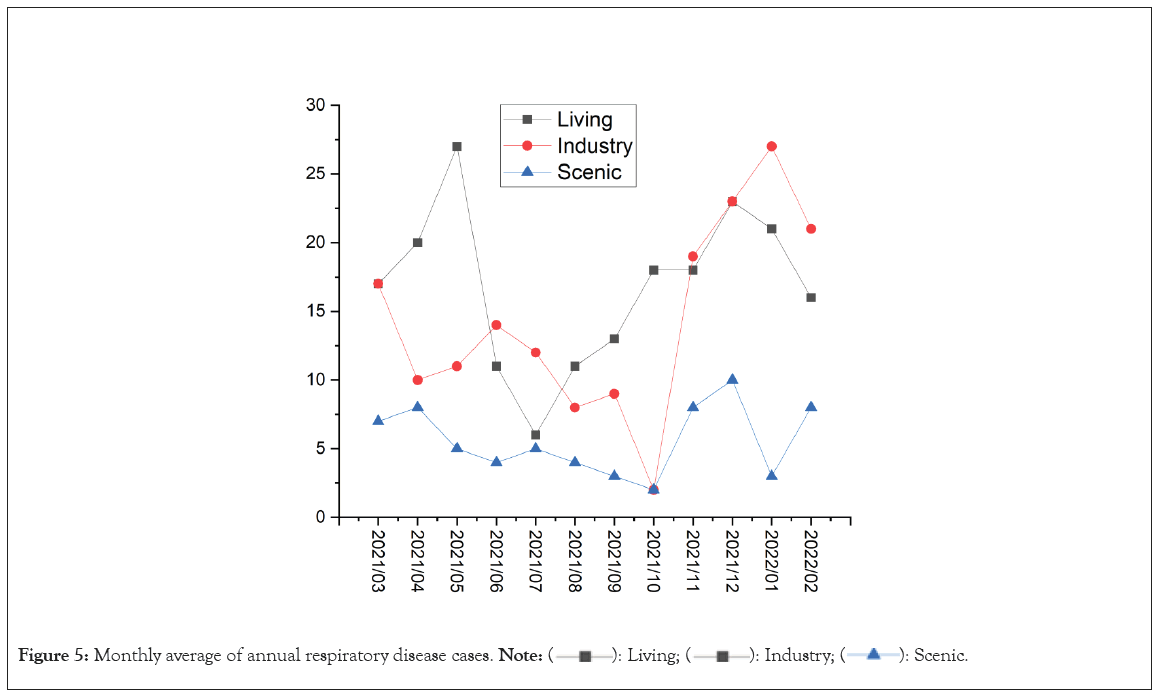
Figure 5: Monthly average of annual respiratory disease cases. 
In the spatial regional comparative analysis, the proportion of people suffering from respiratory infections was highest in the Scenic area (84.1%), followed by the Living area (75.0%) and then the Industry area (69.2%). The proportion of people suffering from pneumonia was highest in the Industry area (29.4%), followed by the Living area (21.5%), and then the Scenic area (15.5%). The proportion of people suffering from chronic obstructive pulmonary disease was highest in the Living area (3.5%), followed by the Industry area (1.4%), and then the Scenic area (0.3%).
When the data were tabulated according to gender, the proportion of male patients was generally 3.0 to 10.0% higher than that of female patients. When patients were grouped by age, it was found that the number of visits was higher among young children (<10 years old) and middle-aged and young adults (11-60 years old), with the proportion of elderly people (>60 years old) being relatively small. The Living area had a high number of visits in the <10 years old age group, accounting for 50.0% of admissions, which was about 10.0% higher than the 11-60 years old group and 5.4 times the number of visits in the >60 years old group, whose proportion was only 9.3%. The Industry area showed a gradual narrowing gap between the proportion of admissions in the young children group and the middle-aged and young adults group, with the old people group having the largest number of visits and proportion among the three regions. In the Scenic area, the proportion of the young and middle-aged group was the highest, followed by the young children group, with the elderly group having the least number of visits and proportion.
Correlation outcomes
Respiratory case data was extracted from urban hospitals in the vicinity of the VOC test date for the correlation analysis, and the results are shown in Table 4. The VOC composite score was linearly fitted to the number of cases to calculate the correlation coefficient. The Pearson correlation results are displayed in Table 4. The correlation coefficients for all three regions were greater than 0.7 in winter and between 0.2 to 0.6 in summer. Overall, a strong correlation was observed between VOC concentrations and the incidence of respiratory diseases during the fall and winter seasons. In contrast, the correlation between the two is weak in summer. The case data indicates that respiratory morbidity is not high in summer and is not statistically representative. From an atmospheric environment perspective, the high temperature in summer increases the volatility of various substances, leading to a significant increase in the complexity of volatile species, which may explain the weakened correlation in summer.
| Living | Scenic | Industry | |
|---|---|---|---|
| 21-Mar | 0.24 | 0.43 | 0.4 |
| 21-Apr | 0.66 | 0.45 | 0.22 |
| 21-May | 0.7 | 0.47 | 0.6 |
| 21-Jun | 0.55 | 0.42 | -0.06 |
| 21-Jul | 0.56 | 0.51 | 0.7 |
| 21-Aug | 0.38 | 0.3 | 0.19 |
| 21-Sep | 0.61 | 0.55 | 0.38 |
| 21-Oct | 0.67 | 0.67 | 0.72 |
| 21-Nov | 0.86 | 0.75 | 0.53 |
| 21-Dec | 0.67 | 0.74 | 0.84 |
| 22-Jan | 0.81 | 0.91 | 0.98 |
| 22-Feb | 0.74 | 0.88 | 0.66 |
Table 4: List of Pearson correlation coefficients.
This study presents an analysis of ninety-nine VOCs, including short-chain alkanes, long-chain alkanes, alkenes, aromatic hydrocarbons, halogenated hydrocarbons, and others, collected at three sampling sites in Living, Industrial, and Scenic areas over a city in Northwest China throughout a year from March 2021 to February 2022. The highest annual mean values were identified at sites in industrial areas (163 ppbv), while the lowest was observed in scenic areas (114 ppbv). Alkanes and halogenated hydrocarbons were the most abundant chemical groups, accounting for an average of 45.1% and 16.8% of the total VOC, respectively, followed by alkenes (11.3%), aromatics (9.0%), and other compounds.
Through PCA clustering analysis, differences in VOC emission sources in the three regions were identified: Solvent and traffic emissions were identified as the primary sources of pollution in the living areas, while solvent emissions and petrochemical industry emissions caused the highest levels of emissions in the industrial areas. Additionally, biomass combustion and traffic emissions were identified as the main sources of pollution in the scenic areas. The combined scores obtained from principal component analysis showed a significant difference in concentration levels between VOCs in different seasons and respiratory diseases in the area. Associations between VOC concentration levels and respiratory diseases in the region were observed in different seasons, with a correlation between respiratory disease incidence and concentration levels in the fall and winter. As a result, reducing fall and winter VOC emissions may help improve winter respiratory health conditions.
The authors would like to thank the Gansu Provincial Environmental Monitoring Centre for supporting this work. The support of the Gansu Provincial Department of Science and Technology is also gratefully acknowledged Natural Science Foundation of Gansu Province, China (Grant No. 20JR5RA125). The authors are very grateful to the reviewers for their critical review of the paper.
Competing interests
The authors declare no conflict of interest.
Authors’ contribution
Lu Chang designed the research idea, performed most of the experiments, and wrote the majority of the manuscript. Our co-authors also made significant contributions to this work. Xia Wang helped with designing part of the experiments and provided insightful suggestions during manuscript writing and Haixia Ding analyzed some experimental data and revised the manuscript. Yian Zhou conducted some preliminary experiments and collected part of the data. All authors read the final manuscript, provided feedback, and approved it for submission.
Funding
This research was supported by the Natural Science Foundation of Gansu Province, China (Grant No. 20JR5RA125).
Data availability
The datasets used and analyzed during the current study are available from the corresponding author on reasonable request.
Informed consent
Informed consent was obtained from all participants included in the study.
All authors have read, understood, and have complied as applicable with the statement on “Ethical responsibilities of Authors” as found in the Instructions for Authors”.
[Crossref] [Google Scholar]
Citation: Lu C, Xia W, Haixia D, Yian Z (2024) Concentration Levels of VOCs in Ambient Air and Health Assessment of Respiratory Diseases in Petrochemical Cities in Western China. J Geogr Nat Disasters. 14:305.
Received: 18-Mar-2024, Manuscript No. JGND-24-30239 ; Editor assigned: 21-Mar-2024, Pre QC No. JGND-24-30239 (PQ); Reviewed: 05-Apr-2024, QC No. JGND-24-30239 ; Revised: 12-Apr-2024, Manuscript No. JGND-24-30239 (R); Published: 19-Apr-2024 , DOI: 10.35841/2167-0587.24.14.305
Copyright: © 2024 Lu C, et al. This is an open-access article distributed under the terms of the Creative Commons Attribution License, which permits unrestricted use, distribution, and reproduction in any medium, provided the original author and source are credited.