Medical & Surgical Urology
Open Access
ISSN: 2168-9857
ISSN: 2168-9857
Research Article - (2020)Volume 9, Issue 2
Objective: Bladder carcinoma is one of the most common tumors in the world and, despite the therapy currently available, most of the patients relapse. MicroRNA- 100 is down regulated in bladder cancer tissue in comparison to normal tissue; however, clinical significance of miR-100 in human bladder cancer has not been elucidated. The aim of study was to correlate miR 100 expression levels with tumor grade, stage and recurrence.
Methods: Expression of miR-100 in 26 pairs of bladder cancer and adjacent normal tissues were analysed by Sybergreen RT-PCR. The expression levels of miR 100 in tumor and normal were normalised with 18s gene. The expression levels of miR 100 expression were analysed in fold change (DDCT method). The difference between groups were analysed by student t test and Anova.
Results: Downregulation of miR-100 expression in tumor was an important finding in our study. MiR-100 expression were decreased (n=24) in tumour tissue in comparison with normal bladder urothelium. Mean expression of miR-100(fold change) was 0.33 ± 0.35 and significantly decreased on comparison to normal (p=0.001). There is no correlation of miR-100 expression levels with gender and age (p=0.583). Mean expression of miR-100 in low grade was 0.41 ± 0.38 whereas in high grade 0.22 ± 0.26 (p=0.182). Ta tumors had mean (fold change) 0.42 ± 0.39, T1 had mean value of 0.25 ± 0.30 and T 2 had mean value of 0.24 ± 0.30.(p=0.463) miR-100 expression levels were decreased in MIBC(T2) more than NMIBC (Ta,T1) (p=0.473).Mean levels 2^-DDCT (fold change) in recurrent tumors were 0.16 ± 0.19 whereas fold change in nonrecurring tumors was 0.40 ± 0.38.(p=0.045) 1 patient with T2 tumor underwent progression with all patients surviving till end of study.
Conclusions: miR-100 expression is down regulated in Bladder cancer tissue than normal bladder urothelium. The miR-100 expression levels were decreased in all bladder tumors however reaching significance in recurrent bladder tumor, suggesting use of miR 100 as potential marker for further risk stratification and prognosis in treatment of urinary bladder cancer.
Carcinoma urinary bladder; High grade; Micro RNA; miR 100
Bladder cancer (BC) is 11th most common cancer in the world and 7th common cancer among males [1]. Urothelial cancer is reported to be the most common cancer in the genitourinary tract and second common cancer leading to death [2,3]. Low grade tumors are generally papillary and multifocal, often recurrent, with infrequent progression and good prognosis. The high grade tumours especially muscle invasive tumors are often solid, nodular, with broad base and metastasize during the initial phases, and hence have a poor prognosis. The challenges in the management of bladder cancers are prevention, early detection of recurrence and progression. Tumor grading and staging of bladder cancer are the best indicators used to foretell recurrence and progression of bladder cancer. There is also a need for molecular marker that could predict recurrence, progression of disease and estimation of survival [4,5].
MicroRNAs (miRNAs) are small, single-stranded, non-coding RNAs of 22-25 nucleotides, which are highly conserved between species. They control the expression of genes by inhibition of target mRNA translation. miR-100 is one of oldest miRNA known in plants and animals however its significance is not established. Dysregulated expression of miR-100 has been found in various types of cancers including bladder cancer. miR-100 can act as either an oncogene or a tumor suppressor in different cancers. Several studies have shown miR 100 as a potential diagnostic, prognostic marker in body fluids and tissue samples in several cancers including bladder cancer [6].
Twenty six patients with documented bladder transitional carcinoma were included in this study. The tumor tissue and histologically proven normal bladder tissue (3cm away from tumor), which served as control were segregated for each patient and 26 such pairs of tissue were made. Patients, who presented with haematuria or dysuria, underwent standard evaluation by history, physical examination and basic investigations. Those who were found to have bladder lesions suggestive of tumour on ultrasonography were explained in detail about the study protocol and an informed consent was obtained. Patients with documented urinary bladder mass underwent TURBT. After TURBT, those patients diagnosed with muscle invasive bladder cancer underwent metastatic work up which includes CECT abdomen and pelvis, LFT, Chest X-ray / CT Chest, and bone scan. Patients with proven muscle invasive bladder cancer by prior TURBT underwent radical cystectomy. Tissue samples following surgery (radical cystectomy/TURBT/TUR Biopsy) and adjacent normal bladder tissue (more than 3 cm away from bladder tumor) were subjected for histopathology and quantification of miR 100 (Methodology as detailed below). Samples were sent in numerical code to the evaluator. The expression level of miR 100 levels was correlated with histopathology (Grading, Stage) of the tumor.
Total RNA was isolated from frozen specimens by homogenizing the tissue in TRIzol reagent. MicroRNA from tissue was extracted using miRNeasy mini kit. The quantity and purity of RNA were calculated by taking the absorbance of the samples at 260 and 280 nm (ratio at 260/280 >1.8) using UV spectrophotometer (Model- DU 640, Beckman Coulter, USA). cDNA was prepared from RNA using miScript II kit (Qiagen) according to the manufacturer instructions.
Real time PCR was performed using the Applied Biosystems 7500 Fast real-time PCR system and SYBR Green PCR Master Mix reagent (Applied Biosystems, Germany) using gene specific primers. The 18S rRNA gene was used as an internal control for normalization of gene expression.
miR-100 expression levels were normalized to 18s for each sample and calculated relative to normal healthy subject tumor (Normal control) using the following equation:
Relative expression = 2-(SampleΔCt-ControlΔCt), Where ΔCt = average Ct (miR 100)-average Ct (18s)
The quality of PCR products was checked by agarbose gel electrophoresis.
Statistical analysis
Values of miR-100 were expressed in mean ± SD. The results were statistically evaluated using SPSS program (version 20.0; SPSS inc., software). The change in miR 100 expression levels between normal and tumor tissue of urinary bladder were assessed by one sample t test while independent t test was used for correlation between tumor staging and grading. Paired t-test, Z- proportion method for difference, and Chi-square test were applied for parametric, non-parametric and categorical variables respectively. P-value < 0.05 was considered significant.
Clincopathological parameters in study
Age of the patients ranged from 45 to 82 years with mean age of 63.19 ± 10.20 years. Most of the patients (n=8) belonged to 61-70 years (7th decade).The mean follow up of patients in our study was 11.46 ± 1.90 months ranging from 7-15 months.
23 patients (88.5%) underwent TURBT whereas 3 (11.5%) patients underwent Radical cystectomy initially. Comorbidities were common in our patients. The most common were HTN, CAD, CVA, CKD and hypothyroidism. Most common symptom in our study was haematuria (n=25) followed by dysuria (n=5) (Table 1).
Table 1: Clinicopathological parameters.
| Characteristics | Variable | Number of patients (%) |
|---|---|---|
| Total patients | 26 | |
| Age | Less than 65 | 16 |
| More than 65 | 10 | |
| Gender | Male/Female | 23/3 |
| Co-morbidities | present | 12 |
| absent | 14 | |
| Smoking habits | Smoker | 20(76.9%) |
| Non-smoker | 6 | |
| Haematuria | present | 25 |
| absent | 1 | |
| Location of tumor | Lateral wall | 13(50%) |
| Posterior wall | 5(19.2%) | |
| Post. Lateral wall | 6(23%) | |
| Trigone | 1(2.3%) | |
| Ant,Post,lateral | 1(2.3% | |
| Tumor number | Single | 15 |
| multiple | 11 | |
| Grading of tumor | High grade | 11 |
| Low grade | 15 | |
| TNM Stage | Ta | 12 |
| T1 | 7 | |
| T2 | 7 | |
| N0 | 3 | |
| Recurrence | yes | 8 |
| no | 18 | |
| Progression | Yes | 1 |
| no | 25 | |
| Survival | Yes | 26 |
On analysis of expression levels of miR 100 in tissue, 24 patients had low expression of miR 100 and 2 patients had high expression in comparison to normal tissue. Mean expression levels (fold change of miR-100) was 0.33 ± 0.35 on comparison to normal was significant (one sample t test p=0.001) (Figure 1).
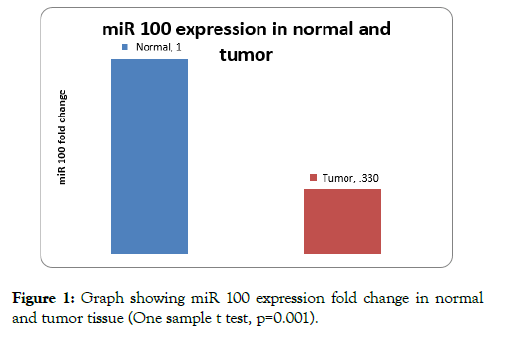
Figure 1: Graph showing miR 100 expression fold change in normal and tumor tissue (One sample t test, p=0.001).
Mean expression of miR-100 in low grade was 0.41 ± 0.58 whereas in high grade 0.22 ± 0.26 (p=0.182) (Figure 2). The miR-100 expression (fold change) was more downregulated in high grade tumors compared to low grade bladder tumors.
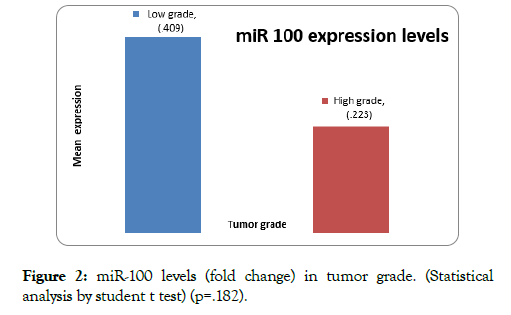
Figure 2: miR-100 levels (fold change) in tumor grade. (Statistical analysis by student t test) (p=.182).
miR-100 expression levels (fold change) were found to decreased in all tumor stages (Ta, T1 and T2). On analysing expression levels of miR 100 against staging, Ta tumors had mean 2^- DDCT (fold change) 0.42 ± 0.39, T1 had mean value of 0.25 ± 0.30 and T 2 had mean value of 0.24 ± 0.30. On comparison of mean of Ta, T1 and T2 by (anova statistical method); the difference was not significant (p=0.463) (Table 2).
Table 2: Mean expression of miR-100 (Stage).
| Tumor staging | N | Mean | Std. Deviation | p value | ||
|---|---|---|---|---|---|---|
| 2^-DDCT | T1 | 7 | .2522 | .30646 | 0.463 | |
| T2 | 7 | .2476 | .30015 | |||
| Ta | 12 | .4239 | .39552 | |||
| Total | 26 | .3302 | .34760 | |||
miR-100 expression levels (fold change) were found to decreased (compared to normal) in MIBC (T2), moreover the under expression was more in T2 tumors than Ta and T1; however the difference is not significant. (p=0.453) (Figure 3).
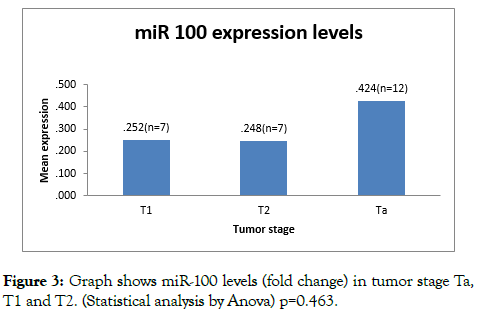
Figure 3: Graph shows miR-100 levels (fold change) in tumor stage Ta, T1 and T2. (Statistical analysis by Anova) p=0.463.
On analysing miR-100 expression levels in MIBC (T2), the under expression is more in T2 tumors than Ta and T1; however the difference is not significant (p=0.453) (Figure 4).
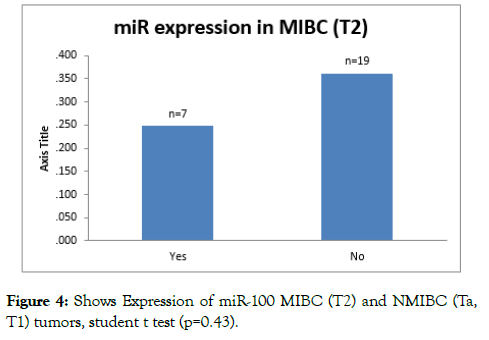
Figure 4: Shows Expression of miR-100 MIBC (T2) and NMIBC (Ta, T1) tumors, student t test (p=0.43).
Eight patients had recurrence within follow up of patients. Mean levels 2^-DDCT (fold change) in recurrent tumors were 0.16 ± 0.19 whereas fold change in nonrecurring tumors was 0.40 ± 0.38. On analysis with student t test, difference between mean was significant (p=0.045) (Table 3 and Figure 5).
Table 3: Mean expression in recurrent tumors.
| RECCURENCE | N | Mean | Std. Deviation | t -value | p-value | |
|---|---|---|---|---|---|---|
| 2^-DDCT | Yes | 8 | .164 | .197 | 2.116 | .045 |
| No | 18 | .404 | .378 | |||
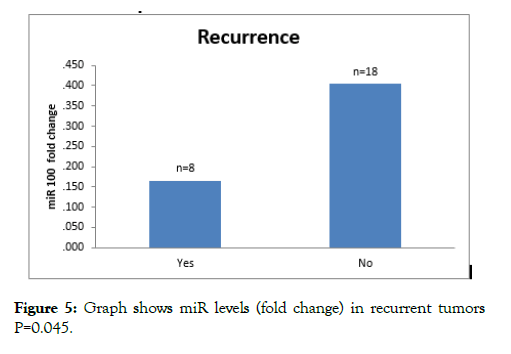
Figure 5: Graph shows miR levels (fold change) in recurrent tumors P=0.045.
Mean of expression levels of miR were obtained and patients were divided into low and high expression groups. Bladder cancer tissues expressing miR-100 at levels less than the mean expression level (2DDCT=0.354) were assigned to the low expression group, and those samples with expression above the mean value were assigned to the high expression group (Table 4).
Table 4: Mean expression of miR-100 (Stage, grade, recurrence).
| Parameters | Subgrouping of expression of miR-100 | Z-proportion | p-value | |||
|---|---|---|---|---|---|---|
| Low | High | Total | ||||
| Stage | T1 | 5 (71.4%) | 2 (28.6%) | 7 | 1.77 | 0.286 |
| T2 | 5 (71.4%) | 2 (28.6%) | 7 | 1.77 | 0.286 | |
| Ta | 7 (58.3%) | 5 (41.7%) | 12 | 0.83 | 0.408 | |
| Grade | Low | 9 (60.0%) | 6 (40.0%) | 15 | 1.12 | 0.264 |
| High | 8 (72.7%) | 3 (27.3%) | 11 | 2.39 | .017* | |
| Recurrence | Yes | 7 (87.5%) | 1 (12.5%) | 8 | 3.82 | .029* |
| Progression | Yes | 1 (100.0%) | 0 (0.0%) | 1 | ||
Progression and survival only one patient had progression during the study, patient developed liver metastasis after radical cystectomy. All patients survived till the conclusion of study.
MicroRNAs are recent biomarkers which are found to have role in many cancers including bladder cancer. Some of miR may have role in diagnosis, predicting recurrence, predicting prognosis and in treatment [7,8].
Aberrant expression of miR-100 is associated with tumorigenesis and tumor progression as shown in some studies. miR-100 act as oncogene or a tumor suppressor gene, depending on the tumor type examined. miR-100 is downregulated in nasopharyngeal cancer, oral squamous cell carcinoma, ovarian cancer, hepatocellular carcinoma hepatoblastoma and bladder cancer, whereas its upregulation has been described in acute myeloid leukemia, medulloblastomas, gastric cancer, pancreatic cancer and prostate cancer [9-13].
Our study of miR-100 was based on the fact that miR-100 is one of the oldest animal miR but not having clear role in bladder cancer.
The mean expression levels (2-DDCT Fold change) of miR-100 had no correlation with age and gender. Likewise previous studies show no correlation of miR-100 with age and gender. Twenty four had low expression of miR 100 and 2 patients had high expression in comparison to normal tissue. Mean expression levels (fold change of miR-100) was 0.33 ± 0.35 on comparison to normal (one sample t test p=0.001).
Many studies by Wang, et al., Cao, et al., Xu, et al. correlated the miR 100 expression in bladder cancer with tumor grade, stage, prognosis and survival.
Eight patients had recurrence within follow up of patients. Mean miR-100 expression levels (fold change) in tumors developing recurrence were 0.16 ± 0.19 whereas expression levels in tumors not developing recurrence was 0.40 ± 0.38. On analysis with student t test, difference between mean miR-100 expressions was significant. (p=0.045) The recurrence was mainly in T1 (5 patients), Ta (2 patients) and T2 (1 patient). The miR-100 downregulation was more in MIBC tumors compared to NMIBC. On sub group analysis more proportion of tumors developing recurrence fall in miR-100 expression levels less than mean. On comparison with tumors not developing recurrence the result were significant (z score=3.82, p=0.029).
Wang, et al. included 126 patients of which 90 patients underwent TURBT, 15 patients underwent partial cystectomy and 21 patients underwent Radical cystectomy. They found significant downregulation of miR-100 in bladder tumor compared to normal urothelium (p=0.001). Low miR-100 expression was noticed more commonly in high tumor stage, high grade tumors and recurrent bladder tumors [14].
Cao, et al. included 92 patients out of which 39 underwent TURBT, 27 underwent partial cystectomy and 26 underwent radical cystectomy. The miR 100 expression was decreased in high versus low tumor stage (P=0.023) and high versus low tumor grade (P=0.031). They found insignificant decrease in miR-100 expression in recurrent urinary bladder tumors. Our study showed more proportion of patients had miR expression less than mean in high grade and recurrent urinary bladder tumors [15].
Olivera, et al. found that forced expression of miR 100 in bladder tumor cell line inhibited the proliferation and colony formation. This provided the evidence that miR 100 may acted as tumor suppressor in bladder cancer [16].
Xu, et al. initially conducted study on 10 pairs of bladder tumor and adjacent noncancerous tissue and found miR-100 was down regulated in NMIBC and MIBC. On basis on these results they studied effect of miR-100 on cell growth, cell cycle, formation of colony, migration of cells and invasiveness of tumors. They further investigated tumorigenesis in bladder tissue in nude mice models and validated mTOR as target gene. They found that low miR-100 caused negative effect on stage of disease, progression in disease, recurrence of tumor and survival [6].
Song, et al. also found downregulation of miR-100 in bladder tumor in particular compared to adjacent normal tissue. In addition to miR-100 they found alteration in expression of other 50 microRNAs [10,17].
Catto, et al. observed expression of miR-100 in bladder tumor tissue. They found downregulation of miR in low grade bladder cancer only however study by Wang et al found downregulation in high and low grade as well [18].
We found in our study that miR expression was significantly underexpresed in tumor tissue compared to normal (p=0.001). On further analysis miR-100 expression levels were more decreased in recurrent urinary bladder tumors (p=0.045) reaching significance however not significant in tumor stage and tumor grade (student t test and anova).
Our study showed that the downregulation of miR-100 may more frequently occur in bladder cancer tissues with aggressive clinicopathological features and it may be used along with other markers (including microRNAs) to predict prognosis and recurrence.
The present study elucidated that miR-100 expression is downregulated in Bladder cancer tissue than normal bladder urothelium. The miR-100 expression levels were decreased in all bladder tumors however reaching significance in recurrent, high grade tumors. The less number of patients and short duration follow up limited our assessment of correlation of miR 100 with tumor progression and survival. This study can help us in planning future comprehensive research in miR 100 and other tumour markers in bladder cancer.
Citation: Kumar M, Kumar S, Singh SK, Prasad R, Kumar A (2020) Correlation of miR-100 Expression with Clinopathological Parameters in Bladder Cancer. Med Sur Urol 9:230. doi: 10.24105/2168-9857.9.230
Received: 05-Jan-2020 Accepted: 11-Jun-2020 Published: 18-Jun-2020 , DOI: 10.35248/2168-9857.20.9.230
Copyright: © 2020 Kumar M, et al. This is an open-access article distributed under the terms of the Creative Commons Attribution License, which permits unrestricted use, distribution, and reproduction in any medium, provided the original author and source are credited.