Emergency Medicine: Open Access
Open Access
ISSN: 2165-7548
ISSN: 2165-7548
Mini Review - (2022)Volume 12, Issue 10
Liver Abscesses (LA) are pus-filled lesions. Amoebic Liver Abscesses (ALA), caused by protozoa called entamoeba histolytica and Pyogenic Liver Abscesses (PLA) produced by pus-forming bacteria are the two most common types encountered in clinical practice, most often in an emergency. LA debilitates the health and pushes the patients to bed. While pus culture-sensitivity tests confirm the cause of LA, contrast CT scans of the abdomen show the number of abscesses, their sizes, and the extensions. Telemedicine practice is on the rise to make healthcare ubiquitous. Image processing is becoming a part and parcel of teleradiology (a segment of telemedicine) to fill the gap between the number of radiologists versus the large patient pool who need early and accurate diagnoses and referrals. Clusterbased image segmentation is a useful step in grouping the image into the desired number of clusters. The k-Means Clustering (k-MC) technique is one popular method, used in this study on ALA and PLA contrast CT images. It observes that with the desired 2-clusters parameters such as normal liver tissue and pus-filled tissue, the algorithm gives better results in delineating PLA.
Amoebic liver abscess; Pyogenic liver abscess; Image processing; Teleradiology; K-means clustering
ALA: Amoebic Liver Abscess; CT: Computerized Tomography; k-MC: k-Means Clustering; LA: Liver Abscess; PLA: Pyogenic Liver Abscess; RBC: Red Blood Cells; WBC: White Blood Cellss
The incidence rate of Liver Abscess (LA) is 2-3 cases per 100,000 populations, Liver Abscess (LA) is common in middle-aged males and the portal vein is the key transporter of the infection, mostly to the right lobe of the liver, close to the dome of the diaphragm [1]. The two most common types of liver abscesses are amoebic and pyogenic liver abscesses, in short, ALA and PLA, caused by entamoeba histolytica and escherichia coli, respectively although other pyogenic bacteria are also held responsible [1]. Abdominal contrast computerized tomography (CT) provides a high-quality image of liver abscesses with a diagnostic accuracy of 96% compared to conventional abdominal ultrasound having a diagnostic accuracy of around 76% [2]. LA is a common occurrence in hospital emergencies, presenting with acute abdomen, high fever with chills and rigor, diarrhea, and extreme malaise, with a mortality rate of 5.8% [3].
Teleradiology is becoming a part and parcel of telemedicine to bridge the gap between the small numbers of radiologists versus the large number of populations in need. Its advantages are manifold when accessing healthcare from distance is the key issue that is commonly noticed in a geographically vast country like India. Within teleradiology, again, a radiologist has to handle a high volume of images. The image processing technique here comes into play as a method of not only increasing the processing speed but also identifying the Region of Interest (ROI) in the image [4]. In many places, healthcare providers do not have any radiology exposure. To them, automatic ROI detections are helpful to decide on the referral of a case to a higher facility without much delay [4].
Segmentation methods are useful for medical image processing to find out the ROIs automatically. Among many segmentation techniques, k-Means Clustering (k-MC) is a popular one. It randomly assigns the ‘centroid-pixels’, iteratively, and then measures the Euclidean distances of the remaining pixels from the centroid till no more pixel remains un clustered. It is userfriendly as it can define the number of desired clusters and is quite fast to converge [5].
Study design and general information
It is an unsupervised learning algorithm when the data are unlabeled, which is true for this case.
Steps-
• assign the number of ‘k’ clusters
• select random cluster centers (centroids) as ‘k’ points iteratively
• measure the distance of each data point (here it is a pixel) from the centroid iteratively and accommodate if the distance is less than a cut-off value
• accommodate all data points into ‘k’ clusters iteratively till no data point is left out
The objective of this study is to (a) check how efficient is k-MC in segmenting the lesions in the ALA and PLA CT images from the liver tissue and (b) the pathological correlations.
Image processing
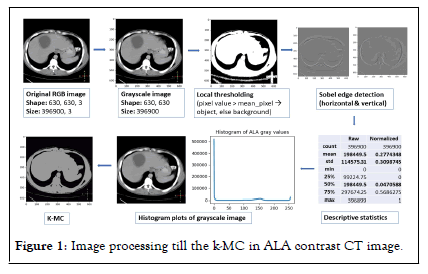
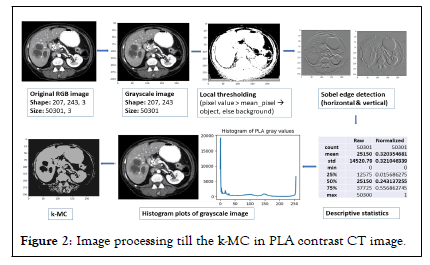
The ALA and PLA contrast CT images is acquired from and the published review paper by respectively [6,7]. The images are then processed by gray scaling followed by the local thresholding, edge-detection with Sobel horizontal and vertical methods, and finally clustering-based segmentation with the k-MC method. Before clustering, descriptive statistics (minimum and maximum values, mean value, median value, value of standard deviations, and quartile values) of the pixel data for each image have been calculated. Histogram plots (pixel value on the x-axis vs. frequency of occurrence on the y-axis) of each image are also conducted to note the pixel density (size and its respective frequency). All programming is accomplished using python 3.8.3 with the pre-loaded image processing packages, which run on Windows 10 pro OS platform. The outputs can be seen comprehensively in Figure 1 (ALA image processing) and in Figure 2 (PLA image processing), respectively. It is important to note that black zones represent the minimum pixel values, i.e., zero while the brighter zones have higher values close to 255.

Figure 1: Image processing till the k-MC in ALA contrast CT image.

Figure 2: Image processing till the k-MC in PLA contrast CT image.
Figure 1 shows a comprehensive picture of how the CT image of ALA has been processed till k-MC clustering. The lesion cannot be detected in any of the processes such as the local thresholding, Sobel edge detection, and k-MC. The histogram plot is a dull line that corroborates the fact that there is no difference in the tone between the lesion and the liver parenchyma. The normalized mean and median pixel values are 0.277 and 0.04 with a standard deviation of 0.309.
Figure 2 shows a comprehensive picture of how the CT image of PLA has been processed until k-MC clustering (2-clusters) is done in the event of ALA. The lesion cannot be detected only by local thresholding. Other more sophisticated techniques, e.g., Sobel edge detection, and k-MC could detect the lesions effectively. The histogram plot is not a dull line as the ALA histogram plot. It shows tiny spikes between 0 and 50 marks which corroborates the fact that there is an obvious difference in the tone between the pus-filled lesions (darker region) and the liver parenchyma (relatively brighter region).
Pathological correlation of k-MC findings
In the case of ALA, the pus is typical of a chocolate brown color called an ‘anchovy sauce/paste’ type, i.e., much thicker in consistency. The pus consists mostly of dead and deformed liver cells (hepatocytes) and trophozoites of entamoeba on the wall of the abscess. There are a few red blood cells (RBC) and leucocytes or White Blood Cells (WBC) that can also be found [8]. It is important to state that superadded bacterial infection is much rare in ALA [9]. On the other hand, pus in PLA is due to overwhelming bacterial infection and hence it contains a high amount of dead WBCs (especially the neutrophils), a few necrosed hepatocytes, and an abundant number of RBCs. Hence, the pus is purulent like sputum but not as thick as the anchovy paste seen in ALA [10,11].
Liver abscesses (LA) are pus-filled lesions on the liver. The two most common types encountered in clinical practise, most often in an emergency, are amoebic liver abscesses (ALA) caused by the protozoa entamoeba histolytica and pyrogenic liver abscesses (PLA) caused by pus-forming bacteria. LA impairs health and confines patients to bed. While pus culture-sensitivity tests confirm the cause of LA, contrast CT scans of the abdomen reveal the number, size, and extension of abscesses. Telemedicine is becoming more popular as a way to make healthcare more accessible. Image processing is becoming an integral part of teleradiology (a subset of telemedicine) in order to bridge the gap between the limited number of radiologists and the large patient population in need of timely and accurate diagnoses and referrals.
Histogram plots of each image (pixel value on the x-axis vs frequency of occurrence on the y-axis) are also performed to determine pixel density (size and its respective frequency). All programming is done in Python 3.8.3 with pre-loaded image processing packages on the Windows 10 pro OS platform. The results are shown in detail in Figure 1 (ALA image processing) and Figure 2 (PLA image processing). It's worth noting that black zones have the lowest pixel values, i.e., zero, whereas brighter zones have higher values close to 255.
From this experiment, it can be ascertained that a high amount of blood cells in PLA has probably played a crucial role in manipulating the pixel values of the abscess images helping the k-MC method to successfully cluster the abscesses from the liver parenchyma. In the case of ALA, the mean pixel value is very high which is 198449.5 (i.e., more inclined towards the brighter pixel side) compared to PLA which has a mean pixel value of 25150, which is 1/8th times the former i.e., more inclined towards the darker pixel side. Hence, in PLA, the k-MC algorithm can produce a sharp contrast between the pus-filled abscess (darker pixels) and the liver tissue (relatively brighter pixels), but not in ALA as the pixel values in the abscess are almost similar to the liver tissue.
The global objective of this paper is to apply medical image processing in diagnosing LA type in hospital emergency that uses teleradiology. The specific focus is to test the k-MC algorithm to differentiate between the ALA and PLA contrast CT images and presents its preliminary results. It further derives the plausible correlations between the k-MC result and the microscopical nature of the pus, especially the tissue components inside it. The study observes that k-MC is a suitable algorithm to differentiate the image of any pyogenic lesions where WBCs and RBCs are plentiful. On the other hand, the pus in ALA is principally composed of necrosed hepatocytes and trophozoites giving a homogeneous texture like the liver tissue. This is an interesting finding and could be useful for image processing in teleradiology practice to assist rural populations in developing nations where ALA and PLA cases are not so infrequent. However, such observation requires further testing and validation on a large set of ALA and PLA images.
There is no conflict of interest to declare.
The study has not been supported by any funding source.
[Crossref] [Google Scholar] [PubMed]
[Crossref] [Google Scholar] [PubMed]
[Crossref] [Google Scholar] [PubMed]
[Crossref] [Google Scholar] [PubMed]
[Crossref] [Google Scholar] [PubMed]
[Crossref] [Google Scholar] [PubMed]
Citation: Chattopadhyay S (2022) CT Images of Pyogenic and Amoebic Liver Abscess with K-Means Clustering: An Application of Image Processing In Medical Emergency. Emergency Med.12:257.
Received: 24-Sep-2022, Manuscript No. EGM-22-19347; Editor assigned: 28-Sep-2022, Pre QC No. EGM-22-19347 (PQ); Reviewed: 12-Oct-2022, QC No. EGM-22-19347; Revised: 19-Nov-2022, Manuscript No. EGM-22-19347 (R); Published: 26-Nov-2022 , DOI: 10.4172/2165-7548.22.12.257
Copyright: © 2022 Chattopadhyay S. This is an open-access article distributed under the terms of the Creative Commons Attribution License, which permits unrestricted use, distribution, and reproduction in any medium, provided the original author and source are credited.