Journal of Geology & Geophysics
Open Access
ISSN: 2381-8719
ISSN: 2381-8719
Research Letter - (2013) Volume 2, Issue 4
The response of phytoplankton chlorophyll generated by two cyclones with different intensities in the Bay of Bengal during pre monsoon season (May) during 2003-2004 was studied by multi satellite approach. Chlorophyll-a (Chl-a) concentration (0.5 mg/m3) increased with preceded by cooling (3.8°C) at the right ride of the track after the passage of cyclones. This is mainly due to the nutrient increase from vertical mixing and upwelling. The Chl-a enrichment is more during cyclone 01B compared with cyclone 02B, because of their intensities and movement.
Keywords: Cyclone, Chlorophyll-A, Phytoplankton, Bay of Bengal
Strong cyclones occurring in the world’s oceans typically have duration of only a few days, but the physical and biological changes due to this perturbation can last up to several weeks. Strong winds and heavy rainfall represent extreme cases of these disturbances. In the open ocean, a hurricane may deepen the mixing depth by 20 to 30 m [1]. The nutrients injected to the euphotic zone by such events may trigger the growth of phytoplankton [2,3].
Tropical Cyclones play a pivotal role in nutritious phytoplankton in the tropics [4-6]. Bay of Bengal (BoB) is a tropical sea frequently subject to cyclones during pre and post monsoon (April-May & October-December). Cyclones can be described as strong or weak according to their intensity (i.e. wind speed and wind stress curls) and as fast- or slow-moving based on their translation speed. Both intensity and translation speed are important factors influencing the upper water column. The present work divulges how a cyclone contributed to marine primary productivity. For this study I used multi satellite approach. The study area, cyclone tracks with intensity and regions of high chlorophyll-a (Chl-a) (Figure 1).
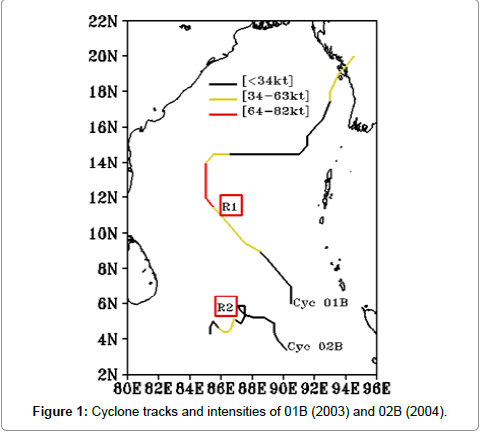
Figure 1: Cyclone tracks and intensities of 01B (2003) and 02B (2004).
Daily surface wind and merged sea surface temperature, which is nearly free from cloud influence over the tropics particularly cyclone period obtained with a spatial resolution of 25 km from QuikSCAT (www.incois.gov.in) and AVHRR (Advanced High Resolution Radiometer)-Advanced Microwave Scanning Radiometer - Earth Observing System (AMSRE) satellites (www.ssmi.com) respectively. SeaWiFS derived chl-a with 9x9 km2 spatial resolution were obtained from the Distributed Active Archive Center (DAAC) of the US National Aeronautics and Space Administration (NASA) http://oceancolor.gsfc.nasa.gov
Tropical Cyclone data is downloaded from the India Meteorological Department (www.imd.gov.in) and Joint Typhoon Warming Center (http://jtwccdn.appspot.com/JTWC).
Ekman pumping velocity (EPV) is an important index of vertical upwelling movements in the upper ocean. EPV (Eq 1) was estimated based on daily wind data [7]. Climatology is calculated by averaging data for the calendar days of two cyclones from 1998-2003 excluding the cyclone year 2003. It will help to eradicate the influence of cyclones on chl-a and to match SeaWiFS-derived chl a with sea surface temperature (SST) data. Time series of satellite data were based on averages over the regions (Figure 1) and used to investigate temporal changes of the ocean response to cyclone passages.
TC-01B
An enhanced region of convection in an active monsoon trough over the Bay of Bengal on 6 May 2003 and it up as a depression on 8 May 2003, situated at 850nm southeast of Madras. On 10 May it further strengthens into a tropical storm at 1800 UTC and it was named as TC-01B. Ocean as well as atmosphere conditions highly favorable for further intensification of the storm. On 11 May/0000 UTC, upped the MSW to 50 kts. The cyclone was then located about 475 nm eastsoutheast of Madras, or about 375 nm east of Sri Lanka. The cyclone strengthened, its maximum sustained wind (MSW) peaked at 65 kts at 1200 UTC on 12 May some 400 nm east of Madras as it plodded steadily towards the East Indian coast. The cyclone’s star was quick to fall, however. The strong upper-level ridge to its north induced easterly shear across the system on the same day it peaked, bringing it below hurricane strength by late on the 13th. Steering currents weakened as well, slowing its forward motion and turning the cyclone onto an erratic, approximately northward course. The synoptic situation did not improve, and by late on the 14th a combination of easterly shear and dry air entrainment had almost completely dissipated the cyclone’s convection saves for a sheared convective core over its center. The system struggled to maintain minimal tropical storm status from the 14th into the 16th, even as it continued to generate strong convection. This particularly bleak time in TC-01B’s life corresponded with a collapse of steering currents that began late on the 14th, and which left the storm quasi-stationary for the next two days. On the 16th, however, TC-01B was allowed to recover as it broke out of the stall and tracked west-southwestward. The system strengthened slightly on the 16th, but faltered again later that day. The cyclone remained weak as the track bent first westward, then northwestward into the 18th, drawing a bead on the Myanmar (Burma) coast. It made landfall at roughly 1000 UTC on 19 May, very near Kyaukpyu, Burma, with a MSW of around 50 kts.
TC-02B
On 1200 UTC on 17 May, placed the center of low pressure approximately 230 nm south of Andaman with the MSW estimated at 35 kts. Twelve hours later the cyclone had drifted southwestward to a position almost 300 nm south-southwest of Andaman. However, at 1200 UTC on the 18th TC-02B had reversed direction and was moving westward at 9 kts. By early on the 19th the cyclone had undergone a significant intensification. The MSW was increased to 60 kts, based on CI estimates of 65 kts, and the system was moving west-northwestward at 10 kts. At 19/1800 UTC reduced the MSW to 30 kts and placed the weakening center within the ocean south of the Sri Lanka.
The intensity of the cyclone 01B is 80knots and translation speed is 2.51 m/s, but the intensity cyclone 02B is 60 knots and translation speed is 3.61 m/s.
The AVHRR-AMSRE SST show sea surface cooling after the passage of cyclone (Figure 2). The decrease is more than 2°C (at the box area mentioned in Figure 1). The low SST (≥ 27.8°C) due to cyc 01B is located in the central BoB, whereas that caused by cyc 02B (≥ 28.8°C) is in south central BoB. The cooling area associated with cyc 01B was larger than that associated with cyc 02B. The cooling brought by cyc 01B is more (3.8°C). Strong warming is observed in cyc 01B compared with cyc 02B (Figure 2a and 2c). Time series SST is plotted over an average area of 1000 km2 (Figure 3a) to observe temporal changes in the SST with background climatology. The strong decrease in SST induced by cyc 01B is even more obvious when considering that the SST was higher before cyc 01B than before cyc 02B and compared with the SST background climatology. This further supports the role of storm intensity and translation speed on the upper ocean. After the passage cyc 01B chl-a increased 0.5 mg/m3 (Figure 3b) but the increase is low (0.2 mg/m3) during cyc 02B. It is coincide with the lowest SST and peak EPV (Figure 3c).
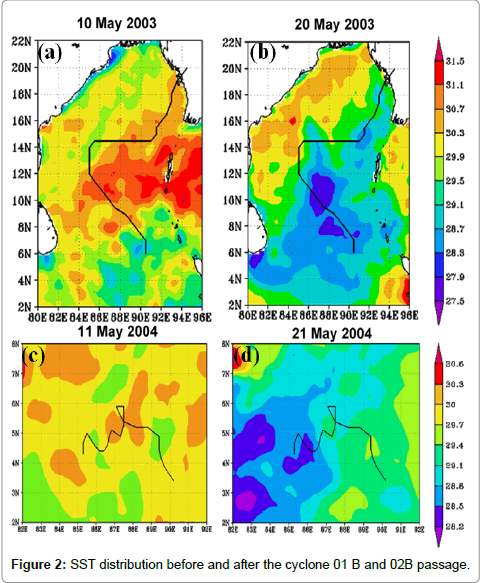
Figure 2: SST distribution before and after the cyclone 01 B and 02B passage.
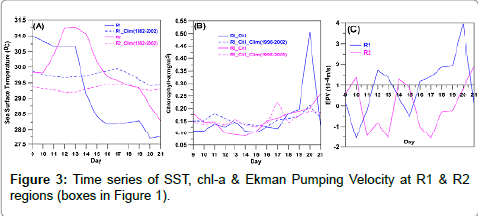
Figure 3: Time series of SST, chl-a & Ekman Pumping Velocity at R1 & R2 regions (boxes in Figure 1).
Satellite derived chl-a is low before the cyclone, but it increased (0.5 mg/m3) quickly after the passage of cyclone over a large area (Figure 4). The present study reveals that the strong cyclone 01B induced a high chl-a over a larger area due to its strong surface cyclonic wind stress curls on a large area of the ocean surface, producing strong vertical mixing and upwelling and bringing up cold and nutrient-rich water to the euphotic zone. As a result, phytoplankton chl-a in response to cyclones are closely related to their speeds and intensities, which must be considered when estimating primary production, which plays a crucial role to global warming.
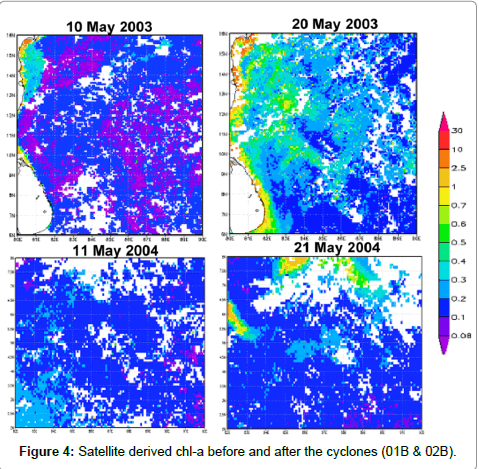
Figure 4: Satellite derived chl-a before and after the cyclones (01B & 02B).
The present study reveals that the strong cyclone 01B induced a high chl-a over a larger area due to its strong surface cyclonic wind stress curls on a large area of the ocean surface, producing strong vertical mixing and upwelling and bringing up cold and nutrientrich water to the euphotic zone. As a result, phytoplankton chl-a in response to cyclones are closely related to their speeds and intensities, which must be considered when estimating primary production, which plays a crucial role to global warming.
The present work is supported by Department of Science and Technology under the Fast Track Young Scientist Project (SR/FTP/ES-09/2008) which is gratefully acknowledged. I am grateful to The Director, INCOIS, Hyderabad and Director, IMD, New Delhi and JTWC for providing the data products. I would like thanks the anonymous reviewers for their valuable comments and suggestions.