Journal of Fundamentals of Renewable Energy and Applications
Open Access
ISSN: 2090-4541
+44 1300 500008

ISSN: 2090-4541
+44 1300 500008
Case Study - (2023)Volume 13, Issue 1
Rising energy costs and falling technological costs, especially household batteries, have seen an increase in demand for small scale renewable energy sources. This is totally off grid system. Therefore, this paper aims to provide a design and economic feasibility study of an energy generation of a photovoltaic system for the coastal area of Gwadar, Pakistan. A photovoltaic panel is considered. The calculations were made to design the photovoltaic system and their respective components. An economic analysis was also performed to determine the total cost of the system over 20 years. The study indicates that properly designed panels are sufficient to supply 100% of the demand.
Photovoltaic; Power generation system; Coastal area; Gwadar
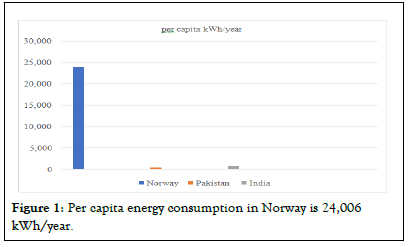
The energy sector is responsible for around 25% of global greenhouse gas emissions. Average global energy consumption per capita in 2016 is around 2674 kWh, as shown in Energy consumption per capita varies considerably depending on household income, weather conditions, size of the home, appliance standards and environmental awareness. Norway is the most energy consuming country per capita [1]. Per capita energy consumption in Norway is 24,006 kWh/year. Pakistan's per capita consumption is 447.50 kWh/year. Per capita consumption in India is 804.51 kWh/year per capita and per country per capita, as follows (Figure 1).

Figure 1: Per capita energy consumption in Norway is 24,006 kWh/year.
The world’s total power generation in 2016 was 23816 TW out of which 4% by liquid fuel, 22% by natural gas and 41% by coal. The remaining 33% are generated by nuclear and renewable energy sources (16% by hydro, 115% by nuclear, 3% by wind, 1% by solar, 2% by biomass) [2].
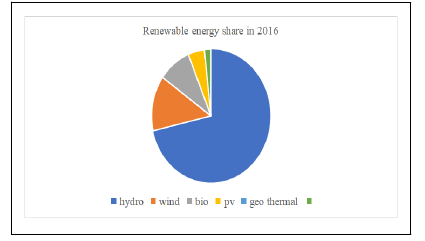
Although hydropower resources currently dominate in renewable power generation, it is expected by 20160, non hydro renewable energies will represent between 20% to 42% of the future power generation mix. Nearly 24.5%of global power production in 2016 came from renewable energy, with 16% coming from hydropower, 3% from wind, 1% from solar, 2% from biofuel (Figure 2).

Figure 2: Renewable energy came from 16% coming from hydropower, 3% from wind, 1% from solar, 2% from biofuel.
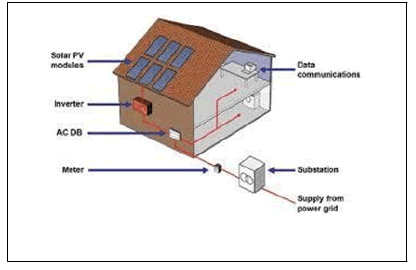
Solar installed capacity has been increasing by reaching approximately 227,700 MW in 2016, equivalent to producing 1% of the power used globally. China is the global leader accounting for 27% of global solar PV followed by japan accounting 15% and Germany, 11.5%. The top three country account for nearly half the global power generation by solar PV. Energy from the sun has some advantages. The surface of the earth receives 120,000 terawatts of solar radiation (sunlight) 20,000 times more power that one planet needs. As the solar panel does not have a by moving parts, its applications are desirable in built up areas. A typical residential rooftop solar PV layout is shown in Figure 3 and Table 1.

Figure 3: A typical residential rooftop solar PV layout.
| System arrangement | ||
|---|---|---|
| Grid extension | Advantages | Disadvantages |
| No program of choice for the user site | Not profitable In Australia, it could cost up to $10,000 per km to expand the grid low quality of electricity at the end of the power lines | |
| Knowledge of customers and industry | Maintenance is expensive | |
| Capable of responding reliably to load changes throughout the day | Transmission lines obstruct the environment | |
| Hybrid power system | Less maintenance for the generator low fuel consumption thanks to renewable sources | Utilizing renewable sources makes the system more complex and costly |
| Potentially the most economical option if fuel prices are high and the location is feasible | Research and development on hybrid systems are still in early stages, hence it is new to the industry and the customers | |
| Low environmental impact flexible to changes in the load | A lack of familiarity would also result in a lack of technical and financial support control systems must be implemented the optimal configuration depends on the life cycle costs which can be determined using optimization techniques or '' simulation software | |
| More reliable than grid extension if well designed and maintained | ||
Table 1: System arrangement of advantages and disadvantages.
The production of energy from coastal resources through solar panels is a promising alternative renewable energy source to minimize losses through power lines and minimize air pollution. Solar panels have the advantage of being silent as there are no moving parts compared to wind turbines. However, solar panels only generate energy during the day. Alternatively, wind turbines generate energy during the day. They are cheaper than generating solar energy. Hence, the generation of energy from coastal resources using the photovoltaic system is a valid alternative renewable energy generation. Numerous studies have been conducted to develop an efficient hybrid renewable system, in which various renewable aspects are used to create an entire system rather than an autonomous system. There are many ways to examine a hybrid system, but it should involve some form of battery storage and also a backup generator [3-6]. As for the other forms of resources, it ranges from photovoltaic solar panels, wind generators, biomass, hydroelectric energy or even desalination. Hybrid systems involve the combination of two or more renewable sources that help improve the efficiency of the electricity produced. In this document, the economic analysis of a hybrid system consisting of photovoltaic panels and wind power generation will be considered for the generation of residential energy in Gwadar, Pakistan, which is not connected to the national grid.
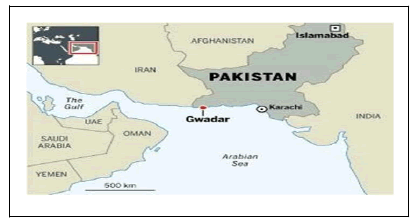
The coastal town of gwadar in Pakistan was chosen for this study. The heat map of Pakistan and geographical location of Gwadar is blessed with good peak sun hours and wind speeds. Table 2 shows the average sun hours and in Gwadar (Figure 4 and Table 2).

Figure 4: Location of Gwadar Pakistan.
| Parameters Gwadar | |
|---|---|
| Country | Pakistan |
| Average peak sun hours | 6 |
| Population | 90762 |
Table 2: Solar data for Gwadar, Pakistan.
Figure 2 shows average peak sun hour in gwadar over a year. It can be noticed that there is more solar radiation in summer months compared to winter. The peak months of solar radiation occurs during April to June with 6.00 peak sun hours, and the lowest solar radiation occurs during January with 4.3 peak sun hours. The average solar radiation throughout the year is 5.2 peak sun hours (Table 3).
| S. No | Components | Quantity | Watts | Hours | Watt hours |
|---|---|---|---|---|---|
| 1 | Fan | 6 | 80 | 8 | 3840 |
| 2 | LED | 60 | 12 | 6 | 4320 |
| 3 | AC | 3 | 3000 | 4 | 36000 |
| 4 | Refrigerator | 1 | 180 | 8 | 1440 |
| 5 | TV | 3 | 45 | 3 | 405 |
| 6 | Iron | 1 | 1000 | 0.5 | 500 |
| 7 | Motor | 1 | 600 | 0.5 | 300 |
| 8 | Computer | 2 | 45 | 5 | 450 |
| 9 | W.M | 1 | 400 | 2 | 800 |
| Total | 15655 wh | ||||
Table 3: On average, Gwadar household use approximately shown in the table where calculated watt hours are followed.
In this study, it is assumed that these all loads are used just at night on battery back up but at morning these are loads directly operate by Photovoltaic (PV) system and wind. The hybrid system is designed to fulfill the household demands. The demands at night 15.6 kWh/day. In analysing the meteorological data for gwadar, it was noted that there was more solar radiation available in summer compared to winter.
PV array sizing and selection
We need 15655 Wh electricity for daily consumption. Where autonomy considered two days. Now convert AC loads into DC loads.
DC loads considered inverter loss total AC loads/inverter efficiency 15655/0.9 × 24=724.7
Where DC load is calculated 17394.5 Now required battery capacity 2 × 17394.5/24 × 60=2416 Ah
24 v 2500 Ah battery required 24/12 and 25000/2000
2 × 12=24
Total 12 v, 24 v batteries are required for the system. Solar capacity for feeding battery
DC loads demands=AC loads/inverter efficiency × system voltage 15655/0.9 × 24=731.5
I considered module 330 w current is 8 ampere which depends on sun lights and 24 volts. Module output=4.2 × 8=33.6 Ah it gives us 33.6 power at the day.
Sunshine time 4.2 should be at least
Module parallel=DC demands/modules output
724.7/33.6=21.5 panels in parallel it means we need 21.5 panels.
Series module=System volts/module voltage
24/24=1 where module be single in series.
Our running load is 17394.5-15655=1739.5 we have inverter size around 1 kw, 1.5 kw and 3 kw, 5 kw etc.
PV module required 5 kw because our peak AC loads are around 5 kw. Inverter sizing must be greater than our home appliances (Table 4).
| Materials | Specification | Quantity | Units price (US $) | Total cost (US $) |
|---|---|---|---|---|
| PV panels | 330 w | 24 | 103 | 2472 |
| Inverters | 24 v, 5 kw | 1 | 576 | 576 |
| Batteries | 200 Ah | 24 v, 24 v | 109 | 2618 |
| Total cost | 5666 | |||
Table 4: Total material cost.
The response rate is 402 (97.1%), the mean (± SD) age of respondents is 25.7 (± 4.5) years. Two hundred twenty six (56.2%) of them are in the age group of 25-34 years. The median monthly income of the family is 1000 birr. More than half of respondents, 243 (60.4%) of the study participants are Muslim in religion. The majority 332 (82.6%) of respondents are housewives, 382 (95%) of them got married. Out of the total study respondents 64 (15.9%) of them are illiterates and 300 (74.6%) are living with less than five family members [7,8].
Calculate electricity bill for 20 years
After calculating bill of electricity of this coastal area household than compare it into PV system price to know that is this system significantly fine for 20 years. Let’s calculate this considered household electricity bill.
Total loads of the house are 46000 W Units/month
Unit=watts × hours × 30/1000
Putting the values 15655 × 30/1000=469.65 fee unit is US $0.066
Units × fee unit price 469.65 × 0.066
Per month electricity bill is US$31
Now per year electricity calculation as follow 12 × 31=372
Now for 20-year electricity bill as become follow 20 × 372=7440
For 20 years if you use grid you have to pay US $7440. 7440-5666=US$1774
This system has 20-year life calculated price is US $5666 if we compare this amount to grid calculated 20-year payments. The grid amount is something higher than PV system installed at household. We can say that the PV system is more efficient due to environmental and others useless factors. That’s why I recommend the PV system for the coastal area households.
A system of photovoltaic panels has been considered for a home in Gwadar. The system must provide 15.6 kWh, which was the daily energy requirement. Calculations were performed for the size systems and their respective components. Energy consumption loads are generally higher in summer than in winter. If the system was sized to meet summer loads, it would be great for winter. Where there would be many more solar resources, but significantly less in winter. This was addressed by sizing the photovoltaic modules to meet summer needs so that in summer, all the energy could be satisfied using the panels. When the panels were sized for the summer months, the photovoltaic component satisfied 100% of the summer load, it was observed that although Gwadar had the highest average peak hours of sunshine, based on the calculation and taking into account the efficiency of the system, a total of twenty four 320 W photovoltaic panels are used.
An economic analysis was also conducted to determine the present value of the electricity generated over a 20-year period. The total cost of US $5666 is significantly higher than the total photovoltaic panel power supply. Which is still significantly more expensive than the grid connected energy source. However, benefits such as reducing greenhouse gas emissions, lower operating costs and a reliable power supply are making alternative energy sources attractive to the common masses. With the advancement of its technology and lower costs, the alternative power supply can compete with the power supplied by the network.
The study indicates that a properly designed photovoltaic system can be an effective means of meeting 100% of the energy demand in this sector. A total of twenty four 320 W photovoltaic panels was sufficient to satisfy 100% of summer and winter demand. The research provides evidence to support an appropriate configuration of PV capacity and wind turbines to suit the energy demand of the area, as well as their mutual cost analysis findings.
[Crossref] [Googlescholar] [Indexed]
Citation: Rasheed N, Ali M, Kabeer (2022) Design of a Household PV Power Generation System for a Coastal Area: A Case Study for Gwadar, Pakistan. J Fundam Renewable Energy Appl. 12:298.
Received: 20-May-2020, Manuscript No. JFRA-20-4311; Editor assigned: 25-May-2020, Pre QC No. JFRA-20-4311(PQ); Reviewed: 08-Jun-2020, QC No. JFRA-20-4311; Revised: 02-Dec-2022, Manuscript No. JFRA-20-4311(R); Published: 30-Dec-2022 , DOI: 10.35248/2090-4541.22.12.298
Copyright: © 2022 Rasheed N, et al. This is an open-access article distributed under the terms of the Creative Commons Attribution License, which permits unrestricted use, distribution, and reproduction in any medium, provided the original author and source are credited.