Journal of Nutrition & Food Sciences
Open Access
ISSN: 2155-9600
ISSN: 2155-9600
Research Article - (2020)Volume 10, Issue 3
A study Syrian olive oil possesses high health effects because of its content of omega-9 and phenolic antioxidants, this oil contains another beneficial antioxidants as coenzyme Q10 (CoQ10), which have been determined in olive and other edible vegetable oils, but have not been evaluated in Syrian olive oil. The extraction was achieved by saponification and solid-phase extraction (SPE) and the determination was done by using high performance liquid chromatography (HPLC) with a Diode array detector. Q10 level was determined in Khrage oil to detect the effect of boiling of olive fruits during the extraction of oil on Q10 concentration. Syrian olive oil samples contained high amount of CoQ10 ranged from 50.8 to 62.1μg/g oil.
Coenzyme CoQ10; Syrian olive oils; High Performance Liquid Chromatography (HPLC)
Mediterranean diet is popular because it has many healthy effects; those who follow this traditional diet enjoy some of the lowest recorded rates of chronic disease in the world [1]. Olive oil is the most important component in this diet and has a great role in reducing the risk of overall mortality and morbidity including cardiovascular diseases and many kinds of cancers and incidence of neurodegenerative diseases [2-6]. Olive oil is high in oleic acid. However, recent scientific studies shows that healthy effects must also be attributed to antioxidants polyphenols [7-9]. Olive oil includes other substances which have potential useful effectiveness on health, such as coenzyme Q10 [10].
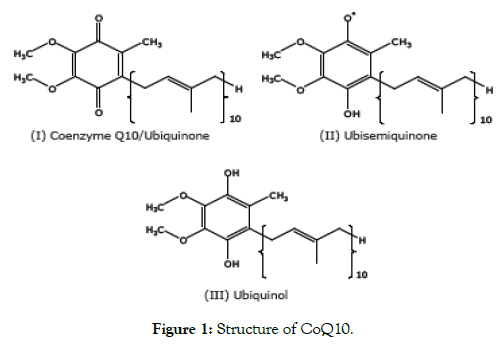
CoQ10 has aquinone ring and a hydrocarbon side chain made up of 10 isoprene units (Figure 1). This side chain is synthesized from acetyl-CoA through the mevalonate pathway (the mevalonate pathway is used for the first steps of cholesterol biosynthesis). The quinone ring is synthesized from the amino acids (tyrosine orphenylalanine) and is responsible for CoQ10 having such strong antioxidant activity.

Figure 1: Structure of CoQ10.
The reduced form of CoQ10 is active one and responsible for sweep the free radicals which lead to damage to the body’s DNA, proteins, and lipids, so diminishing the possibility of dangerous diseases as cardiovascular disease, and neurodegenerative diseases such as Alzheimer’s or Parkinson’s [11-14].
There are many dietary sources of CoQ10 as meat and fish which are considered richer than non-animal food [10]. Vegetable oils, specially soybean and olive oil contain high levels of CoQ10 and have been used as good sources of it [15]. The concentrations of CoQ10 differ between countries and ranged from 4.1 to 160 mg/ kg [16-19]. Syrian olive oil has a high value and healthy benefits, due to the fact that Syria is one of the Mediterranean countries. The objective of this study was to detect Q10 in Syrian olive oil from different regions in Syria and make a comparison between tow extraction methods for Q10 from olive oil.
Olive oil samples were collected from different places in Syria and Khrage oil which is different from other Syrian olive oils in its preparing and extraction methods and in its taste, it is famous in coastal regions, Khrage oil is prepared by boiling the olive fruits in water before the extraction of oil from the olive fruits, so we tried in this search to detect about the effect of boiling on the concentration of CoQ10 in Khrage oil. Some olive oil samples from different countries were purchased (Italy-France-Greece- Spain-Slovenia).
Chemicals
CoQ10 were purchased from Sigma-Aldrich, 2-propanol (Panreac) and methanol (LiChrosolv- Reag.Ph Eur) were of high performance liquid chromatography (HPLC) grade. Hexane and ethyl ether were purchased from (Sigma-Aldrich). For cleanup procedure, Supelclean ENVI-Carb/LC-NH2 6 ml tubes.
Solid phase extraction
Coenzyme Q10 was extracted by solid phase extraction method (Rodr´Iguez-Acun˜aet al), hexane was used instead of heptane in all phases, the elution was achieved with a mixture of hexane:ethyl ether (70:30 v/v), at the end of procedure the residue was dissolved in 2 ml of the mobile phase.
Saponification and extraction of samples
The oil samples were saponificated in order to extraction of Coenzyme Q10 form oil samples (Young-Hee Pyo), then the residue was dissolved in 1 ml of mobile phase.
HPLC analysis
The separation and quantification of CoQ10 was performed by HPLC (SHIMADZU) with a C18 column (5 μm, 4.6×250 mm) using a mobile phase consisting of 2-propanol-methanol (50:50, v/v), at a flow rate of 1.2 ml/min. Injection volume was 20 μl for all tested samples. The Diode array detector, detection was carried out at 275 nm.
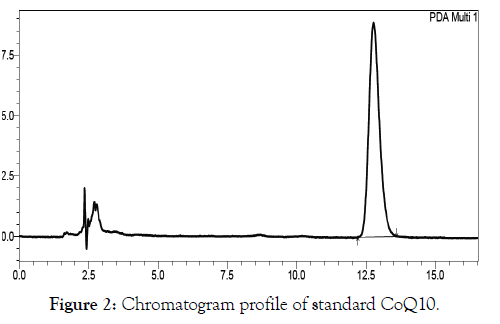
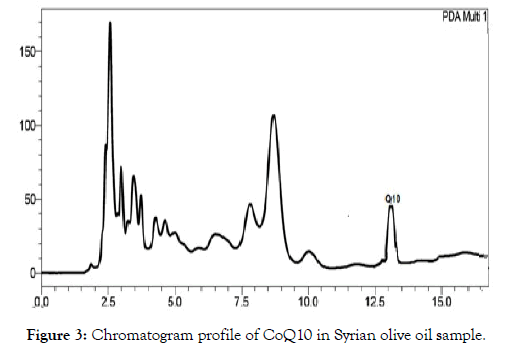
The Coenzyme Q10 was separated from other components in olive oil samples, and the detection was achieved by diode array at wavelength 275 nm, the retention time was 13 min (Figure 2 and Figure 3).

Figure 2: Chromatogram profile of standard CoQ10.

Figure 3: Chromatogram profile of CoQ10 in Syrian olive oil sample.
CoQ10 was found in all samples determined, and contents ranged from 50.8 to 62.1 μg/g oil as shown in the Table 1. Three samples of Latakia showed higher concentrations of CoQ10, then Tartus and Aleppo samples, the lowest concentrations were in Homs and Hama. The concentrations of Q10 after the extraction of it using solid phase extraction and saponification were converged. Khrage oil samples contained high levels of Q10 and very similar to Latakia samples, knowing that Khrage oil is prepared and used in the countryside of Latakia, however they are different in the extraction method of oil from olive fruits.
Table 1: Contents of CoQ10 (μg/g) in Syrian olive oil samples.
| Samples | SPE Extraction | Saponification |
|---|---|---|
| Latakia 1 | 62.1 ± 4 | 61.9 ± 8 |
| Latakia 2 | 60.3 ± 10 | 60.4 ± 17 |
| Latakia 3 | 59.7 ± 5 | 59.5 ± 18 |
| Latakia 3 | 59.4 ± 7 | 59.7 ± 3 |
| Tartus 1 | 58.5 ± 4 | 58.6 ± 12 |
| Tartus 2 | 59 ± 9 | 58.8 ± 8 |
| Tartus 3 | 58.6 ± 8 | 58.5 ± 11 |
| Tartus 3 | 58.9 ± 2 | 58.6 ± 4 |
| Khrageoli 1 | 59.4 ± 2 | 59.1 ± 1 |
| Khrageoli 1 | 58.7 ± 4 | 59.8 ± 2 |
| Khrageoli 1 | 59.9 ± 8 | 60.05 ± 1 |
| Homs 1 | 52.1 ± 4 | 52.2 ± 8 |
| Homs 2 | 51.4 ± 8 | 51.7 ± 15 |
| Homs 3 | 51.5 ± 9 | 51.3 ± 6 |
| Homs 3 | 50.8 ± 3 | 50.6 ± 2 |
| Aleppo1 | 57.1 ± 12 | 59.2 ± 3 |
| Aleppo 2 | 58.7 ± 8 | 58.5 ± 12 |
| Aleppo 3 | 58.6 ± 11 | 58.5 ± 2 |
| Aleppo 3 | 58.8 ± 4 | 58.9 ± 9 |
| Hama 1 | 52 ± 8 | 52.2 ± 6 |
| Hama 2 | 51.4 ± 5 | 51.3 ± 12 |
| Hama 3 | 51.6 ± 2 | 51.5 ± 3 |
| Hama 3 | 50.6 ± 16 | 50. 7 ± 5 |
The comparison was made between the concentration of Q10 in Syrian olive oil and olive oils from different countries (Italy-France- Greece-Spain-Slovenia) as shown in Table 2.
Table 2: CoQ10 content (μg/g) in olive oil samples from different countries.
| Q10 μg/g | Country |
|---|---|
| 65 ± 18 | Spain |
| 49 ± 9 | Slovenia |
| 45 ± 5 | Italy |
| 58 ± 10 | France |
| 56 ± 9 | Greece |
| 62.1 ± 4 | Syria |
All measurements were repeated three times, the values for each sample are represented as the mean ± ( SD of the repeated determination).
It was noted from the Table 3 that there was a significant difference for the Q10 concentration under the influence of region change, at the level of significance 0.05, where the highest values appeared in Latakia and the Khrage oil, while the values in both Homs and Hama decreased significantly from the rest of the regions, while the method of extraction did not have any significant effect In the Q10 concentration within the same region.
Table 3: The statistical study of Q10 in Syrian olive oil samples using the two extraction methods.
| Samples | SPE Extraction | Saponification |
|---|---|---|
| Lattakia | 60.38 ± 1.21a | 60.38 ± 1.087a |
| Tartus | 58.75 ± 0.238bc | 58.63 ± 0.126bc |
| Khrageoli | 59.33 ± 0.603abc | 59.65 ± 0.492ab |
| Hims | 51.45 ± 0.532d | 51.45 ± 0.676d |
| Aleppo | 58.3 ± 0.804c | 58.78 ± 0.34bc |
| Hama | 51.4 ± 0.589d | 51.25 ± 0.918d |
| LSD0.05 | 1.188 | |
| CV% | 1.267 | |
Superscripted letters are statistically significant
To ensure this, the correlation coefficient was calculated between the Q10 concentration and the influencing factors; the correlation coefficient was significant for the region and not significant for the extraction method.
There are many researches depended on direct injection of oil samples without extraction [20,21]. However this technique has not been selected in this search because it caused problems in the column, in addition to possible interferences. The suitable separation between the triglycerides (TG) and the CoQ10 in oil samples was done by modifying silica gel in the solid phase extraction with NH2 group which has affinity with double bonds. Silica gel before modifying could not be able to achieve the desired separation. SPE clean up technique protects the column and gives purified extract. CoQ10 has been extracted from oils samples also using saponification [22].
The saponification achieved suitable determination of CoQ10 through get rid of triglycerides (TG) which affect on column and separation procedure. Benzene was used in the saponification step [23,24]. But hexane was used in this research because of its safety and effectiveness.
Actually the solid phase extraction and the saponification method have got many steps and needed the reasonable amounts of solvents; however the advantage of two methods is the ability to apply them in simple laboratories without needing advanced instruments.
The detection technique, based on the Diode array detector gave an advantage is the ability to select the best wavelength for analysis [25]. The diode array detector has high selectivity, as it can identify different substances by their spectra. Diode array detector is available in most laboratories and does not need to professional technical to conduct it. Some researchers showed that nuts and vegetable oils as soybean and olive oil contain high concentration of CoQ10 [10,15].
The effect of Olive oils which high in CoQ10 on blood lipoproteins has been proven [26]. However, the concentrations of CoQ9 in olive oils from different countries were low relatively, so CoQ10 was chosen in this search.
CoQ10 in Syrian olive oil was not studied before, in this paper Syrian olive oil samples were determined by HPLC, the results converged after using the two extraction methods. That means the both extraction methods are effective in CoQ10 determination in olive oil samples.
Three samples of Latakia showed higher concentrations of CoQ10, in comparison between samples, we noticed the convergence of the CoQ10 values in the samples collected from geographically adjacent and contiguous regions like Latakia and Tartus which two coastal regions while Homs and Hama are two inner regions. Khrage oil samples have high concentration of Q10 and are very similar to another costal samples, as the Khrage and Lattakia olive oils samples are from the same geographical region and are different in the extraction method of oil from olive fruits, we can notice that the boiling of olives fruits before the extraction of oil has no obvious effect on Q10 content in Khrage oil.
There could be several factors affect on Q10 values in olive oil samples, including maturity and agricultural and geo-climatic effects and geographical regional differences [27].
Syrian olive oil showed high concentration of Q10 compared with olive oil samples from other countries, which demonstrates the value of Syrian olive oil, and the possibility of depending on it as a source of CoQ10. Syria is one of the major olive oil producing countries and the consumption of olive oil is high, around 120,000 tons. Foods have over 50 mg CoQ10/kg are excellent sources of CoQ10. At the end of this paper we may be able to adopt the fact that Syrian olive oils are considered from the best natural sources of dietary CoQ10.
This article does not contain any studies with human participants or animals performed by any of the authors.
The author(s) declare no potential conflict of interest.
Not applicable.
Citation: Alnokkari A (2020) Effect Determination of Coenzyme CoQ10 in Syrian Olive Oils. J Nutr Food Sci. 10:775. doi: 10.35248/2155-9600.20.10.775.
Received: 06-May-2020 Accepted: 08-Jun-2020 Published: 15-Jun-2020 , DOI: 10.35248/2155-9600.20.10.1000775
Copyright: © 2020 Alnokkari A. This is an open-access article distributed under the terms of the Creative Commons Attribution License, which permits unrestricted use, distribution, and reproduction in any medium, provided the original author and source are credited.