Journal of Chromatography & Separation Techniques
Open Access
ISSN: 2157-7064
ISSN: 2157-7064
Research Article - (2022)Volume 13, Issue 5
Objective: The objective of present work is to develop and validate HPTLC method for simultaneous estimation of Curcumin and Azadirachtin in marketed formulation
Materials and methods: HPTLC method was developed using a solvent system Toluene: Ethyl acetate: Ammonia: Formic acid (4:3:2.5:0.5 v/v/v/v) using a stationary phase Silica Gel 60 F254 and the saturation time is 15 min. The developed method was standardized in terms of validation parameters such as specificity, linear range, precision, robustness, ruggedness and reproducibility as per ICH guidelines. Newly developed and validated method was successfully applied for estimation of Curcumin and Azadirachtin in marketed formulation.
Results: The linearity range for the both Curcumin and Azadirachtin was found to be 1.5-15 μl/spot. The limit of detection found to be 0.383213 μl/spot for the Curcumin and 0.46572 μl/spot for Azadirachtin. The limit of quantification is found to be 1.16125 μl/spot for the Curcumin and 1.411272 μl/spot for Azadirachtin. Recovery of Azadirachtin in marketed formulation was observed in the range of 91%-109% and recovery of Curcumin in marketed formulation was observed in the range of 91%-105%. All the precision and repeatability results were within acceptance range less than 2%. Assay of Curcumin and Azadirachtin was found to be 92.95% and 91.79% respectively. The Rf value of Curcumin is found to be 0.5 ± 0.03 and the Rf value of Azadirachtin is found to be 0.57 ± 0.04.
Conclusion: The method was found to be simple, accurate, environment friendly, reproducible and can be used for routine estimation analysis of Curcumin and Azadirachtin in marketed formulation.
Azadirachtin; Curcumin; HPTLC; Method development; Validation
μl: Microlitre; LOD: Limit of Detection; LOQ: Limit of Quantification; HPTLC: High Performance Thin Layer Chromatography; CUM: Curcumin; ADT: Azadirachtin
Curcumin Figure 1 is the active constituent of curcuminoid of the turmeric i.e. Curcuma longa belonging to the family Zingiberaceae [1]. It is used as a dietary supplement. It acts as a chemo preventive agent and anti-inflammatory agent [2-6]. Azadirachtin Figure 2 is the active constituent present in the neem i.e. Azadirachta indica belongs to the family Meliaceae which belongs to the limonoid group [2]. Azadirachtin is the main compound of neem present in the neem seed and neem leaf etc. which is mainly used as insecticide and also it is useful in blood purification and detoxification [3-6]. In order to estimate Curcumin and Azadirachtin in marketed formulation few UV–Spectrophotometric methods, HPLC methods have beenw reported by other researchers. Hence there is need to develop and validate HPTLC method for simultaneous estimation of Curcumin and Azadirachtin in marketed formulation.
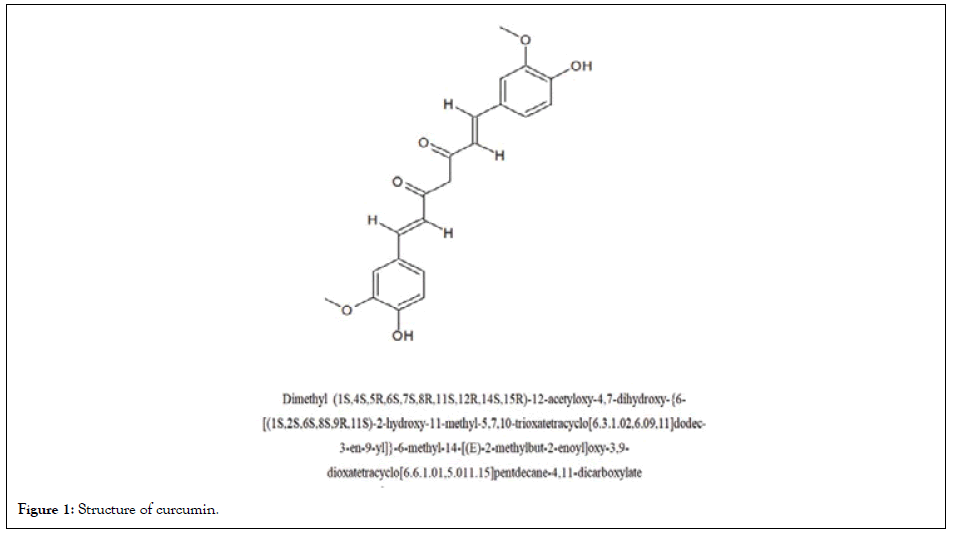
Figure 1: Structure of curcumin.
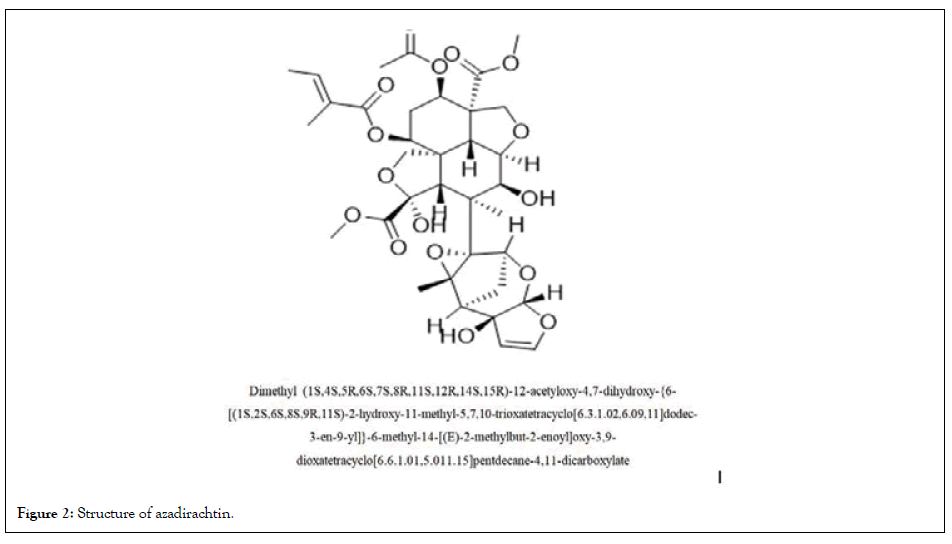
Figure 2: Structure of azadirachtin.
Instrumentation
HPTLC instrument of CAMAG with Win Cats and Vision cat software used for the analysis of the Curcumin and Azadirachtin. Calibrated weighing balance was used for weighing.
Drug sample
Azadirachtin (API) was obtained from Kaizen Biochem, Amravati, Maharashtra. The curcumin was obtained from the Geekay Bioproducts, Dharapuram, Tamilnadu and marketed formulation is purchased from market.
Reagents and chemicals
Methanol and other chemicals used for the experiment were obtained from the store house of KLE College of Pharmacy and ICMR, Belagavi.
Selection of wavelength
Methanol was selected for the preparation of the standard stock solution because Curcumin and Azadirachtin both are soluble in methanol. In the combination of Curcumin and Azadirachtin the standard solution was prepared and 3 μl/spot is applied on the stationary phase and plate is developed, scanned under 254 nm using deuterium and tungsten lamp.
Preparation of stock solution
An accurately weighed 2 mg of Curcumin and 10 mg of Azadirachtin was taken in clean and dried 10 ml volumetric flask and dissolved in methanol then volume is made using the same. This was considered as standard stock solution having concentration of 200 μg/ml for Curcumin and 1000 μg/ml for Azadirachtin.
Preparation of calibration curve
From the standard stock solution containing concentrations of 1.5-15 μl/spot were applied on the stationary phase. Then the plate is developed using the mobile phase. After the development the plate is dried and scanned under 254 nm using deuterium and tungsten lamp. Linearity curve was plotted as Concentration (μl/spot) on x-axis and Area on y-axis and linear regression equation was calculated.
Method development and validation
Curcumin and Azadirachtin found to be soluble in methanol. Therefore, this solvent was used for the determination of detection wavelength and working concentration of standard. International Conference on Harmonization (ICH) has provided guidelines i.e. Q2(R1) for validation of analytical method which defines this process as characteristic performance that is established by laboratory studies. Developed method was validated according to the ICH guidelines for the validation of analytical procedures in order to prove the suitability of method using method parameters [7-10].
Specificity
The chromatogram of standards is obtained and there was no any interference of mobile phase and hence it indicates that the developed method is specific.
Linearity
Linearity was examined in the range of 1.5-15 μl/spot. An accurately weighed 2 mg of Curcumin and 10 mg of Azadirachtin was taken in clean and dried 10 ml volumetric flask and dissolved in methanol then volume is made using the same. This was considered as standard stock solution having concentration of 200 μg/ml for Curcumin and 1000 μg/ml for Azadirachtin.
LOD and LOQ
Limit of detection is concentration at which analyte in the test sample is detected. Limit of quantification is the concentration at which analyte in the test sample is quantified. By using the following formula LOD and LOQ are calculated.
LOD=3.3 × standard deviation of regression
Slope
LOQ=10 × standard deviation of regression
Slope
Precision
In order to determine system precision three replicates of solution containing 3 μl/spot, 9 μl/spot and 15 μl/spot of combination standard stock solution of Curcumin and Azadirachtin were applied on the stationary phase, plate is developed and scanned. Area of each application was measured at 254 nm using deuterium and tungsten lamp and %RSD (Relative Standard Deviation) was calculated.
Method Precision was determined by performing assay of sample under the tests of
1) Intraday precision
2) Interday precision
For Intraday Precision three replicates of solution containing concentration 3 μl/spot, 9 μl/spot, and 15 μl/spot of standard stock solution is analyzed and %RSD was calculated at different time intervals on the same day. For Interday Precision three replicates of solution containing concentration 3 μl/spot, 9 μl/ spot, and 15 μl/spot of standard stock solution is analyzed and %RSD was calculated on three consecutive days.
Ruggedness
Ruggedness was determined by performing the same proposed method on same instrument by different analyst to check the reproducibility.
Robustness
Robustness is done by changing the ratio of the mobile phase
Accuracy
Accuracy was determined by performing recovery experiments in which determination of % mean recovery of sample by standardization method at three different levels 50%, 100% and 150% of the sample solutions were prepared. An accurately weighed 2 mg of Curcumin and 10 mg of Azadirachtin was taken in clean and dried 10 ml volumetric flask and dissolved in methanol then volume is made using the same. At each level three replicates of concentration (ng/spot) solution was prepared and recovery study was carried out.
Analysis of marketed formulation
The validated method was applied for the determination of Curcumin and Azadirachtin in marketed formulation. Twenty capsules were weighed and calculated the average weight of capsule. The amount of drug in sample was in good agreement with the label claim of the formulation. Percent assay of Curcumin and Azadirachtin was found to be 92.95% and 91.79% respectively.
Quantification
The test sample applied and chromatograms are obtained under the same conditions as per the standard drug. The area of the standard Curcumin and Azadirahtin recorded and with the help of the calibration plot regression equation is obtained for both the drugs.
Method development
HPTLC method was developed by using CAMAG HPTLC instrument using a solvent system Toluene:Ethyl acetate:Ammonia:Formic acid (4:3:2.5:0.5 v/v/v/v) at 254 nm and details of method developed were presented in Table 1 [11-14].
| Sr.No. | Parameters | Specifications |
|---|---|---|
| 1 | Method | HPTLC |
| 2 | Instrument | HPTLC |
| 3 | Make | CAMAG |
| 4 | Software | Win cats and Vision cat |
| 5 | Drug | Curcumin, Azadirachtin |
| 6 | λ max | 254 nm |
| 7 | Solvent System | Toluene:Ethyl acetate:Ammonia:Formic acid (4:3:2.5:0.5 v/v/v/v) |
Table 1: Developed method parameters.
Method validation
Developed method was validated in terms of validation parameters such as specificity, linear range, precision, robustness, ruggedness and reproducibility as per ICH guidelines.
Specificity
The chromatogram of standards is obtained and there was no any interference of mobile phase and hence it indicates that the developed method is specific.
Linearity
As mentioned in the above method the linearity range was found to be 1.5-15 μl/spot. The linearity graph is given in Figure 3, the linearity and range is given in Tables 2 and 3. The calibration curves are given in Figures 4 and 5.
| Sr. No. | Concentration | Area | |
|---|---|---|---|
| (µl/spot) | CUM | ADT | |
| 1 | 1.5 | 1665.6 | 677.6 |
| 2 | 3 | 2746.3 | 1119.6 |
| 3 | 6 | 5297.7 | 1764.9 |
| 4 | 9 | 7817.7 | 2545.5 |
| 5 | 12 | 10106.6 | 3314.76 |
| 6 | 15 | 12548.9 | 3984.9 |
| r2 | 0.999 | 0.999 | |
| Slope | 818.8 | 244.8 | |
| LOD | 0.38321 | 0.46572 | |
| LOQ | 1.16125 | 1.41127 | |
Table 2: System precision data of Curcumin and Azadirachtin.
| Concentration (µl/spot) | Area | Standard deviation | %Relative standard deviation | |||
|---|---|---|---|---|---|---|
| CUM | ADT | CUM | ADT | CUM | ADT | |
| 3 | 2881.6 | 1423.9 | ||||
| 3 | 2889.7 | 1419.3 | ||||
| 3 | 2883.1 | 1417.1 | 3.3193 | 2.5354 | 0.12% | 0.18% |
| 3 | 2887.9 | 1421.5 | ||||
| 3 | 2889.1 | 1419.9 | ||||
| 3 | 2885.3 | 1423.1 | ||||
Table 3: Intraday precision data of Curcumin and Azadirachtin.
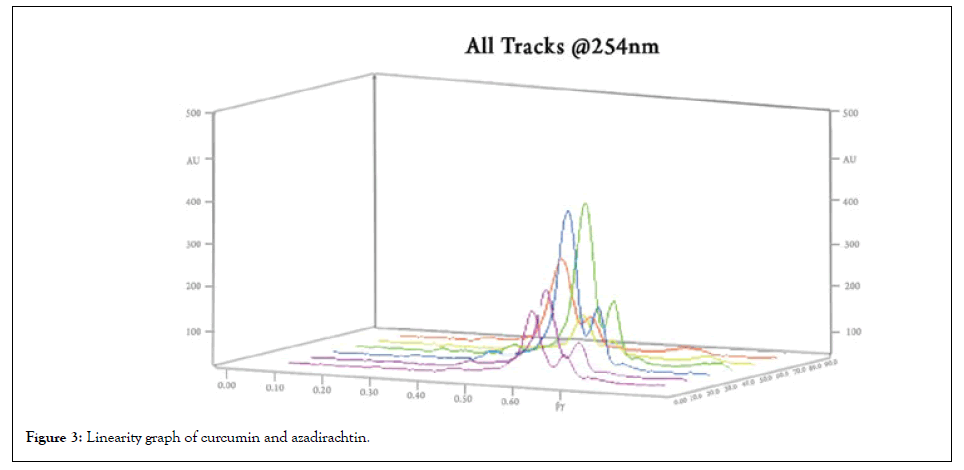
Figure 3: Linearity graph of curcumin and azadirachtin.
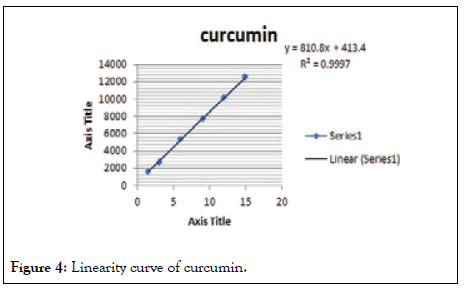
Figure 4: Linearity curve of curcumin.
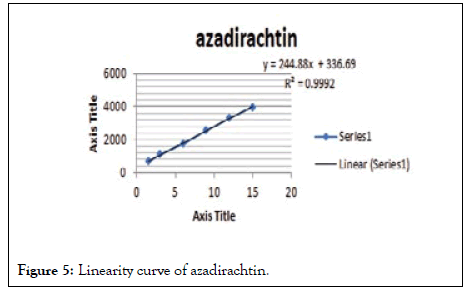
Figure 5: Linearity curve of azadirachtin.
Precision
System precision: As mentioned in the method in order to determine system precision three replicates of solution containing 3 μl/spot, 9 μl/spot and 15 μl/spot of combination standard stock solution of Curcumin and Azadirachtin were applied on the stationary phase, plate is developed and scanned. Area of each application was measured at 254 nm using deuterium and tungsten lamp and %RSD (Relative Standard Deviation) was calculated [15].
Intraday precision: For intraday precision three replicates of solution containing 3 μl/spot, 9 μl/spot and 15 μl/spot of combination standard stock solution of Curcumin and Azadirachtin were applied on the stationary phase, plate is developed and scanned. Area of each application was measured at 254 nm using deuterium and tungsten lamp and %RSD was found to be less than 2% (Table 4) [16-19].
| Conc. (µl/spot) | Area* | Standard deviation | %Relative standard deviation | ||||
|---|---|---|---|---|---|---|---|
| Interval | CUM | ADT | CUM | ADT | CUM | ADT | |
| 3 | Area 1 Hr | 2875.23 | 1421.39 | 3.828 | 3.2047 | 0.13% | 0.23% |
| Area 4 Hr | 2934.16 | 1419.73 | 3.139 | 1.92 | 0.11% | 0.14% | |
| Area 8 Hr | 2867.76 | 1407.03 | 5.777 | 2.8095 | 0.20% | 0.20% | |
| 9 | Abs 1 Hr | 7585.39 | 3454.79 | 2.0952 | 4.4238 | 0.03% | 0.13% |
| Abs 4 Hr | 7592.86 | 3370.83 | 2.3756 | 2.3459 | 0.03% | 0.07% | |
| Abs 8 Hr | 7415.7 | 3449.9 | 4.2 | 1.7436 | 0.06% | 0.05% | |
| 15 | Abs 1 Hr | 11082.8 | 4895.76 | 3.1134 | 3.7899 | 0.03% | 0.08% |
| Abs 4 Hr | 11045.2 | 4994.93 | 3.9463 | 2.829 | 0.04% | 0.06% | |
| Abs 8 Hr | 11058.4 | 4890.63 | 2.4987 | 1.222 | 0.02% | 0.02% | |
Note: *=Average area of three replicates
Table 4: Intraday precision data of Curcumin and Azadirachtin.
Interday precision: For Interday precision three replicates of solution containing 3 μl/spot, 9 μl/spot and 15 μl/spot of combination standard stock solution of Curcumin and Azadirachtin were applied on the stationary phase and %RSD was calculated on three consecutive days. And the calculated %RSD was found to be less than 2% (Tables 5-9).
| Conc. (µl/spot) | Area* | Standard deviation | % Relative standard deviation | ||||
|---|---|---|---|---|---|---|---|
| CUM | ADT | CUM | ADT | CUM | ADT | ||
| 3 | Day 1 | 2875.23 | 1421.39 | 3.828 | 3.2047 | 0.13% | 0.23% |
| Day 2 | 2892.07 | 1411.6 | 3.2254 | 1.6523 | 0.11% | 0.12% | |
| Day 3 | 2882.37 | 1432.97 | 2.8449 | 2.7737 | 0.10% | 0.19% | |
| 9 | Day 1 | 7585.39 | 3454.79 | 2.0952 | 4.4238 | 0.03% | 0.13% |
| Day 2 | 7386.2 | 3348.63 | 4.4441 | 2.9484 | 0.06% | 0.09% | |
| Day 3 | 7379.63 | 3359.8 | 2.2121 | 2.0809 | 0.03% | 0.06% | |
| 15 | Day 1 | 11082.8 | 4895.76 | 3.1134 | 3.7899 | 0.03% | 0.08% |
| Day 2 | 11052.4 | 5014.1 | 1.3317 | 2.8213 | 0.01% | 0.06% | |
| Day 3 | 11047 | 5019.93 | 2.3861 | 1.2662 | 0.02% | 0.03% | |
Note: *=Average area of three replicates.
Table 5: Interday precision data of Curcumin and Azadirachtin.
Ruggedness
Ruggedness was determined by performing the same proposed method by different analyst to check the reproducibility which showed %RSD less than 2% and indicates that the method developed is rugged (Table 6).
| Concentration (µl/spot) | Analyst | Area* | Standard deviation | % Relative standard deviation | |||
|---|---|---|---|---|---|---|---|
| CUM | ADT | CUM | ADT | CUM | ADT | ||
| 3 | Analyst 1 | 2867.76 | 1407.03 | 5.777 | 2.8095 | 0.20% | 0.20% |
| Analyst 2 | 2892.07 | 1411.6 | 3.2254 | 1.6523 | 0.11% | 0.12% | |
| 9 | Analyst 1 | 7415.7 | 3449.9 | 4.2 | 1.7436 | 0.06% | 0.05% |
| Analyst 2 | 7386.2 | 3348.63 | 4.4441 | 2.9484 | 0.06% | 0.09% | |
| 15 | Analyst 1 | 11058.4 | 4890.63 | 2.4987 | 1.222 | 0.02% | 0.02% |
| Analyst 2 | 11052.4 | 5014.1 | 1.3317 | 2.8213 | 0.01% | 0.06% | |
Note:*=Average area of three replicates.
Table 6: Ruggedness data of Curcumin and Azadirachtin.
Robustness
Robustness is done by changing the mobile phase ratio i.e. Toluene:Ethyl acetate:Ammonia:Formic acid (4:3:2.6:0.4 v/v/v/ v), Toluene:Ethyl acetate:Ammonia:Formic acid (4:3:2.5:0.5 v/v/ v/v) and Toluene:Ethyl acetate:Ammonia:Formic acid (4:3:2.4:0.6 v/v/v/v).. The %RSD was found to be less than 2% (Table 7).
| Conc (µl/spot) | Change in Mobile phase ratio | Area* | Standard deviation | % Relative standard deviation | |||
|---|---|---|---|---|---|---|---|
| CUM | ADT | CUM | ADT | CUM | ADT | ||
| 3 | T:EA:A:FA | 2934.16 | 1419.73 | 3.139 | 1.92 | 0.11% | 0.14% |
| (4:3:2.6:0.4) | |||||||
| T:EA:A:FA | 2875.23 | 1421.39 | 3.828 | 3.2047 | 0.13% | 0.23% | |
| (4:3:2.5:0.5) | |||||||
| T:EA:A:FA | 2867.76 | 1407.03 | 5.777 | 2.8095 | 0.20% | 0.20% | |
| (4:3:2.4:0.6) | |||||||
| 9 | T:EA:A:FA | 7592.86 | 3370.83 | 2.3756 | 2.3459 | 0.03% | 0.07% |
| (4:3:2.6:0.4) | |||||||
| T:EA:A:FA | 7585.39 | 3454.79 | 2.0952 | 4.4238 | 0.03% | 0.13% | |
| (4:3:2.5:0.5) | |||||||
| T:EA:A:FA | 7415.7 | 3449.9 | 4.2 | 1.7436 | 0.06% | 0.05% | |
| (4:3:2.4:0.6) | |||||||
| 15 | T:EA:A:FA | 11045.2 | 4994.93 | 3.9463 | 2.829 | 0.04% | 0.06% |
| (4:3:2.6:0.4) | |||||||
| T:EA:A:FA | 11082.8 | 4895.76 | 3.1134 | 3.7899 | 0.03% | 0.08% | |
| (4:3:2.5:0.5) | |||||||
| T:EA:A:FA | 11058.4 | 4890.63 | 2.4987 | 1.222 | 0.02% | 0.02% | |
| (4:3:2.4:0.6) | |||||||
Note:*=Average area of three replicates.
Table 7: Robustness data of Curcumin and Azadirachtin.
Accuracy
Accuracy was determined by performing recovery experiments in which determination of % mean recovery of sample by standardization method at three different levels 50%, 100% and 150% of the sample solutions were prepared. And the percent recovery is found in the range of 91-109% for Azadirachtin and 91%-105% for Curcumin (Tables 8 and 9) [20-22].
| Total concentration | Standard concentration | Sample concentration | Area (254 nm) | Concentration | Sample concentration difference | % Recovery | |
|---|---|---|---|---|---|---|---|
| (ng/spot) | (ng/spot) | (ng/spot) | Standard | Sample | (ng/spot) | (ng/spot) | |
| 600 -50% | 200 | 400 | 2947.2 | 2778.9 | 565.73 | 365.73 | 91.43% |
| 200 | 400 | 2947.2 | 2784.3 | 566.83 | 366.83 | 91.70% | |
| 200 | 400 | 2947.2 | 2774.5 | 564.84 | 364.84 | 91.21% | |
| 1200 -100% | 200 | 1000 | 5234.2 | 5068.2 | 1161.94 | 961.19 | 96.11% |
| 200 | 1000 | 5234.2 | 5073.5 | 1163.15 | 963.15 | 96.32% | |
| 200 | 1000 | 5234.2 | 5063.7 | 1160.91 | 960.91 | 96.09% | |
| 1800 -150% | 200 | 1600 | 7387.7 | 7661.3 | 1866.66 | 1666.62 | 104.16% |
| 200 | 1600 | 7387.7 | 7669.1 | 1868.56 | 1668.56 | 104.28% | |
| 200 | 1600 | 7387.7 | 7668.4 | 1868.39 | 1668.39 | 104.27% | |
Table 8: Recovery data of Curcumin.
| Total concentration (ng/spot) |
Standard concentration (ng/spot) |
Sample concentration (ng/spot) |
Area (254 nm) | Concentration (ng/spot) |
Sample concentration difference (ng/spot) |
%Recovery | |
|---|---|---|---|---|---|---|---|
| Standard | Sample | ||||||
| 3000 (50%) |
1000 | 2000 | 1404.6 | 1469.8 | 3139 | 2139.2 | 106.96% |
| 1000 | 2000 | 1404.6 | 1483.0 | 3167.4 | 2167.4 | 108.37% | |
| 1000 | 2000 | 1404.6 | 1488.2 | 3178.55 | 2178.55 | 108.92% | |
| 6000 (100%) |
1000 | 5000 | 2439.2 | 2272.0 | 5588.71 | 4588.71 | 91.77% |
| 1000 | 5000 | 2439.2 | 2273.5 | 5592.4 | 4592.4 | 91.84% | |
| 1000 | 5000 | 2439.2 | 2279.4 | 5606.9 | 4606.9 | 92.13% | |
| 9000 (150%) |
1000 | 8000 | 3359.7 | 3321.6 | 8897.93 | 7897.93 | 98.72% |
| 1000 | 8000 | 3359.7 | 3319.7 | 8892.84 | 7892.84 | 98.66% | |
| 1000 | 8000 | 3359.7 | 3328.5 | 8916.42 | 7916.42 | 98.95% | |
Table 9: Recovery data of Azadirachtin.
Quantification
Sample peaks were identified. The result of analysis proved that the content of Curcumin and Azadirachtin can be quantified [22].
It can be concluded that the developed method for the simultaneous estimation of Curcumin and Azadirachtin. In marketed formulation is simple, sensitive, accurate, precise, and reproducible. The excipients of the commercial sample analyzed did not interfere in the analysis, which proved the specificity of the methods for this formulation.
The authors are thankful to Principal Dr. S. S. Jalalpure and Vice Principal Dr. M. B. Patil and director of ICMR and BSRC for their support and guidance. Authors are thankful to Mr. Nikhil Gawas, Mr. Onkar Supe and Mr. Prathamesh Katte for helping during the research work.
The authors have no conflict of interest.
[Cross Ref] [Google scholar] [Pub Med]
[Cross Ref] [Google scholar] [Pub Med]
Citation: Hiremath SI, Palled MS, Joshi RK, Chouhan MK, Suryawanshi SS (2022) Development and Validation of HPTLC Method for the simultaneous Estimation of Curcumin and Azadirachtin.J Chromatogr Sep Tech. 13:483.
Received: 11-May-2022, Manuscript No. JCGST-22-17321; Editor assigned: 16-May-2022, Pre QC No. JCGST-22-17321 (PQ); Reviewed: 30-May-2022, QC No. JCGST-22-17321; Revised: 06-Jun-2022, Manuscript No. JCGST-22-17321 (R); Published: 13-Jun-2022 , DOI: 10.35248/2157-7064.22.13.483
Copyright: © 2022 Hiremath SI, et al. This is an open-access article distributed under the terms of the Creative Commons Attribution License, which permits unrestricted use, distribution, and reproduction in any medium, provided the original author and source are credited.