Journal of Medical Diagnostic Methods
Open Access
ISSN: 2168-9784
ISSN: 2168-9784
Research Article - (2023)Volume 12, Issue 2
In this article we reported, a novel methodology for the detection of Mycobacterium tuberculosis (M. tuberculosis) infection in human that causes pulmonary tuberculosis; based on identifying specific breath biomarkers or VOC profile in the exhaled breath. On performing the gas chromatography/mass spectroscopy analysis for the biomarkers gave the different VOC patterns for the 2 group i.e., normal persons and the persons infected with the Mycobacterium tuberculosis. Based on these results a micro electro mechanical system technology is developed in the form of biological and chemical based micro cantilever sensors. This technique can enable efficient and non invasive detection for the early detection of pulmonary tuberculosis and can form the real time human surveillance system. Generally the breath biomarkers of active pulmonary TB in human are: Oxetane, 3-(1-methylene) dodecane, 4-methyl cyclohexane, 1, 3, 5- trimethyl decane, 3, 7-dimethyl heptanes, 1-nonane, 4, 6, 8-trimethyl heptanes.
Pulmonary tuberculosis; GC-MS system; Cantilevers; Breathe analysis; Pattern recognition analysis; Biomarkers (volatile organic compounds)
Tuberculosis is one of the top 10 causes of death and the leading cause from a single infectious agent (above HIV/AIDS). The causative agent of Tuberculosis (TB), an airborne infectious disease caused by organisms of the Mycobacterium tuberculosis complex, was discovered by Robert Koch in 1882. Tuberculosis is still the biggest cause of illness and mortality in 2016, especially in low and middle income nations. Tuberculosis can spread throughout the body and cause sickness. Furthermore, tuberculosis can manifest itself in a variety of ways, ranging from asymptomatic infection to life-threatening disease. Patients with tuberculosis are pragmatically defined as having Latent Tuberculosis Infection (LTBI), which is an asymptomatic and non infectious illness or active TB disease, which is communicable (in active pulmonary TB) and for which molecular or culture based diagnostics can be used. Fever, exhaustion, loss of appetite and weight loss are common symptoms of active tuberculosis, and patients with lung illness may develop a chronic cough and hemoptysis (coughing up blood) as the disease develops. Asymptomatic is the best way to describe it. Isoniazid, rifampin, pyrazinamide and ethambutol are the four first line antibiotics used to treat tuberculosis. It is possible to develop resistance to any medicine. Indeed, Multi Drug Resistant Tuberculosis (MDRTB), defined as tuberculosis resistance to at least isoniazid and rifampicin, is a well-known disease that has been recorded in almost every country. TB illness is resistant to isoniazid, rifampin, any fluoroquinolone, and any of the three second line injectable aminoglycosides, as well as any of the three second line injectable aminoglycosides. LTBI and active TB, as well as drug sensitive and drug resistant TB, have different diagnostic and treatment options [1].
According to the world health organization, 9.6 million individuals contracted active TB in 2014, with 5 million of them dying. The burden of TB is unevenly distributed than in the United States (cases per 100,000 people per year) (3 cases per 100,000 population per year). The risk then rises during adolescence, leveling off at the age of 25 and remaining high throughout adulthood. Active TB illness affects almost twice as many women as it does males and children account for around 10% of all new cases globally. HIV infection is the strongest known risk factor for tuberculosis; HIV-positive patients account for 12% of all new active TB infections and 25% of all TBrelated fatalities. The bulk of active HIV-associated TB infections and fatalities (75 percent) take place in Africa. In reality, active TB was found to be the primary cause in a systematic study [2].
As early as 1970, Volatile Organic Compounds (VOCs) in the air we breathe were discovered to be a non invasive predictor of a person's health. Hydrocarbons, alcohols, ketones and aldehydes are all present in human emissions in amounts ranging from ppb to ppm. VOCs have been difficult to quantify due to high CO2 concentrations (usually 4%) and water in human breath.10 recent study has begun to assemble a more complete data set on human emissions using Proton Transfer Reaction Mass Spectrometry (PTR-MS) technology, selected ion flow tube technique, high pressure liquid chromatography, Gas Chromatography (GC) and GC-Mass (GC/MS) spectrometry methods [3].
Despite its benefits, VOC profiling based diagnoses are not frequently employed in clinical practice. VOCs are generated in the body, travel through the blood and then pass the alveolar contact and emerge in the exhaled breath, measured in trace quantities of millions by volume (ppmv) and parts per billion by volume (ppbv) or less. The mouth cavity does not necessarily enter the circulation; instead, it is seen in the exhaled air. By analyzing the concentration of VOCs in the breath using cantilever; gives an indicator of metabolic condition, allowing you to distinguish between healthy and pathological states. As a result, these approaches have the ability to diagnose illnesses in their early stages in a non invasive and painless manner. Micro Electromechanical Systems (MEMS) have just recently appeared [4]. Micro-cantilevers are the most basic MEMS components. Researchers have investigated several uses of micro cantilevers in sensor technology. Scientists are working on a tiny biochip based on a series of micro cantilevers that can detect many illnesses typically identified in the clinical laboratory at the same time. The development of nano cantilevers has recently lowered the technology's capacity to detect ultra sensitive analytes with great performance [5].
Software setup
• Matlab in thing speak
• Basic working software for cantilevers
• Basic and advance excel software
• Design of the sensing platform and its calibration
Cantilever gas sensor: It includes a standard hotplate MOX sensor as well as a tiny microprocessor that regulates board performance, measures analog voltages and offers an I2C interface for reading. This section measures eCO2 (equivalent computed carbon dioxide) concentrations ranging from 400 parts per million (ppm) to 8192 parts per million (ppm) and TVOC (Total Volatile Organic Compound) concentrations ranging from 0 parts per billion (ppb) to 1187 parts per billion (ppb). It can detect alcohols, aldehydes, ketones, organic acids and amines, as well as aliphatic and aromatic hydrocarbons, according to the datasheet. This sensor, like all VOC/gas sensors, exhibits variability and that is why it is calibrated to provide reliable data. Calibration is done against recognized sources [6].
The various unique gas detection layers are put to the head surface of the various cantilever ends. If physical or chemical adsorption occurs between the detected gas and the detection material, the mechanical reaction of the micro cantilever is influenced, which includes voltage change, temperature conversion and mass change, among other things. The data are recorded and evaluated using the electrical signal from the transducer. Bending the cantilever beam describes the change in the resonance frequency of the cantilever which can be directly co related to the change in mass. Another mechanism is when a gas molecule is adsorbed on the surface of a micro cantilever, the mass of the beam grows while the response frequency drops and i.e., the change in mass can also be achieved by altering the response frequency of the micro cantilever [7].
Breadboard and wires: The jumper wires with the crocodile clips are used to interconnect the components of the instrument like cantilever gas sensor, raspberry pi, digital display, etc to avoid soldering. These wires are connected with the help of a stripboard type breadboard to make it easy for creating temporary prototypes and experimenting with circuit design [8].
Arduino UNO: It is built on Atmel's 8-bit ATmega 328 microprocessor (microchip technology). The Atmega 328 has a built in bootloader, making it simple to flash the nano board with software. The Arduino UNO has a DC power connector and is charged via a MiniB USB cable rather than a normal cable [9].
Raspberry pi 4B: The Raspberry Pi 4 Model B is the most recent model of the low cost raspberry pi computer. The Pi is not a normal gadget; it is the cheapest, has no cover and is merely a credit card sized electrical circuit board similar to those found in PCs and laptops, but considerably smaller. It is a powerful small gadget that allows to investigate computer science and learn to code in languages such as scratch and python [10].
UV lights: The UV lights are used for their intense bactericidal property. In total 3 UV lights wavelength ranging from 240 nm to 280 nm are used considering the size of a compartment of detection. It removes all the residual infectious molecules and make the compartment sterile for the next sample analysis [11].
Vacuum pump: Vacuum pump of capacity 25 kPa is used to remove all the gaseous particles from the detection compartment. It takes almost 2-5 minutes to empty the space. The circuit of vacuum is also connected to the circuit of UV lights. So the simultaneous process of suction and disinfection occurs [12].
Sample collection: The samples are collected with the specific patient monitoring protocol to avoid errors and the data is then analyzed by developed pattern recognition software.
Kynar tedlar bags: The tedlar bag is used to collect gas or air samples for testing purposes. It is used to collect VOCs, CO2 and other effluent gas samples. The kit is made of PVF (Polyvinyl Fluoride) film, which can withstand high temperatures. The tedlar is the brand name for PVF. As a result, it is known as a tedlar bag. The film has a thickness of 2 mili. For gas sampling, the tedlar bag features a pure Polypropylene (PP) valve and an SS valve. Depending on the application, a PTFE valve may alternatively be employed. The valve utilized in the bag is dual (2 in 1) in operation, making sampling simple. There are also twin valve tedlar bags that can be used [13].
Calibration
For the mass sensitive detection of volatile organic chemicals, the detection behavior of polymer coated resonant cantilevers was explored. Industrial Complementary Metal Oxide (CMOS) Semiconductor technology was employed, along with later CMOS-compatible micromachining, to develop a system of individual chips containing transducers and the essential signal line and processing circuits. To characterize the mass detection mechanism of polymer coated resonance cantilevers, an analytical model was constructed [14].
Automatic Baseline Calibration (ABC): The assumption behind ABC is that a room is vacant at some period each day. The CO2 level should recover to 400 ppm, which is the same as the amount found in outside air. By recording the lowest CO2 measurements obtained over several days in EPROM memory, an offset of 400 ppm could be calculated and subsequently added or removed from the displayed CO2 value. An example application is the quantitative analysis of a binary mixture using a four cantilever matrix. The test results are shown to forecast the concentration of an n octane/toluene combination. Finally, the detection limit reached using cantilever sensors was found to be equivalent to that of other gas sensors based on sound waves [15].
Validation
The calibrated instrument is then validated by taking the different ratios. The test results are given to predict the different concentrations of mixtures. Finally, the detection limit is achieved with the cantilever gas sensor.
Breathe sample collection
After the calibration and validation of the instrument, the patient’s breath samples were taken for analysis. For the sample collection, tedlar bags with 1 L capacity are used. Patients are selected irrespective of age, weight, gender and race. Breath samples of normal patients, TB-ve patients and Tb+ve patients are collected for the analysis. For every selected category we collected 20 samples.
Data analysis
Obtaining useful characteristics of gas is the aim of the data pre processing to increase the recognition effect of the neural network and appropriate data of input and output in the neural network training are prepared at the same time. The data is recorded and evaluated using the electrical signal from the transducer. Change in the resonance frequency of the cantilever which can be directly co related to the change in mass. This change in mass output is then analyzed by pattern recognition software. As we proceeded, we found that there are distinctive changes in the eCO2 and TVOC measurements between normal persons and patients with viral cough and cold. These significant results motivated to go for the analysis of the breaths of TB+ve patients. As we expected the results were distinctive from the earlier two categories i.e., normal persons and persons with viral cough and cold.
Instrumentation: The block diagram of the TB detection machine is shown in the Figure 1 below. The instrumental setup is given in the Figures 1 and 2.
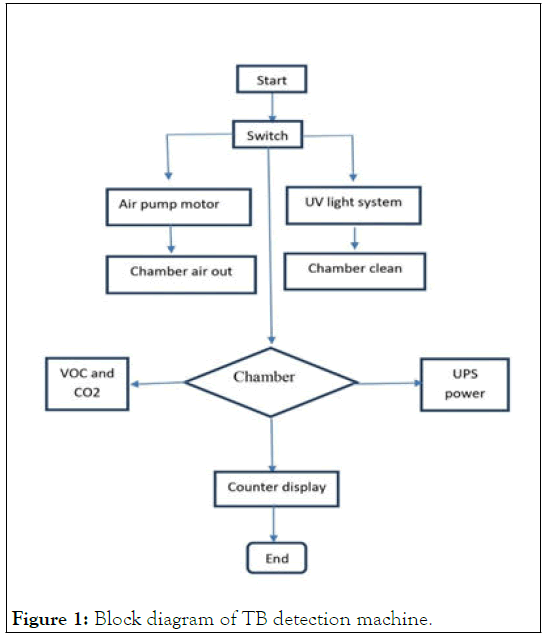
Figure 1: Block diagram of TB detection machine.
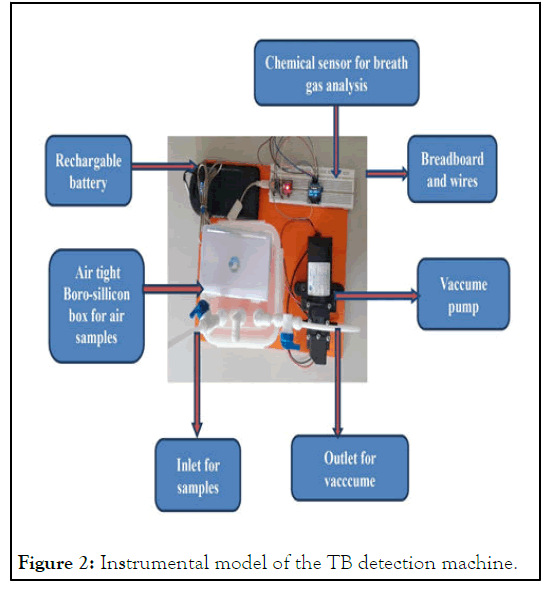
Figure 2: Instrumental model of the TB detection machine.
The readings of calibration and validation of the instrument by taking different gaseous mixtures are given below (Tables 1,2 and Figures 3,4).
| n-octane (ml) | TVOC (ppm) |
|---|---|
| 30 | 402 |
| 20 | 401 |
| 15 | 399 |
| 10 | 398 |
| 5 | 396 |
Table 1: TVOC readings of n-octane at different concentrations.
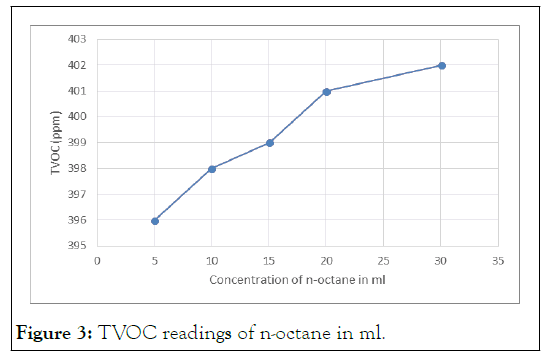
Figure 3: TVOC readings of n-octane in ml.
| Toluene (ml) | TVOC (ppm) |
|---|---|
| 30 | 502 |
| 20 | 501 |
| 15 | 498 |
| 10 | 496 |
| 5 | 493 |
Table 2: TVOC readings of toluene at different concentrations.
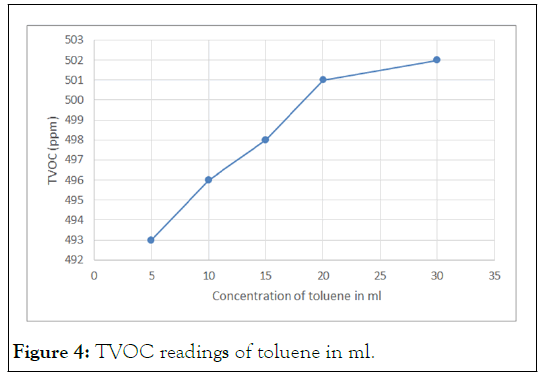
Figure 4: TVOC readings of toluene in ml.
The observation table for Tb+ve, TB-ve patients and normal persons is shown below in Tables 3-5.
| Sr. no. | Clinical diagnosis | Age | Gender | Weight | Machine reading | |||
|---|---|---|---|---|---|---|---|---|
| Instant peak 0 | After 10 sec | |||||||
| TVOC | CO2 | TVOC | CO2 | |||||
| 1 | TB+ve | 42 | M | 65 | 61 | 789 | 57 | 740 |
| 2 | TB+ve | 61 | M | 55 | 66 | 756 | 61 | 701 |
| 3 | TB+ve | 32 | F | 50 | 69 | 889 | 62 | 831 |
| 4 | TB+ve | 70 | F | 40 | 66 | 673 | 59 | 615 |
| 5 | TB+ve | 60 | M | 55 | 70 | 746 | 63 | 698 |
| 6 | TB+ve | 72 | M | 56 | 60 | 689 | 53 | 611 |
| 7 | TB+ve | 18 | F | 56 | 63 | 566 | 57 | 509 |
| 8 | TB+ve | 22 | F | 41 | 68 | 664 | 62 | 619 |
| 9 | TB+ve | 81 | F | 52 | 59 | 765 | 55 | 720 |
| 10 | TB+ve | 56 | M | 58 | 69 | 784 | 64 | 731 |
| 11 | TB+ve | 70 | M | 62 | 66 | 678 | 60 | 617 |
| 12 | TB+ve | 61 | F | 50 | 68 | 786 | 62 | 734 |
| 13 | TB+ve | 52 | F | 66 | 63 | 789 | 57 | 725 |
| 14 | TB+ve | 59 | M | 70 | 75 | 739 | 69 | 655 |
| 15 | TB+ve | 34 | F | 75 | 52 | 759 | 49 | 684 |
| 16 | TB+ve | 19 | M | 59 | 59 | 798 | 54 | 735 |
| 17 | TB+ve | 39 | F | 62 | 60 | 678 | 53 | 633 |
| 18 | TB+ve | 45 | F | 69 | 64 | 693 | 57 | 610 |
| 19 | TB+ve | 56 | F | 70 | 78 | 798 | 71 | 748 |
| 20 | TB+ve | 61 | F | 65 | 69 | 656 | 62 | 599 |
Table 3: TVOC and eCO2 data for the TB+ve patients.
| Sr. no. | Clinical diagnosis | Age | Gender | Weight | Machine reading | |||
|---|---|---|---|---|---|---|---|---|
| Instant peak 0 | After 10 sec | |||||||
| TVOC | CO2 | TVOC | CO2 | |||||
| 1 | TB-ve | 15 | M | 65 | 49 | 565 | 42 | 511 |
| 2 | TB-ve | 14 | M | 49 | 47 | 598 | 41 | 523 |
| 3 | TB-ve | 21 | M | 53 | 51 | 621 | 46 | 555 |
| 4 | TB-ve | 23 | F | 63 | 57 | 633 | 50 | 576 |
| 5 | TB-ve | 45 | F | 60 | 59 | 555 | 45 | 499 |
| 6 | TB-ve | 49 | F | 66 | 49 | 529 | 45 | 478 |
| 7 | TB-ve | 52 | F | 55 | 52 | 499 | 47 | 456 |
| 8 | TB-ve | 55 | M | 65 | 58 | 666 | 52 | 626 |
| 9 | TB-ve | 55 | M | 67 | 47 | 603 | 42 | 534 |
| 10 | TB-ve | 65 | F | 68 | 44 | 625 | 41 | 576 |
| 11 | TB-ve | 83 | M | 71 | 59 | 630 | 53 | 578 |
| 12 | TB-ve | 22 | M | 50 | 55 | 559 | 49 | 498 |
| 13 | TB-ve | 64 | F | 62 | 58 | 574 | 52 | 522 |
| 14 | TB-ve | 39 | M | 73 | 60 | 582 | 54 | 520 |
| 15 | TB-ve | 45 | M | 61 | 50 | 535 | 43 | 476 |
| 16 | TB-ve | 49 | M | 59 | 53 | 649 | 47 | 589 |
| 17 | TB-ve | 63 | F | 63 | 52 | 581 | 47 | 529 |
| 18 | TB-ve | 80 | F | 59 | 54 | 539 | 50 | 473 |
| 19 | TB-ve | 58 | M | 66 | 57 | 540 | 52 | 489 |
| 20 | TB-ve | 71 | F | 69 | 57 | 522 | 49 | 477 |
Table 4: TVOC and eCO2 data for the TB-ve patients.
| Sr.no. | Clinical diagnosis | Age | Gender | Weight | Machine reading | |||
|---|---|---|---|---|---|---|---|---|
| Instant peak 0 | After 10 sec | |||||||
| TVOC | CO2 | TVOC | CO2 | |||||
| 1 | Normal | 15 | M | 65 | 34 | 456 | 29 | 419 |
| 2 | Normal | 14 | M | 49 | 39 | 487 | 33 | 422 |
| 3 | Normal | 21 | M | 53 | 26 | 521 | 20 | 468 |
| 4 | Normal | 23 | F | 63 | 40 | 531 | 34 | 486 |
| 5 | Normal | 45 | F | 60 | 45 | 529 | 37 | 499 |
| 6 | Normal | 49 | F | 66 | 37 | 487 | 31 | 423 |
| 7 | Normal | 52 | F | 55 | 49 | 491 | 41 | 418 |
| 8 | Normal | 55 | M | 65 | 41 | 488 | 33 | 437 |
| 9 | Normal | 55 | M | 67 | 50 | 430 | 45 | 378 |
| 10 | Normal | 65 | F | 68 | 31 | 451 | 26 | 399 |
| 11 | Normal | 83 | M | 71 | 33 | 422 | 27 | 350 |
| 12 | Normal | 22 | M | 50 | 37 | 435 | 31 | 352 |
| 13 | Normal | 64 | F | 62 | 32 | 444 | 22 | 385 |
| 14 | Normal | 39 | M | 73 | 26 | 452 | 20 | 395 |
| 15 | Normal | 45 | M | 61 | 28 | 439 | 23 | 378 |
| 16 | Normal | 49 | M | 59 | 26 | 448 | 19 | 376 |
| 17 | Normal | 63 | F | 63 | 46 | 484 | 37 | 361 |
| 18 | Normal | 80 | F | 59 | 43 | 469 | 33 | 390 |
| 19 | Normal | 58 | M | 66 | 29 | 478 | 24 | 421 |
| 20 | Normal | 71 | F | 69 | 33 | 466 | 27 | 430 |
Table 5: TVOC and eCO2 data for the normal persons.
The TVOC data from cantilevers is analyzed using recording the pattern of each VOC generated and then analyzing it for normal and diseased person. As we were new to the use of cantilevers and how it generates the data, we applied the basic segregation strategy to the collected breath samples. In that we considered two levels; one is the peak reading, which will occur when the breath sample is fed to the instrument and the highest reading on the display is then noted. Second reading is the reading taken after the 10 seconds. It gave time to VOCs to get stabilize and then record the TVOCs.
The distinctive changes in above three tables can be identified by plotting the graphs shown in figure below. There are two graphs plotted for the TVOC and eCO2 readings respectively. The blue line is for the TB+ve patients, red one is for TB-ve patients and green line is for normal persons. These lines barely intersect each other this provide the distinct changes in the patterns quite effectively (Figures 5 and 6).
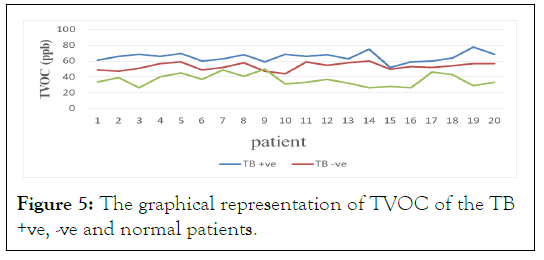
Figure 5: The graphical representation of TVOC of the TB +ve, -ve and normal patients.
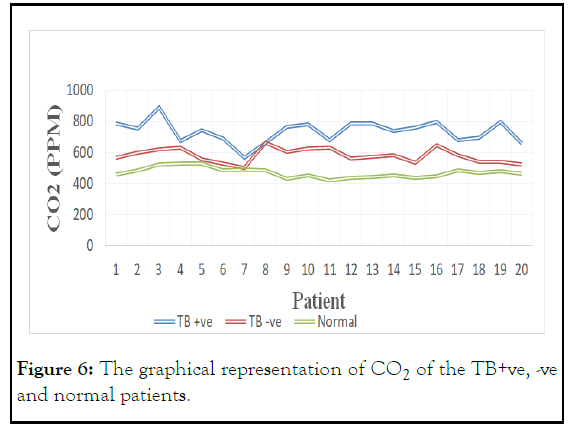
Figure 6: The graphical representation of CO2 of the TB+ve, -ve and normal patients.
From the observations got in the above tables we can conclude following things (Table 6).
| TVOC range | |
|---|---|
| TB+ve patient | 61 ppb-80 ppb |
| TB-ve patient | 41 ppb-60 ppb |
| Normal person | 21 ppb-40 ppb |
| CO2 range | |
| TB+ve patient | 650 ppb-850 ppm |
| TB-ve patient | 550 ppb-650 ppm |
| Normal person | 400 ppb-500 ppm |
Table 6: TVOC and CO2 readings.
As of now we have considered the TVOC and CO2 readings irrespective of the other parameters like age and gender. As we can see in the above two tables, there are some deviations in the data. Eg. the readings which are at the upper and lower limits of the range are very difficult to categorize into the three designated categories. But these can be removed with increase in the number of samples and more sophisticated data analysis and use of advanced software. Volatile organic compounds play vital role in diagnosis of several disease without any contamination or rupturing of cell or collecting the samples like blood, urine, feces. This method hence decrease the biological waste which may lead to spread of several diseases. The stability of chemical detectors is a vital issue for sensible applications. Common factors that influence the sensing signals include temperature, pressure, humidity and so on. As for the sensor employed in this work, the flow of air is an influencing factor. Nevertheless engineers now has come along with several modifications hence increasing its vulnerability to give accurate results. Overall, this novel sensing technology is suitable for rapid detection of various VOC’s and would be beneficial to many analytical fields such as environmental monitoring, medical diagnosis and hazardous material detection.
Calibrated instrument will show the early detection of pulmonary tuberculosis in persons suffering from it and the ones who are carriers; via data collected which is analysed by pattern recognition software. If things go satisfactory with the tuberculosis then this method can be used effectively for the detection of many other diseases special focus will be COVID-19. The distinct changes in the oxidative stress make the change in the VOC pattern; this makes it more effective in the diagnosis of diabetes through the breath analysis. This will help in overcoming the waste generated from strips. Lungs cancer is very difficult to diagnose in early stages and hence the treatment is delayed. But with the help of breath diagnosis one can easily diagnose in the early stages which will help in rapid recovery of the patient.
[Crossref] [Google Scholar] [PubMed]
[Crossref] [Google Scholar] [PubMed]
[Crossref] [Google Scholar] [PubMed]
[Crossref] [Google Scholar] [PubMed]
[Crossref] [Google Scholar] [PubMed]
[Crossref] [Google Scholar] [PubMed]
[Crossref] [Google Scholar] [PubMed]
[Crossref] [Google Scholar] [PubMed]
[Crossref] [Google Scholar] [PubMed]
[Crossref] [Google Scholar] [PubMed]
[Crossref] [Google Scholar] [PubMed]
[Crossref] [Google Scholar] [PubMed]
[Crossref] [Google Scholar] [PubMed]
Citation: Wagh B, Pandey V, Jain D (2023) Development of a Sensor Device with CMOS based Micro-cantilevers for the Detection of Pulmonary Tuberculosis through Breath Analysis. J Med Diagn Meth. 12:401.
Received: 19-Dec-2022, Manuscript No. JMDM-23-21008; Editor assigned: 22-Dec-2022, Pre QC No. JMDM-23-21008(PQ); Reviewed: 05-Jan-2023, QC No. JMDM-23-21008; Revised: 23-Mar-2023, Manuscript No. JMDM-23-21008(R); Published: 20-Apr-2023 , DOI: 10.35248/2168-9784.23.12.401
Copyright: © 2023 Wagh B, et al. This is an open-access article distributed under the terms of the Creative Commons Attribution License, which permits unrestricted use, distribution, and reproduction in any medium, provided the original author and source are credited.