Journal of Chromatography & Separation Techniques
Open Access
ISSN: 2157-7064
ISSN: 2157-7064
Short Communication - (2020)Volume 11, Issue 1
A simple, rapid and robust reverse phase HPLC method was developed and validated for the determination of impurities in Dolutegravir drug substance. The main aim of this study is to reduce the time consumption and to develop and validate a less expensive method by using HPLC. The chromatographic separation of Dolutegravir and its related impurities is carried out by using C8 column (150 × 4.6 mm), 5µm with 0.1% trifluoroacetic acid in water as mobile phase A, methanol as mobile phase B. The flow rate is 1.0 mL/min with gradient elution mode and the wave length for detection is 240 nm (UV detector). The developed method was validated and proved that the method was specific, accurate and precise as per ICH. The system suitability criteria found to be within the limits. The limit of detection and limit of quantification demonstrate that the method is sensitive. The linearity curve was found to be linear and the correlation coefficient obtained is not less than 0.998. The average percentage recoveries of impurities were in the range of 97 to 101%. The proposed method was found to be suitable and accurate for quantitative determination of impurities in Dolutegravir drug substance.
Dolutegravir; Impurities; Method development; Method validation; RP-HPLC; ICH
Dolutegravir belongs to a group of HIV drugs called ‘ integrase ’ inhibitors. Integrase inhibitors block HIV enzyme called integrase. By blocking integrase, integrase inhibitors prevent HIV from multiplying and can reduce the amount of HIV in the body. Dolutegravir is a prescription medicine approved by the U.S. Food and Drug Administration (FDA) for the treatment of HIV infection in combination with Rilpivirine (brand name: Edurant). Dolutegravir is chemically known as (4R,12aS)-N-(2,4- difluorobenzyl)-7-hydroxy-4-methyl-6,8-dioxo-3,4,6,8,12,12ahexahydro- 2H-pyrido[1',2':4,5]pyrazino[2,1-b][1,3]oxazine-9- carboxamide, its molecular formula is C20H19F2N3O5 and molecular weight is 419.38 g/mol. Dolutegravir (DTG), sold under the brand name Tivicay, is an antiretroviral medication, used together with other medication, to treat HIV/AIDS. It may also be used, as part of post exposure prophylaxis, to prevent HIV infection following potential exposure [1-3]. The structures of Dolutegravir and its impurities are shown in Figure 1.
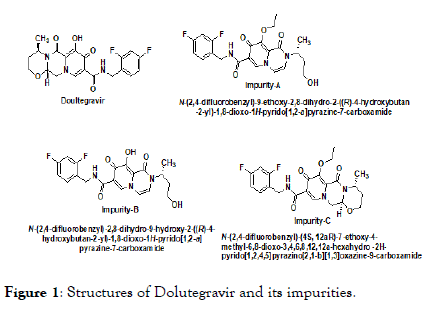
Figure 1. Structures of Dolutegravir and its impurities.
Impurity profiling of drug substances and products is a very critical task in the pharmaceutical industry under regulatory conditions [4-7]. The presence of unknown impurities, unwanted solvents, even at very low levels, may change the effect of drug efficiency and cause side effects. Therefore, impurity profile of drug substance and product should be carried out by using stability indicative analytical method.
High Performance Liquid chromatography is one of the effective separation analytical tools to determine and quantitate the impurities. By using HPLC, we can separate a mixture of compounds to identify and quantify into individual components. In literature survey, various quantification methods are available for the determination of Dolutegravir in combined dosage form [8-11].
Chandra Sekhar et al. separated Dolutegravir enantiomer and Diastereomer by using chiral RPLC [11]. Srinivas et al. reported the separation of Dolutegravir optical isomers by using chiral HPLC [12].
There is no literature available for the determination of impurities in Dolutegravir drug substance. In this present research work, a stability indicative HPLC method was developed for separation of impurities and degradation products by considering 0.1% as specification limit along with short run time and validated the method according to ICH guidelines [13-15].
In the process of developing impurities separation by HPLC method, different parameters were studied which influence the separation such as using different columns, different mobile phases and column temperatures. HPLC columns used for development of method were C18, C8 with different combination of mobile phases. In this development separation between impurities and Dolutegravir was not achieved. Hence we tried with Kromasil C8 column, trifluoroacetic acid buffer in different combination of mobile phase with organic solvents acetonitrile and methanol. Finally specific method was optimized in this column. Method was finalized with satisfactory resolution among all impurities with Mobile phase A is 0.1% of trifluoroacetic acid in water and mobile phase B is methanol with gradient elution.
Dolutegravir drug substance and related impurities were procured from Clearsynth laboratory. The HPLC grade methanol and acetonitrile procured from Rankem India Pvt. limited. Trifluoro acetic acid procured from Thermo scientific, India and Pure milli-Q water is used with the help of Millipore purification system (Millipore®, Milford, USA).
WATERS HPLC, Model: 2695 equipped with 2996 photo diode array detector was used for development and method validation, with an automated sample injector. Kromasil C8, 150 × 4.6 mm, 5 μm column was used for the separation. 0.1% of trifluoroacetic acid in water is used as mobile phase A and methanol is used as mobile phase B. Analysis was carried out in Gradient mode with flow rate of 1.0 mL/min and injection volume was 10 μL. The column temperature was 35°C, the run time was 20 min and the gradient programme is shown in Table 1. The data was acquired at 240 nm. The output signal was monitored and integrated using Empower 2 software.
| Time | Mobile phase A | Mobile phase B |
|---|---|---|
| 0 | 45 | 55 |
| 10 | 40 | 60 |
| 12 | 25 | 75 |
| 14 | 25 | 75 |
| 15 | 45 | 55 |
| 20 | 45 | 55 |
Table 1: Gradient Programme for separation of impurities from Dolutegravir.
Diluent
Mixed water and acetonitrile in the ratio of 50:50 v/v.
Sample solution preparation
A 25 mg of Dolutegravir was weighed, transferred to 50 mL volumetric flask, dissolved in 20 mL of diluent by sonication, made up to the mark with diluent and the resulting concentration of the solution is 0.5 mg/mL.
Impurities solution preparation (0.1%)
Stock solution-1: Each 10 mg of impurity-A, impurity-B and impurity-C were weighed and transferred to 100 mL volumetric flask, dissolved and made up to mark with diluent to give stock solution-1 (0.1 mg/mL).
Stock solution-2: From the above solution 1 mL is transferred into a 10 mL volumetric flask, volume was made up to mark with diluent to give a solution containing 0.01 mg/mL of Impurities. It is further diluted to 2.5 mL in 50 mL of diluent to give a solution containing 0.0005 mg/mL.
System suitability solution preparation
25 mg of Dolutegravir sample is weighed and transferred into 50 mL volumetric flask, dissolved in 20 mL of diluent by sonication, 2.5 mL of impurity stock solution-2 is added and is made up to the volume with diluent solution containing concentration of 0.5 mg/mL of Dolutegravir and 0.0005 mg/mL of each impurity.
Method validation
The validation of HPLC method was carried out for the determination of Impurity-A, Impurity-B and Impurity-C in Dolutegravir drug substance as per the ICH guidelines to demonstrate that this method is stability indicative for intended use.
System suitability: The system suitability was performed for every validation parameters by injecting of system suitability solution containing 0.5 mg/mL of Dolutegravir and 0.0005 mg/mL of each impurity.
Specificity (Selectivity): The blank, system suitability solution and spiked sample solutions were prepared as per methodology. Individual impurities were prepared at 0.1 mg/mL and spike sample solutions were prepared as per specification limit and injected into HPLC system. The retention time of all peaks obtained in the resulting chromatograms were recorded. Based on the results, all impurities are eluted at different retention times and adequately resolved from each other and also from main peak. Representative chromatogram is shown in Figure 2 and experimental data is given in Table 2.
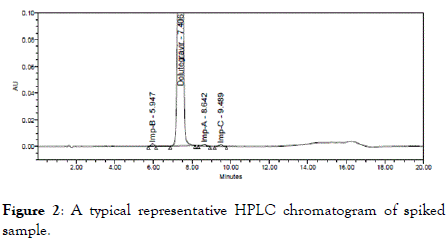
Figure 2. A typical representative HPLC chromatogram of spiked sample.
| Sample name | Retention time (min) | Relative retention time |
|---|---|---|
| Impurity B | 5.947 | 0.8 |
| Dolutegravir | 7.406 | 1 |
| Impurity A | 8.642 | 1.17 |
| Impurity C | 9.489 | 1.28 |
| Blank | - | -- |
Table 2: Specificity experimental data.
From the above chromatogram, there was no interference observed due to blank at the retention times of Dolutegravir and its related impurities. All impurities are separated with good resolution.
In order to assess the stability indicating nature of the HPLC method, Dolutegravir samples were stressed by acid, base, oxidation, heat, light (Fluorescent overall illumination with UV) and humidity. The degraded samples were analyzed by using a photodiode-array detector. The peak purity of Dolutegravir and its related impurities were passed. The forced degradation conditions are mentioned in Table 3 and the results are mentioned in Table 4.
| Stress condition | Solvent | Temp (°C) | Exposed time in hours |
|---|---|---|---|
| Acid | 1N HCL | 60 | 6 |
| Base | 1N NaOH | 60 | 6 |
| Oxidation | 5% H2O2 | -- | 24 |
| Hydrolytic | Water | 60 | 6 |
| Thermal | Diluent* | 105 | 24 |
| Photolytic | Diluent* | -- | -- |
Table 3: Forced degradation conditions of Dolutegravir.
| Degradation condition | % Area normalization | Peak purity for Dolutegravir | ||||
|---|---|---|---|---|---|---|
| Dolutegravir | Impurity B | Impurity A | Impurity C | Purity angle | Purity threshold | |
| Control Sample | 99.96 | 0.04 | ND | ND | 0.045 | 0.356 |
| Acid sample (1.0N HCl) 60°C, 6 Hours | 99.95 | 0.04 | ND | ND | 0.048 | 0.366 |
| Base sample (1.0N NaOH) 60°C, 6 Hours | 99.95 | 0.03 | ND | ND | 0.085 | 0.489 |
| 5% H2O2 at RT 24 Hours | 94.71 | 0.12 | ND | ND | 0.059 | 0.726 |
| Thermal/105°C 24 Hours | 99.96 | 0.04 | ND | ND | 0.043 | 0.351 |
| Photolytic | 99.94 | 0.06 | ND | ND | 0.04 | 0.366 |
| Humidity at 90 ± 5% RH | 99.95 | 0.04 | ND | ND | 0.084 | 0.453 |
Table 4: Degradation profile results.
From the results, no degradation was observed when Dolutegravir sample was exposed to acid, base, hydrolysis, light, humidity and heat. Slight degradation was observed in peroxide conditions. According to the stress study, none of the degradants co-eluted with the Dolutegravir peak and its related impurities formed.
Limit of detection (LOD) and Limit of quantitation (LOQ): The detection limit is considered as very low level of concentration of an analyte in a sample that can be detected, but not necessarily quantitated. The detection limit was determined as the lowest concentration for which the response is approximately three times greater than the baseline noise. The limit of quantitation is considered as the lowest concentration of an analyte in a sample that can be determined with acceptable precision and accuracy under the stated operational conditions of the method. The LOD values obtained for Dolutegravir and its impurities are listed in Table 5 and corresponding representative chromatogram is shown in Figure 3.
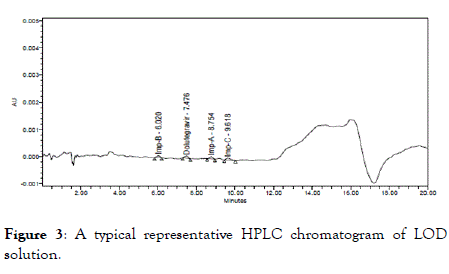
Figure 3. A typical representative HPLC chromatogram of LOD solution.
| Component | Concentration (mg/mL) | LOD w.r.t Test Concentration (%w/w) | S/N ratio |
|---|---|---|---|
| Impurity B | 0.000033 | 0.0066 | 3.2 |
| Dolutegravir | 0.000025 | 0.005 | 3.6 |
| Impurity A | 0.000033 | 0.0066 | 3 |
| Impurity C | 0.000033 | 0.0066 | 3.1 |
Table 5: Summary of limit of detection.
Based on above results for LOD, S/N ratio of each component was within the limit.
The LOQ values obtained for Dolutegravir and its impurities are listed in Table 6 and corresponding representative chromatogram is shown in Figure 4.
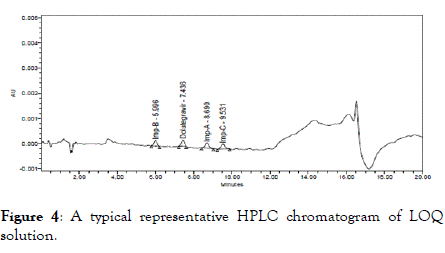
Figure 4. A typical representative HPLC chromatogram of LOQ solution.
| Component | Concentration (mg/mL) | LOQ w.r.t Test Concentration (%w/w) | S/N ratio |
|---|---|---|---|
| Impurity B | 0.000099 | 0.02 | 10.2 |
| Dolutegravir | 0.000076 | 0.015 | 11.5 |
| Impurity A | 0.000099 | 0.02 | 10.5 |
| Impurity C | 0.000099 | 0.02 | 10.1 |
Table 6: Summary of limit of Quantitation.
Based on above results for LOQ, S/N ratio of each component was within the limit.
Precision at LOQ: The precision at LOQ was performed by analyzing six replicate injections of Dolutegravir and each impurity at LOQ level. Results of peak area of Dolutegravir and each impurity were summarized in Table 7.
| Injection | Imp B | DTG | Imp A | Imp C |
|---|---|---|---|---|
| 1 | 2413 | 3382 | 2577 | 2225 |
| 2 | 2339 | 3258 | 2522 | 2111 |
| 3 | 2282 | 3349 | 2372 | 2273 |
| 4 | 2463 | 3313 | 2514 | 2215 |
| 5 | 2261 | 3411 | 2403 | 2147 |
| 6 | 2402 | 3310 | 2502 | 2340 |
| Mean | 2349 | 3328 | 2462 | 2217 |
| SD | 83.9 | 56.5 | 69.8 | 92.7 |
| %RSD | 3.57 | 1.7 | 2.83 | 4.18 |
Table 7: Summary of LOQ precision.
Based on the above results, it was observed that the % RSD for the peak areas of Dolutegravir and its impurities obtained from QL level was within the acceptable limit.
Linearity: The linearity of the method was demonstrated for Dolutegravir and its related impurities by analyzing the solutions ranging from LOQ to 150% of the specification limit (Table 8).
| Level | Impurity B | Dolutegravir | Impurity A | Impurity C | ||||
|---|---|---|---|---|---|---|---|---|
| Conc (mg/mL) | Peak area | Conc (mg/mL) | Peak area | Conc (mg/mL) | Peak area | Conc (mg/mL) | Peak area | |
| LOQ | 0.000099 | 2245 | 0.000076 | 2678 | 0.000099 | 2759 | 0.000099 | 2529 |
| 50 | 0.0005 | 7139 | 0.0005 | 11354 | 0.0005 | 7815 | 0.0005 | 7543 |
| 75 | 0.00075 | 11083 | 0.00075 | 16401 | 0.00075 | 11284 | 0.00075 | 12451 |
| 100 | 0.001 | 15227 | 0.001 | 22138 | 0.001 | 15887 | 0.001 | 17246 |
| 125 | 0.00125 | 19800 | 0.00125 | 28504 | 0.00125 | 19967 | 0.00125 | 21505 |
| 150 | 0.0015 | 23298 | 0.0015 | 33428 | 0.0015 | 24476 | 0.0015 | 26526 |
| Correlation coefficient | 0.9996 | 0.9995 | 0.9994 | 0.9997 | ||||
Table 8: Linearity data.
The correlation coefficient for impurity B was 0.9996, Dolutegravir was 0.9995, Impurity A was 0.9994 and Impurity C was found to be 0.9997 which indicates good linearity (Figures 5-8).
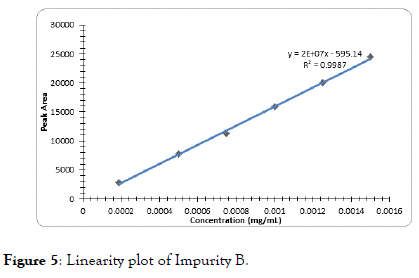
Figure 5. Linearity plot of Impurity B.
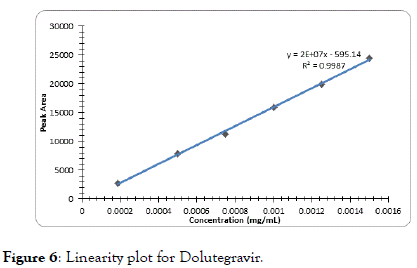
Figure 6. Linearity plot for Dolutegravir.
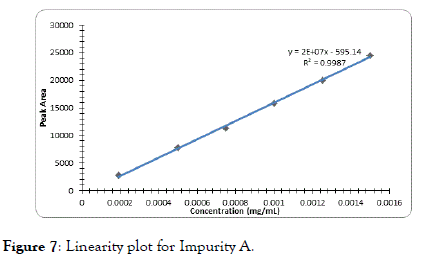
Figure 7. Linearity plot for Impurity A.
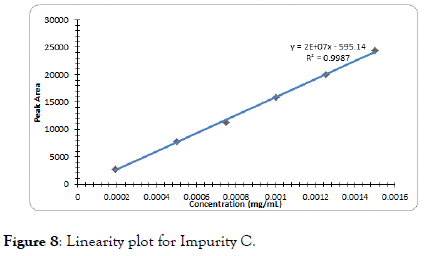
Figure 8. Linearity plot for Impurity C.
Accuracy: The accuracy of the method was determined by using solutions containing Dolutegravir sample spiked with each impurity at LOQ, 50%, 100% and 150% of the working strength of Dolutegravir. All the solutions were prepared in triplicate and analyzed. The percentage recovery results obtained for each impurity was listed in Table 9.
| Level | Percentage Recovery (%) | ||
|---|---|---|---|
| Impurity B | Impurity A | Impurity C | |
| LOQ | 103.2 | 107.6 | 101.3 |
| 108.8 | 106.7 | 97.5 | |
| 99.7 | 100 | 99.1 | |
| 50% | 101.9 | 100.5 | 99.9 |
| 104 | 99.6 | 101 | |
| 105.8 | 100.6 | 99.8 | |
| 100% | 98.8 | 101.7 | 100.4 |
| 98.7 | 100.6 | 100.5 | |
| 98.9 | 101.2 | 100.6 | |
| 150% | 101.4 | 100.8 | 100.4 |
| 104 | 101.7 | 99.6 | |
| 101.6 | 100.8 | 100.7 | |
Table 9: Summary of percentage recoveries for each impurity.
The percentage recovery values obtained for each impurity at LOQ level, 100% and 150% were within the acceptable limit.
System Precision: The system precision was performed by analyzing six replicate injections of standard solution at 100% of the specified limit with respect to the working strength of Dolutegravir. Results of peak area of Dolutegravir and its impurities are summarized in Table 10.
| Injection | Imp B | DTG | Imp A | Imp C |
|---|---|---|---|---|
| 1 | 14836 | 20928 | 15056 | 16682 |
| 2 | 14849 | 21291 | 15031 | 16677 |
| 3 | 14930 | 20961 | 15262 | 16569 |
| 4 | 15091 | 21060 | 15264 | 16382 |
| 5 | 15126 | 20875 | 15048 | 16564 |
| 6 | 14781 | 21245 | 14992 | 16666 |
| Mean | 14955 | 21086 | 15119 | 16571 |
| %RSD | 1 | 0.85 | 0.88 | 0.71 |
Table 10: Summary of system precision.
The % RSD for the peak areas of Dolutegravir and its impurities obtained from six replicate injections of standard solution was within the limit.
Method Precision: The precision of the method was determined by analyzing a sample of Dolutegravir spiked with each impurity at 100% of the specification limit (Six individual sample preparations). Data obtained is summarized in Table 11.
| Sample No. | % w/w | ||
|---|---|---|---|
| Impurity B | Impurity A | Impurity C | |
| 1 | 0.1 | 0.102 | 0.1 |
| 2 | 0.099 | 0.101 | 0.1 |
| 3 | 0.1 | 0.101 | 0.101 |
| 4 | 0.1 | 0.102 | 0.1 |
| 5 | 0.098 | 0.101 | 0.1 |
| 6 | 0.098 | 0.101 | 0.101 |
| Mean | 0.099 | 0.101 | 0.1 |
| %RSD | 1.71 | 1.71 | 1.71 |
Table 11: Summary of method precision results.
From the above results, the % RSD for the impurities from method precision study was within the limit.
Robustness: The chromatographic conditions were deliberately changed to evaluate the robustness of the existing method. To determine the robustness of method, system suitability solution is prepared as per methodology and injected into HPLC at different altered conditions to check the method’s ability like flow rate (± 10%), column oven temperature (± 5°C) and wavelength (± 3 nm) from actual method conditions. No significant change is observed by changing flow, temperature, wavelength and system suitability also complied as per methodology. The robustness results are summarized in Table 12.
| Condition | Variation | USP resolution between Imp-A and Dolutegravir |
|---|---|---|
| Actual | -- | 3.92 |
| Flow | -10% | 3.56 |
| 10% | 4.16 | |
| Column Oven temperature | -5°C | 4.05 |
| +5°C | 3.95 | |
| Wavelength | -3 nm | 3.93 |
| +3 nm | 3.92 |
Table 12: Summary of robustness results.
From the robustness study, system suitability criteria comply with the results.
From the above experimental results it was concluded that, the newly developed method for the simultaneous estimation of related substances (i.e. Impurity A, Impurity B and Impurity C) in Dolutegravir was found to be simple, precise and accurate with high resolution and shorter retention time. The present proposed methodology makes is cost effective which can be implemented for routine analyses in pharmaceutical industry.
We sincerely thank the Department of Chemistry, GITAM School of Science, GITAM (Deemed to be University), Hyderabad for providing Ph.D registration and facilities.
Citation: Venkatnarayana M, Siva Jyothi N (2020) Development of Validation and Stability Indicating Method of Anti-HIV Dolutegravir Drug and its Related Impurities by Using RP-HPLC. J Chromatogr Sep Tech. 11:426. DOI: 10.35248/2157-7064.20.11.426
Received: 25-Jan-2020 Accepted: 10-Feb-2020 Published: 17-Feb-2020 , DOI: 10.35248/2157-7064.20.11.426
Copyright: © 2020 Venkatnarayana M, et al. This is an open-access article distributed under the terms of the Creative Commons Attribution License, which permits unrestricted use, distribution, and reproduction in any medium, provided the original author and source are credited.