Journal of Clinical Trials
Open Access
ISSN: 2167-0870
ISSN: 2167-0870
Research Article - (2015) Volume 5, Issue 3
Background/aims: In trials with post treatment assessment of continuous outcome variable, sample size estimations usually do not make use of existing information on levels of baseline imbalance and correlation (r) between pre and post treatment scores of outcome variable. As a result, in trial scenarios where imbalance indeed exists, more or less sample units than the required may have been indicated, creating ethical issues and issues related to efficient trial design. This simulation study aimed at quantifying relative sample sizes required at differing levels of experimental conditions including baseline imbalance for statistical methods of analysis of variance ANOVA, change score analysis CSA and analysis of covariance ANCOVA.
Methods: Overall, 126 hypothetical trials were evaluated, each with data simulated by using several combinations of levels of treatment effect, correlation between pre and post treatment scores, direction and magnitude of baseline imbalance.
Results: Irrespective of both size and direction of baseline imbalance and level of effect to be determined, CSA when compared to ANOVA requires same sample size when r=0.5, requires less sample units when r>0.5 and more sample units when r<0.5. Irrespective of the level of baseline imbalance, depending on the level of correlation, reduction in the required sample size can reach more than 50% of the original for specifying ANCOVA.
Conclusions: Researchers should make use of a-priori specification of correlation in sample size estimations and endeavour to report information on the observed level of correlation in their trials. Such information is crucial to future design of efficient clinical trials.
Keywords: Sample size; Trials; Statistical methods
Many randomized controlled trials (RCTs) involve a single posttreatment assessment of a continuous outcome variable previously measured at baseline. In practice, baseline imbalance in prognostic factors may occur notwithstanding randomization [1,2]. Since sample size estimation at the design stage of a trial experiment is usually based on the assumption that treatment groups are balanced when indeed they are not in practice, there is an expectation of difference in the sample size required and that which is computed. This difference will be of particular importance especially if the baseline imbalance occurs in a prognostic covariate, for example, the pretreatment score of the outcome variable. Despite previous authors [3-5] attempt to describe relative sample size using algebraic expressions, there is still a gap in knowledge on the possible effect of levels and direction of baseline imbalance on the same. For example, the effect of both size and direction of imbalance especially when these interact with levels of other factors in the trial have not been completely understood. In addition, such algebraic expressions are usually not within the reach of trial lists who may not be mathematical specialists, hence a need for a simulation approach that can be related to by everyone irrespective of background in mathematics. Beach and Meier [6] had previously used algebraic procedure to compare certain attributes of the unadjusted and adjusted analysis they however recommended a computer simulation approach to investigate the issue.
Statistical methods that account for baseline imbalance in prognostic variables have been widely reported to be more precise [7- 9] more powerful [9-13] and have a better estimate of treatment effect [1,8,9]. Whereas the beneficial effects of such statistical method are widely appropriated during statistical analysis, only very little is known of such benefits at the design stage of clinical trials, especially in relation to sample size estimation. Very few literatures that treat the subjects are heavily laddened with algebraic expressions and equations, making them inaccessible to none mathematics specialists.
There is a high likelihood that sample size estimation that utilizes information on the expected level and direction of baseline imbalance in prognostic variable in particular pre and post treatment scores of the outcome and the associated correlation will be more efficient. A more efficient trial will require fewer patients to have a stated level of power to detect an important difference between two treatments [14]. The comparative advantage of adjusted analysis holds for all trial scenarios – whether or not there is baseline imbalance. If sample size estimation assumes no baseline imbalance in trial scenarios when baseline imbalance indeed exists in prognostic variables especially the baseline-outcome variable, the implication is that more or less sample size may have been indicated for particular trial.
Ethically, it is wrong to study more than the required number of participants necessary to detect a level of treatment effect when new drugs whose side effects have not been completely ascertained is being tested or in trials in which a placebo group is being compared with a treated group. Conversely, if less than the required number of sample necessary to detect a specified effect is studied, then a treatment effect may actually exist without noticing it. A sample size estimation that makes use of information on the possible level of baseline imbalance and or level of prognostic relationship between covariates and outcome variables is likely to yield more reliable trial sample size.
For a single post-treatment assessment of a continuous outcome variable, three statistical methods have commonly been used: crude comparison of treatment effect by t test or, equivalently, ANOVA, CSA and ANCOVA. On occasions, CSA is performed using percentage change, but this has been shown to be an inefficient approach [15]. Thus, this simulation study considers relative sample size for three statistical methods of ANOVA, CSA and ANCOVA at several similar trial scenarios. A trial scenario comprises of unique level of experimental factors – pre and post treatment scores correlation, effect size and both levels and direction of imbalance. In this study, sample sizes of both ANCOVA and CSA are computed and compared with each other and with the original but nominal sample size by ANOVA.
Data simulation
A statistical program was developed in STATA to generate hypothetical two-arm trials involving specific levels of experimental conditions, run the regression models for the statistical methods being studied, and then post selected results into a file. Each hypothetical trial scenario was repeated a thousand times, so as to generate robust estimates (e.g. allowing a percentage to be estimated with a margin of error no greater than ± 3% at a 95% confidence level). Detailed information on the statistical program is included in the appendix.
Levels of experimental conditions
A population standard deviation of 1 (σ=1) was assumed in each trial and a 1:1 allocation ratio was employed. Levels of experimental conditions; effect size, correlation between pre and post treatment scores, sample size, direction and size of baseline imbalance were selected in such a way to reproduce conditions typical of an empirical trial scenario. Data for the outcome variable (YT, YC, for the treatment and control groups, respectively) were simulated so as to produce a standardized treatment effect (  ) at three levels of 0.2, 0.5 and 0.8, classified [16] as ‘low’, ‘medium’, and ‘large’ respectively:
For statistical power of 80%, the required size was utilized for each of these standardized effect sizes: 394, 64 and 26 per group, respectively. The correlation between baseline values (ZT, ZC for the treatment and control groups, respectively) and post-treatment values was varied from 0.1 to 0.9 in increments of 0.2, as it has been argued that the correlation between baseline covariates and outcome scores in RCTs may range between these values (Tu et al, 2005) [17].
For each hypothetical trial, imbalance in baseline values of the outcome measure was computed as a standardized score ( ), in terms of its standard error (SE):
In this way, realistic values of imbalance were derived in relation to the sample size, thus avoiding large absolute imbalance for large sample sizes that would contradict the principles of randomization. Imbalance was simulated in both the same direction (‘positive’ imbalance) and the opposite direction (‘negative’ imbalance) in relation to the treatment effect. The predetermined levels of for this study were ± 1.28, ± 1.64 and ± 1.96, representing 20%, 10% and 5% two-tailed probabilities respectively of the standard normal distribution. Hence, the various levels of imbalance had a predetermined probability of occurring, whatever the sample size and on whatever scale the covariate or outcome variable is scored. Standardized baseline imbalance of zero (0) represents trial scenarios in which treatment arms are balanced at baseline.
In total, 126 scenarios representing hypothetical combinations of experimental conditions were simulated at 80% nominal power, comprising:
7 standardized baseline imbalances: -1.96; -1.64; -1.28; 0; 1.28; 1.64; 1.96
6 covariate-outcome (ZY) correlations: 0.0; 0.1; 0.3; 0.5; 0.7; 0.9
3 standardized treatment effect sizes: 0.2; 0.5; 0.8
Each scenario was analyzed by each of the statistical methods. In the analyses, a binary variable represented group allocation, such that the estimate of the treatment effect in each simulated dataset was derived from the associated regression coefficient. The relative proportion of the required sample size by these statistical methods was computed by examining the square of the ratio of standard errors (a measure of the relative precision of the effect estimate by each of the statistical methods) at unique trial scenarios:
ANCOVA vs. ANOVA
In Table 1, except for random fluctuations, irrespective of level and direction of baseline imbalance, at unique levels of correlation, proportion of sample size required for using ANCOVA instead of ANOVA is the same. Figure 1 shows an inverse relationship between proportion of required sample size for using ANCOVA instead of ANOVA and levels of pre and post scores correlation. The relationship appears to be non-linear. However, the proportions are seeing to continuously reduce as correlation between pre and post treatment scores also increases. The results show a very considerable reduction in the original sample size especially when the level of correlation between pre and post treatment scores is greater than or equal to 0.3 (r ≥ 0.3). For example, whereas, when r=0.1, there is little or no difference in the sample size requirement for both ANCOVA and ANOVA, however, there is a reduction of around 8% when r=0.3, 26% when r=0.5, 49% when r=0.7 and 82% when r=0.9. Thus, in absolute term, for detecting a standardized treatment effect size of 0.5, when r= 0.3 the require sample size for ANCOVA is about 118, (n=118 instead of the original 128), with r=0.5, the require sample size is about 95 (n=95 instead of 128), for a correlation of 0.7 the require sample size is about 66 (n=66 instead of 128).
| Baselin Imbalance(Z) | Treatment effect | ||||||||||||||||||
|---|---|---|---|---|---|---|---|---|---|---|---|---|---|---|---|---|---|---|---|
| 0.2 | 0.5 | 0.8 | |||||||||||||||||
| ZY correlation | ZY correlation | ZY correlation | |||||||||||||||||
| 0 | 0.1 | 0.3 | 0.5 | 0.7 | 0.9 | 0 | 0.1 | 0.3 | 0.5 | 0.7 | 0.9 | 0 | 0.1 | 0.3 | 0.5 | 0.7 | 0.9 | ||
| ANCOVA instead of ANOVA | -1.96 | 1.01 | 1.02 | 0.94 | 0.74 | 0.51 | 0.18 | 1.04 | 1.02 | 0.94 | 0.77 | 0.52 | 0.19 | 1.10 | 1.09 | 1.00 | 0.81 | 0.56 | 0.20 |
| -1.64 | 1.00 | 1.03 | 0.94 | 0.76 | 0.53 | 0.20 | 1.03 | 1.01 | 0.93 | 0.77 | 0.52 | 0.19 | 1.08 | 1.04 | 0.98 | 0.81 | 0.55 | 0.21 | |
| -1.28 | 1.00 | 1.00 | 0.94 | 0.76 | 0.53 | 0.18 | 1.02 | 1.01 | 0.92 | 0.76 | 0.51 | 0.19 | 1.05 | 1.04 | 0.96 | 0.79 | 0.54 | 0.20 | |
| 0.00 | 1.00 | 1.00 | 0.92 | 0.73 | 0.51 | 0.18 | 1.01 | 1.00 | 0.92 | 0.75 | 0.50 | 0.19 | 1.02 | 1.01 | 0.92 | 0.75 | 0.52 | 0.20 | |
| 1.28 | 1.00 | 1.00 | 0.94 | 0.73 | 0.51 | 0.18 | 1.02 | 1.01 | 0.92 | 0.76 | 0.49 | 0.18 | 1.05 | 1.02 | 0.95 | 0.79 | 0.52 | 0.20 | |
| 1.64 | 1.00 | 1.00 | 0.94 | 0.73 | 0.51 | 0.18 | 1.03 | 1.01 | 0.93 | 0.77 | 0.52 | 0.19 | 1.07 | 1.06 | 0.97 | 0.80 | 0.55 | 0.21 | |
| 1.96 | 1.01 | 1.00 | 0.94 | 0.73 | 0.51 | 0.18 | 1.04 | 1.02 | 0.94 | 0.77 | 0.52 | 0.19 | 1.10 | 1.08 | 0.99 | 0.81 | 0.56 | 0.21 | |
| ANCOVA instead of CSA | -1.96 | 0.50 | 0.56 | 0.73 | 0.74 | 0.83 | 1.00 | 0.52 | 0.57 | 0.67 | 0.77 | 0.87 | 0.97 | 0.55 | 0.61 | 0.72 | 0.82 | 0.94 | 1.05 |
| -1.64 | 0.50 | 0.56 | 0.65 | 0.76 | 0.86 | 1.00 | 0.51 | 0.56 | 0.66 | 0.77 | 0.89 | 0.99 | 0.54 | 0.60 | 0.70 | 0.82 | 0.92 | 1.03 | |
| -1.28 | 0.50 | 0.54 | 0.72 | 0.76 | 0.86 | 1.00 | 0.51 | 0.56 | 0.66 | 0.76 | 0.87 | 0.97 | 0.53 | 0.58 | 0.69 | 0.79 | 0.93 | 1.02 | |
| 0.00 | 0.50 | 0.54 | 0.70 | 0.73 | 0.83 | 1.00 | 0.50 | 0.55 | 0.65 | 0.75 | 0.86 | 0.99 | 0.51 | 0.56 | 0.66 | 0.76 | 0.86 | 0.98 | |
| 1.28 | 0.50 | 0.54 | 0.72 | 0.76 | 0.86 | 0.94 | 0.51 | 0.59 | 0.64 | 0.76 | 0.87 | 0.97 | 0.53 | 0.57 | 0.68 | 0.79 | 0.91 | 1.00 | |
| 1.64 | 0.50 | 0.54 | 0.66 | 0.73 | 0.83 | 1.00 | 0.51 | 0.56 | 0.67 | 0.73 | 0.89 | 0.97 | 0.54 | 0.59 | 0.70 | 0.81 | 0.95 | 1.03 | |
| 1.96 | 0.50 | 0.54 | 0.72 | 0.73 | 0.83 | 1.00 | 0.52 | 0.57 | 0.67 | 0.73 | 0.89 | 0.97 | 0.55 | 0.61 | 0.71 | 0.82 | 0.97 | 1.04 | |
Table 1: Relative sample size proportion for using ANCOVA instead of ANOVA and CSA at different trial scenarios.
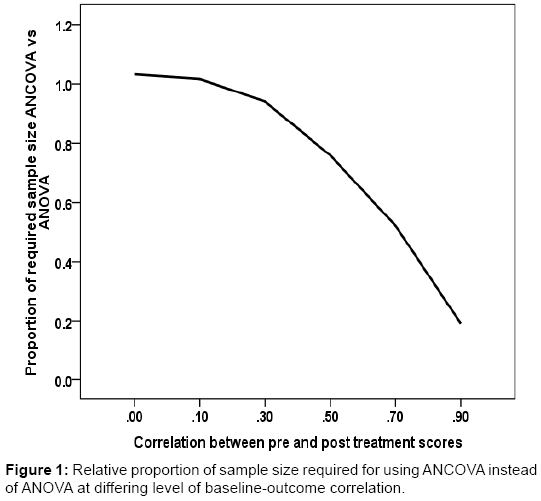
Figure 1: Representative photomicrograph of histopathological features in pulmonary necropsies.
A very similar sample size requirement was observed for using ANCOVA instead of ANOVA when r=0.0 or r=0.1. The results in Table 1 show that, when treatment effect to be detected is large such that the original sample size is small, levels of baseline imbalance appears to have a slight modifying effect on the proportion of sample size required by ANCOVA instead of ANOVA. This observation could be due to random fluctuation exaggerated by the small sample size of trials at the time, the observation was not however sustained at other trial scenarios.
ANCOVA vs. CSA
The results in Table 1 also show that ANCOVA requires a smaller sample size compared to CSA given most trial scenarios making it a more efficient of the two statistical methods. The benefit of sample size reduction by ANCOVA over CSA is maximum when correlation between pre and post treatment scores is low (r<0.3). On the other hand, when correlation is close to 1, the sample size requirement of the two methods becomes so similar. For example, when r =0.3, over 30% of the sample units could be saved if ANCOVA is specified instead of CSA, however, this reduced to just 13% when r=0.7. Again both size and direction of imbalance do not determine differences in sample size requirement by the two methods, only level of correlation does.
Figure 2 represents a linear relationship in the proportion of sample size requirement by ANCOVA in relation to CSA at levels of correlation.
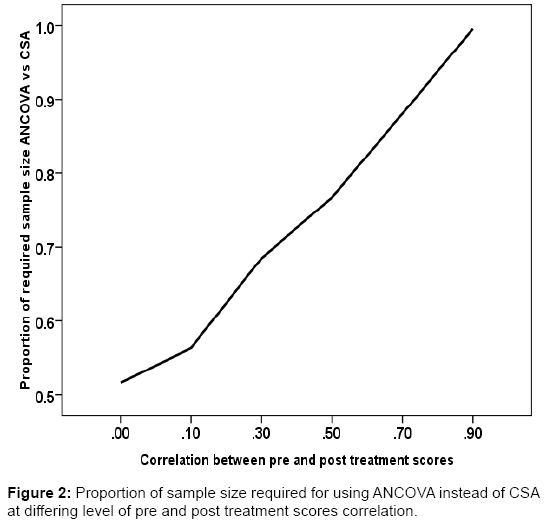
Figure 2: Representative photomicrograph of histopathological features in pulmonary necropsies.
The proportion increases as levels of correlation also increase. This simulation result is reasonably consistent with the algebraic expression earlier expressed for sample size reduction when using ANCOVA instead of CSA.
CSA vs. ANOVA
Table 2 shows the proportion of the original sample size when using CSA instead of ANOVA. Here again, excluding random fluctuation in the estimates, the only influential factor in the observed differential in the proportion of sample size required is the level of prognostic relationship between pre and post treatment scores. Levels of treatment effect or size of the trial and both levels and directions of imbalance have no impact on relative sample size requirement. The differences though in the opposite direction are symmetrical at both sides of correlation of 0.5. The sample size requirement is same at all trial scenarios for both CSA and ANOVA when r=0.5; sample size requirement for CSA is in excess of the original when r<0.5, also CSA requires lesser sample units than ANOVA when r>0.5. When a standardized treatment effect of 0.5 is to be detected; at r=0.3, CSA requires 40% more sample units (required sample size n=180 instead of 128) than ANOVA and 40% lesser when r=0.7(require sample size n=77 instead of 128). However, twice the original sample size will be needed for using CSA instead of ANOVA when r=0.0 irrespective of the level and direction of baseline imbalance.
| Treatment effect | |||||||||||||||||||
|---|---|---|---|---|---|---|---|---|---|---|---|---|---|---|---|---|---|---|---|
| 0.2 | 0.5 | 0.8 | |||||||||||||||||
| ZY correlation | ZY correlation | ZY correlation | |||||||||||||||||
| 0 | 0.1 | 0.3 | 0.5 | 0.7 | 0.9 | 0 | 0.1 | 0.3 | 0.5 | 0.7 | 0.9 | 0 | 0.1 | 0.3 | 0.5 | 0.7 | 0.9 | ||
| CSA instead of ANOVA | -1.96 | 2.00 | 1.84 | 1.31 | 1.00 | 0.62 | 0.18 | 2.01 | 1.80 | 1.40 | 1.00 | 0.60 | 0.20 | 1.99 | 1.80 | 1.40 | 0.99 | 0.60 | 0.19 |
| -1.64 | 2.00 | 1.84 | 1.31 | 1.00 | 0.62 | 0.20 | 2.01 | 1.80 | 1.40 | 1.00 | 0.59 | 0.20 | 1.99 | 1.79 | 1.40 | 0.99 | 0.60 | 0.20 | |
| -1.28 | 2.00 | 1.84 | 1.31 | 1.00 | 0.62 | 0.18 | 2.01 | 1.80 | 1.40 | 1.00 | 0.60 | 0.20 | 1.99 | 1.80 | 1.40 | 1.00 | 0.57 | 0.20 | |
| 0.00 | 2.00 | 1.84 | 1.31 | 1.00 | 0.62 | 0.18 | 2.01 | 1.80 | 1.41 | 1.00 | 0.60 | 0.20 | 1.99 | 1.80 | 1.40 | 0.99 | 0.60 | 0.20 | |
| 1.28 | 2.00 | 1.84 | 1.31 | 1.02 | 0.62 | 0.20 | 2.01 | 1.80 | 1.40 | 1.00 | 0.60 | 0.19 | 1.99 | 1.80 | 1.39 | 0.99 | 0.57 | 0.20 | |
| 1.64 | 2.00 | 1.84 | 1.31 | 1.00 | 0.62 | 0.18 | 2.01 | 1.80 | 1.40 | 1.00 | 0.59 | 0.20 | 1.99 | 1.79 | 1.39 | 0.99 | 0.57 | 0.20 | |
| 1.96 | 2.00 | 1.84 | 1.31 | 1.00 | 0.62 | 0.18 | 2.01 | 1.80 | 1.40 | 1.00 | 0.59 | 0.20 | 1.99 | 1.78 | 1.39 | 0.99 | 0.57 | 0.20 | |
Table 2: Relative sample size proportion for using CSA instead of ANOVA at different trial scenarios.
At the extremes of the levels of correlation (0.1 or 0.9) there is around 80% increase or decrease in the original sample size at nominal power of 80%. A linearly inverse relationship was depicted in Figure 3 , illustrating proportion of the required sample sizes for using CSA instead of ANOVA and levels of correlation between pre and post treatment scores. The higher the correlation the lower the proportion of sample size required by CSA compared to ANOVA and vice versa.
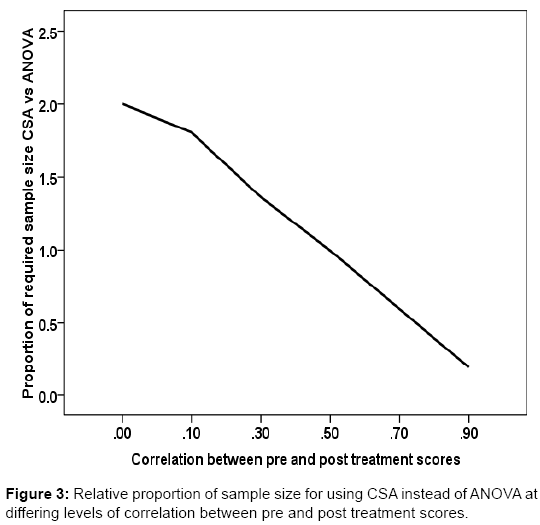
Figure 3: Representative photomicrograph of histopathological features in pulmonary necropsies.
The results of this simulation study demonstrate that by applying appropriate statistical strategies for adjustment, there can be an appreciable reduction in the sample units that have to be studied to detect a given effect. The reduction, as was shown in the results, is independent of both level and direction of imbalance, and it is wholly driven by the level of prognostic relationship between the baseline and the outcome. A high correlation between pre and post treatment scores will result in high reduction in the original sample size if such is taken into consideration. This finding agrees with the algebraic expressions on relative sample sizes of these methods by previous authors (2002) [3,4] the mathematical expressions are indeed applicable irrespective of the level and direction of baseline imbalance.
According to the findings of this study, sample size requirement is the same for trials in which baseline imbalance is zero and trials with significant level of imbalance as long as the baseline variable is appropriately adjusted. This appears to suggest that if appropriate statistical method of adjustment is used, in the context of relative efficiency in trials (reduced sample size) measures to balance the treatment arms (stratification, minimization etc.) in prognostic factors are of little or no value. For example, the relative benefit in sample size reduction of ANCOVA against ANOVA is not a function of both direction and size of baseline imbalance. Kernan et al. [14] however, observed that stratification improves power and reduces sample size. These authors further argue that power losses for failure to stratify randomization could be made up by adding 6-14 patients to a given trial, their observations and comparison however, are limited to trials that do not use appropriate statistical methods of adjustment.
Furthermore, the benefit of reduction in sample size by reducing the variability in the data through stratification cannot be fully harnessed unless the design is based on such methods that account for a known prognostic baseline variable. This study does not oppose the idea of stratification, however, the procedure should not be seen as a substitute for statistical methods that make use of information on a given level of prognostic relationship, at least in the context of efficient trial design. Similar observation has been made however, during statistical analysis regarding stratified randomization and the use of statistical methods of adjustment. In fact, a rule of thumb when stratified randomization is used is to always include the stratification factor in the adjusted analysis [18] even though we do not need to stratify to statistically account for important prognostic factors in trial [19].
Usually, the pre-treatment score of the outcome variable will have the highest prognostic relationship with the post treatment score of same. Depending on the prognostic relationship between the baseline and the outcome, the results demonstrate that up to 80% of the original sample size could be saved if ANCOVA or CSA is appropriately specified as the primary analysis, assuming baseline outcome variable has a correlation of 0.9 with the outcome. Taking a more realistic baseline-outcome correlation, about half the original sample size will
be needed for accounting for a pre-treatment score that has correlation of 0.7 using ANCOVA. Comparatively, this finding is consistent with results from previous studies [3-5]. The authors observed that with a baseline-outcome correlation of 0.7, the required sample size is roughly half the original sample size if the baseline variable is included in an ANCOVA model.
Similarly, it has been observed [20] that, at a baseline-outcome correlation of 0.8, only 33 patients per group will be needed when using ANCOVA instead of 84 per group if ANOVA is the statistical method to detect a large effect with 80% power. This of course has huge implications for safety issues for the patients (as less patients will be randomized to receive treatment which in some cases may not be effective or presents with certain adverse reactions), trial cost, patient’s recruitment and implementation time and other administrative issues. In this study, in the context of minimizing sample size-efficiency, CSA shows some potential to be more efficient than ANOVA, but only when correlation is greater than 0.5. On the other hand, in terms of efficiency ANCOVA shows itself to be the statistical method of choice across a wider range of experimental conditions typical of a clinical trial setting.
As a method for statistical adjustment, ANCOVA provides greater efficiency than ANOVA, especially where CSA performs poorly; for example, for a baseline-outcome correlation that is less than 0.5. The results show that there is around 25% reduction in the required sample size when using ANCOVA instead of CSA in a trial with a baselineoutcome correlation of 0.5. This finding corroborates the results of earlier studies [3,21,22]. These results show that the potential for relative sample size reduction by ANCOVA does not depend on the original sample size (small or large) or the size of treatment effect to be detected, nor does it depend on either the magnitude or the direction of imbalance. This result agrees with Hernandez et al. [10] who argue that potential sample size reduction by the adjusted analysis does not depend on the size of treatment effect and sample size, although there observation was made in the context of a dichotomous outcome variable. This implies that during the design of a trial, in order to minimize the sample size requirement, researchers need not worry about the size of possible effect to be detected or direction and level of chance imbalance if statistical adjustment is to be specified as the primary analysis. However, in the instance of small sample trials (when n ≤ 52) the adjusted sample size can be increased by a correction factor of 6-8% of the original sample size. This will account for the random fluctuation inherent with small sample trials and which appears to be associated with levels of baseline imbalance.
The results of this study further demonstrate that irrespective of the level of imbalance, CSA can be more efficient than the crude betweengroup comparison of treatment effect using ANOVA, but only if the baseline-outcome correlation is greater than 0.5. It also follows that while ANOVA can be more efficient than CSA at a correlation less than 0.5, both methods are equally efficient at correlation of 0.5. Thus, unless the prognostic relationship between the baseline and the outcome is represented by a correlation that is anticipated to be in excess of 0.5, CSA should not be specified as the primary analysis for the purpose of increased efficiency. This finding is again consistent with result from previous study [23] that CSA is worse than simply using the unadjusted outcome values if the baseline-outcome correlation is less than 0.5.
This study demonstrates the fact that in trial settings, the beneficial effect of appropriate statistical adjustment also applies at the design stage and is not limited to the statistical analysis alone. Sample size requirement by the three methods considered in this study varied considerably for a given trial scenario, depending on the level of prognostic relationship between pre and post treatment scores of the outcome variable. This observation has serious implications not only in saving cost for conducting trials especially when recruitment rate is low, but also, it touches on the ethical requirement for involving human subjects especially in trials that compare placebo and treated group. Change score analysis is not to be specified in trials with pre and post treatment scores correlation below 0.5 as it would require more sample size to detect the same effect for a given level of power than ANOVA. Since in most trial situations, the pre and post scores correlation will usually be more than 0.1, ANCOVA method should be specified in sample size estimations so as to appropriate the benefit of reduction in the require sample units to detect a given treatment effect.
However, specifying level of correlation is an a-priori procedure, thus a major setback to this approach of sample size estimation could be the fact that researchers do not usually document observed levels of prognostic relationship especially between the pre and post treatment scores of the outcome variables. Researchers are therefore enjoined to always report the level of correlation between pre and post treatment scores observed in their trials as this will provide useful information for the design, especially sample size estimation, of future clinical trials. Also, since the difference in the original and conditional sample sizes can be so huge, researchers are advised to always depend on empirical evidence of correlation between pre and post treatment scores to avoid the possibility of incurring further type II error in their works.
This study is based on my PhD work in Biostatistics and I wish to express my gratitude to the Research Institute of Primary Care and Health Sciences, Keele University, United Kingdom, for providing full funding through bursary, scholarship awards and an enabling environment for a successful completion of the PhD. I also want to express my profound gratitude to Prof. Julius Sim and Dr Martyn Lewis for supervising the work.