Journal of Clinical Chemistry and Laboratory Medicine
Open Access
ISSN: 2736-6588

ISSN: 2736-6588
Research Article - (2022)Volume 5, Issue 5
Autism spectrum disorder (ASD) is a neurodevelopmental disorder usually presenting as reduced social interaction, lessened verbal communication, and repetitive behavior. Diagnosing autism spectrum disorder is extremely difficult because of its wide variety of symptoms, so it can only be diagnosed through behavioral tests and analysis of developmental history. Resting-state functional magnetic resonance imaging (rs-fMRI) can help researchers discover a neural substrate for autism spectrum disorder to diagnose it earlier. One prominent fMRI database for autism spectrum disorder research is the Autism Brain Imaging Data Exchange, a large-scale collection of anonymized functional MRI scans subdivided by age, gender, handedness, and scores on behavioral assessments.
This analysis focused on two brain networks: the Default Mode Network (DMN), which is active when minds wander, and the executive network, which is active during the performance of tasks. The medial prefrontal cortex (mPFC), Posterior Cingulate Cortex (PCC), and angular gyrus are nodes of the default mode network, and the dorsolateral prefrontal cortex (DLPFC) is the main node in the executive network. Both networks are affected by autism spectrum disorder.
This research used preprocessed resting-state fMRI data to establish neurocognitive phenotypes for autism spectrum disorder. Bivariate correlation was used to compare connectivity in the default mode network and dorsolateral prefrontal cortex between autism spectrum disorder fMRI scans and control fMRI scans, and these differences were analyzed for correlations with each patient’s assessment scores. After the Benjamini-Hochberg procedure was applied to reduce the false discovery rate, analysis of these metrics revealed that in autism spectrum disorder patients there was under connectivity between the right posterior cingulate cortex and the right medial prefrontal cortex, while in control patients there was over-connectivity between the right angular gyrus and left dorsolateral prefrontal cortex. Autism spectrum disorder is extremely heritable, so phenotypic research is absolutely necessary for discovering more about the genetic causes of autism spectrum disorder, which will speed up autism spectrum disorder diagnosis and help researchers develop more targeted treatments for autism spectrum disorder.
Joint discomfort; Knee joint; Physical activity; Mobility, Collagen
Functional magnetic resonance imaging (fMRI) is a neuroimaging method that measures changes in blood flow and blood oxygenation, which can be quantified as the Blood-Oxygen-Level-Dependent signal (BOLD). The BOLD signal measures the variance in the hemodynamic response, or the delivery of oxygen from blood vessels to surrounding neurons. Blood with varying levels of oxygenation is depicted on an MRI scan with varying levels of brightness; thus, varying levels of brightness can indicate brain activity [1]. In recent years, resting-state fMRI (rs-fMRI) has been used for brain activity analysis, specifically functional connectivity analysis. Functional connectivity refers to synchronized brain activity in two brain regions that share functions, and changes in functional connectivity can indicate a change in brain circuitry [2].Autism spectrum disorder is a “range of developmental disorders characterized by deficits in social communication and interaction and restricted and repetitive behaviors” [3]. Autism spectrum disorder is extremely difficult to diagnose because it is extremely heterogeneous, meaning it manifests as a wide variety of behavioral and psychological symptoms. Researchers still have not definitively determined a neural substrate for autism spectrum disorder, but there are multiple theories about autism spectrum disorder’s cause. One theory, the mirror neuron hypothesis, holds that autism spectrum disorder comes from dysfunction in the mirror neuron system, which activates when a person performs a task while observing another person performing the same task. Another hypothesis holds that the default mode network is affected by autism spectrum disorder; it is this hypothesis that is explored in this paper [4].
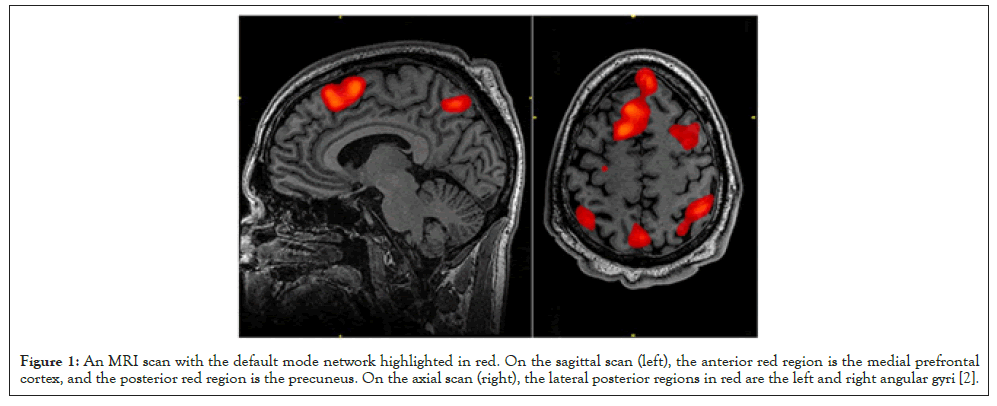
The default mode network is a brain network active during wakeful rest, when the brain is not presented with any stimuli, which makes it visible on resting-state fMRI scans. It is comprised of the medial prefrontal cortex, the posterior cingulate cortex, the precuneus, and the angular gyrus (Figure 1).

Figure 1:An MRI scan with the default mode network highlighted in red. On the sagittal scan (left), the anterior red region is the medial prefrontal cortex, and the posterior red region is the precuneus. On the axial scan (right), the lateral posterior regions in red are the left and right angular gyri [2].
Among several things, the default mode network is responsible for our concept of the self, as well as our emotional understanding and social interaction, which relates to how autism spectrum disorder manifests.The dorsolateral prefrontal cortex controls our executive functions, including working memory, cognitive flexibility, and planning. Executive dysfunction is a major hallmark of autism spectrum disorder [5].
It was hypothesized that there would be general under-connectivity throughout the default mode network and dorsolateral prefrontal cortex in patients with autism spectrum disorder. Thus, bivariate correlation was used to compare connectivity in the default mode network and dorsolateral prefrontal cortex between autism spectrum disorder fMRI scans and control fMRI scans to discover notable neurocognitive phenotypes of autism spectrum disorder in both brain systems.
Abide
ABIDE, or the Autism Brain Imaging Data Exchange, is an online open-access database of resting-state fMRI scans from 1112 people collected by 17 different research groups, as of March 2022 [6]. It also includes phenotypic data for each individual, such as age, medications, gender, handedness, and scores on various assessment scores such as the ADI-R (Revised Autism Diagnostic Interview) interview and ADOS (Autism Diagnostic Observation Schedule) subscores. ABIDE also supplies data that is preprocessed through a variety of pipelines (Connectome Computation System and Neuroimaging Analysis Kit, for instance) and subdivided according to several commonly used brain atlases. In this paper, the Talairach atlas was used. The data used in this research were .1D files, 2D arrays of numbers representing the BOLD signal in each Talairach region across time. There are 42 different regions in the Talairach atlas, each corresponding to a distinct four-digit code. The regions analyzed in this paper are as follows (Table 1).
| Regions of interests (ROIs) | Codes for regions in the talairach atlas |
|---|---|
| right medial prefrontal cortex | 2101 |
| left medial prefrontal cortex | 2102 |
| right angular gyrus | 4101 |
| left angular gyrus | 4102 |
| right precuneus | 4501 |
| left precuneus | 4502 |
| right dorsolateral prefrontal cortex | 4701 |
| left dorsolateral prefrontal cortex | 4702 |
| right posterior cingulate cortex | 2001 |
| left posterior cingulate cortex | 2002 |
Table 1: These specific regions of interests (ROIs) are extracted from the .1D files using AFNI’s 1dtool.py script.
Processing rs-fMRI data
DensParcorr, an R script for partial correlation devised by Wang et al. [7] was used to compare the BOLD signal time series for each region of interest. Partial correlation was specifically chosen because other methods of correlation, like Pearson correlation, do not consider the effect of external brain networks on the network being analyzed (Table 2).
| 2001 | 2002 | 2101 | 2102 | 4101 | 4102 | 4501 | 4701 | 4702 | |
|---|---|---|---|---|---|---|---|---|---|
| 2001 | 1 | 0.3957599 | 0.2226107 | 0.1125915 | 0.004033018 | 0.1790588 | -0.1237171 | 0.2271696 | -0.07097995 |
| 2002 | 0.3957599 | 1 | 0.2019985 | 0.05579368 | 0.03015877 | 0.07724723 | 0.01054664 | 0.1431119 | -0.07525002 |
| 2101 | 0.2226107 | 0.2019985 | 1 | 0.4192935 | -0.04067217 | 0.00949765 | 0.001356221 | -0.1782539 | 0.1328544 |
| 2102 | 0.1125915 | 0.05579368 | 0.4192935 | 1 | 0.15795 | 0.008793815 | 0.04145988 | 0.0488834 | 0.1179769 |
| 4101 | 0.004033018 | 0.03015877 | -0.04007217 | 0.15795 | 1 | -0.188432 | -0.00784356 | 0.2483503 | 0.0260735 |
| 4102 | 0.1790588 | 0.07724723 | 0.00949765 | 0.008793815 | -0.188432 | 1 | -0.03926598 | -0.0711616 | 0.2391627 |
| 4501 | -0.1237171 | 0.01054664 | 0.001356221 | 0.04145988 | -0.00784356 | -0.03926598 | 1 | 0.4439303 | 0.3800334 |
| 4502 | 0.02950651 | 0.03169859 | 0.1101673 | 0.08518178 | 0.4199669 | 0.1966028 | -0.2070323 | -0.03079901 | -0.03627 |
| 4701 | 0.2271696 | 0.1431119 | -0.1782539 | 0.0488834 | 0.2483503 | -0.0711616 | 0.4439303 | 1 | 0.00315732 |
| 4702 | -0.07097995 | -0.07525002 | 0.1328544 | 0.1179769 | 0.02607357 | 0.2391627 | 0.3800334 | 0.00315732 | 1 |
Note: Each cell represents the correlation of the BOLD signals between the two regions in the row and column. For instance, the correlation between regions 4101 and 2001 (the right angular gyrus and the right posterior cingulate cortex respectively) is 0.004033018, showing that the connectivity between the two regions is very low.
Table 2: An example correlation matrix for Subject #51463 in the ABIDE database. Each cell represents the correlation of the BOLD signals between the two regions in the row and column. For instance, the correlation between regions 4101 and 2001 (the right angular gyrus and the right posterior cingulate cortex respectively) is 0.004033018, showing that the connectivity between the two regions is very low.
Comparing ASD and non-ASD patients
Correlation The correlation matrices were divided between ASD and non-ASD patients and compared using Student’s t-test, and p-values were calculated for each correlation. Distinctions were made between patients’ age and sex: seniors show more functional connectivity than adults under 60 and children [8], and males show more general functional connectivity than females [9]. For the purpose of this project males and females fewer than 21 were analyzed, equating to 672 unique sets of fMRI data (Tables 3 and 4).
| 2001 | 2002 | 2101 | 2102 | 4101 | 4102 | 4501 | 4502 | 4701 | 4702 | |
|---|---|---|---|---|---|---|---|---|---|---|
| 2001 | 0 | |||||||||
| 2002 | 0.981198 | 0 | ||||||||
| 2101 | 0.000005 | 0.391096 | 0 | |||||||
| 2102 | 0.06 | 0.930402 | 0.966109 | 0 | ||||||
| 4101 | 0.022661 | 0.093218 | 0.248312 | 0.264363 | 0 | |||||
| 4102 | 0.378092 | 0.602298 | 0.487168 | 0.870952 | 0.579585 | 0 | ||||
| 4501 | 0.224730 | 0.463425 | 0.156665 | 0.436887 | 0.437908 | 0.797496 | 0 | |||
| 4502 | 0.558332 | 0.010898 | 0.119963 | 0.283832 | 0.21619 | 0.734751 | 0.797 123 | 0 | ||
| 4701 | 0.510730 | 0.478064 | 0.486969 | 0.350219 | 0.93479 | 0.033735 | 1 | 0.1 | 0 | |
| 4702 | 0.168370 | 0.745725 | 0.871615 | 0.135894 | 0.004571 | 0.806506 | 1 | 0.6 | 0 | 0 |
Note: The bold p-values, from top to bottom, are under 0.05, denoting that connectivity differs greatly in those two regions between ASD and non- ASD patients. From top to bottom, the connections are: Right posterior cingulate cortex (PCC) and the right medial prefrontal cortex (mPFC) (2101- 2001); Right posterior cingulate cortex and the right angular gyrus (4101-2001); Left posterior cingulate cortex and the left precuneus (4502-2002); Left dorsolateral prefrontal cortex (DLPFC) and the left angular gyrus (4701-4102); Right dorsolateral prefrontal cortex and the right angular gyrus (4702-4101).
Table 3: The p-values for each correlation. The bold p-values, from top to bottom, are under 0.05, denoting that connectivity differs greatly in those two regions between ASD and non-ASD patients. From top to bottom, the connections are: Right posterior cingulate cortex (PCC) and the right medial prefrontal cortex (mPFC) (2101-2001); Right posterior cingulate cortex and the right angular gyrus (4101-2001); Left posterior cingulate cortex and the left precuneus (4502-2002); Left dorsolateral prefrontal cortex (DLPFC) and the left angular gyrus (4701-4102); Right dorsolateral prefrontal cortex and the right angular gyrus (4702-4101).
| 2001 | 2002 | 2101 | 2102 | 4101 | 4102 | 4501 | 4502 | 4701 | 4702 | |
|---|---|---|---|---|---|---|---|---|---|---|
| 2001 | ||||||||||
| 2002 | 0.02358 | |||||||||
| 2101 | -4.61805 | -0.85819 | ||||||||
| 2102 | -1.8917 | -0.08737 | 0.04250 | |||||||
| 4101 | 2.28439 | 1.68106 | 1.15547 | -1.11707 | ||||||
| 4102 | 0.88200 | -0.52135 | -0.69520 | -0.16251 | -0.55426 | |||||
| 4501 | 1.21517 | 0.73364 | 1.41797 | -0.77793 | 0.77620 | -0.25669 | ||||
| 4502 | -0.58561 | -2.55308 | 1.55691 | 1-1.07261 | 1.23789 | 0.33895 | -0.25717 | |||
| 4701 | 0.65805 | -0.70982 | 0.69552 | -0.93482 | -0.08185 | -2.12759 | -0.01444 | 1.95208 | ||
| 4702 | 1.37895 | 0.32442 | -0.16167 | 1.49305 | -2.84539 | -0.24503 | 0.08586 | 0.46083 | 0.87677 |
Note: Each of the bold values are negative, denoting that for each of the significant differences in connectivity, patients with autism spectrum disorder have less functional connectivity than patients without autism spectrum disorder.
Table 4: The corresponding t-values for each connection. Each of the bold values are negative, denoting that for each of the significant differences in connectivity, patients with autism spectrum disorder have less functional connectivity than patients without autism spectrum disorder.
Comparing connectivity to phenotypic data
Using Pearson correlation, each patient’s correlation coefficients were compared to their assessment scores: their FIQ, VIQ, PIQ, and ADI subscores (social interaction, abnormalities in communication, and repetitive/stereotyped behaviors) [10]. The data were compared against an already established method of diagnosing autism spectrum disorder to verify that the discovered phenotypes were actually major phenotypes indicative of autism spectrum disorder. For example, Subject #51463 is a 20-year-old right-handed woman with autism. Her FIQ (full-scale IQ), VIQ (verbal IQ), and PIQ (performance IQ) scores were 102, 101, and 103 respectively. She scored a 24/30 on the Autism Diagnostic Interview Social Interaction Subscore, indicating a deficit in social communication (Tables 5 and 6).
| FIQ | VIQ | PIQ | ADI Social | ADI Verbal | ADI RRB | |
|---|---|---|---|---|---|---|
| 2001-2101+ | 0.01907 | 0.00545 | -0.0 1358 | -0.03427 | -0.06301 | -0.12245 |
| 2001-2101- | 0.07753 | 0.06881 | 0.01971 | NaN | NaN | NaN |
| 2001-4101+ | -0.01813 | 0.0424 | -0.04042 | 0.03435 | 0.04066 | 0.0209 |
| 2001-4101- | -0.00243 | 0.02382 | -0.007 | NaN | NaN | NaN |
| 2002-4502+ | -0.03061 | -0.02086 | -0.06611 | 0.08233 | 0.01711 | -0.00852 |
| 2002-4502- | -0.01392 | -0.04721 | 0.02639 | NaN | NaN | NaN |
| 4102-4701+ | 0.06205 | 0.0304 | -0.02981 | -0.02786 | 0.03 101 | 0.00267 |
| 4102-4701- | 0.0 1262 | -0.00741 | 0.06367 | NaN | NaN | NaN |
| 4101-4702+ | 0.08082 | 0.08156 | -0.0234 | 0.09068 | 0.08499 | -0.02104 |
| 4101-4702- | -0.11866 | -0.07336 | -0.10189 | NaN | NaN | NaN |
Note: Bold values are negative number means there is a negative relation between connectivity and the assessment scores. For instance, as connectivity between the right posterior cingulate cortex and right medial prefrontal cortex decreases in people with autism spectrum disorder (the first row of values), their full-scale IQ score, performance IQ score, and Revised Autism Diagnostic Interview Restricted and Repetitive Behaviors Subscore increase, demonstrating a higher chance of restricted and repetitive behaviors.
Table 5: The Pearson correlation coefficients between each patient’s connections and their assessment scores. Bold values are negative number means there is a negative relation between connectivity and the assessment scores. For instance, as connectivity between the right posterior cingulate cortex and right medial prefrontal cortex decreases in people with autism spectrum disorder (the first row of values), their full-scale IQ score, performance IQ score, and Revised Autism Diagnostic Interview Restricted and Repetitive Behaviors Subscore increase, demonstrating a higher chance of restricted and repetitive behaviors.
| FIQ | VIQ | PIQ | ADI Social | ADI Verbal | ADI RRB | |
|---|---|---|---|---|---|---|
| 2001-2101+ | 0.74425 | 0.92902 | 0.82457 | 0.5942 | 0.32601 | 0.05561 |
| 2001-2101- | 0.15432 | 0.22477 | 0.7296 | NaN | NaN | NaN |
| 2001-4101+ | 0.75653 | 0.48784 | 0.50922 | 0.5934 | 0.52646 | 0.74478 |
| 2001-4101- | 0.96444 | 0.67458 | 0.90225 | NaN | NaN | NaN |
| 2002-4502+ | 0.60051 | 0.733 | 0.27997 | 0.19999 | 0.78992 | 0.89447 |
| 2002-4502- | 0.79844 | 0.40522 | 0.64345 | NaN | NaN | NaN |
| 4102-4701+ | 0.28816 | 0.619 | 0.62641 | 0.66496 | 0.62904 | 0.96686 |
| 4102-4701- | 0.81686 | 0.89612 | 0.26369 | NaN | NaN | NaN |
| 4101-4702+ | 0.1662 | 0.18151 | 0.70246 | 0.15793 | 0.18486 | 0.74314 |
| 4101-4702- | 0.02893 | 0.19551 | 0.07324 | NaN | NaN | NaN |
Note: The bold text shows p-values for each correlation coefficient.
Table 6: The bold text shows p-values for each correlation coefficient. This table demonstrates that connectivity between the right posterior cingulate cortex and right medial prefrontal cortex is closely related to the individual’s full-scale IQ and performance IQ scores.
Error control
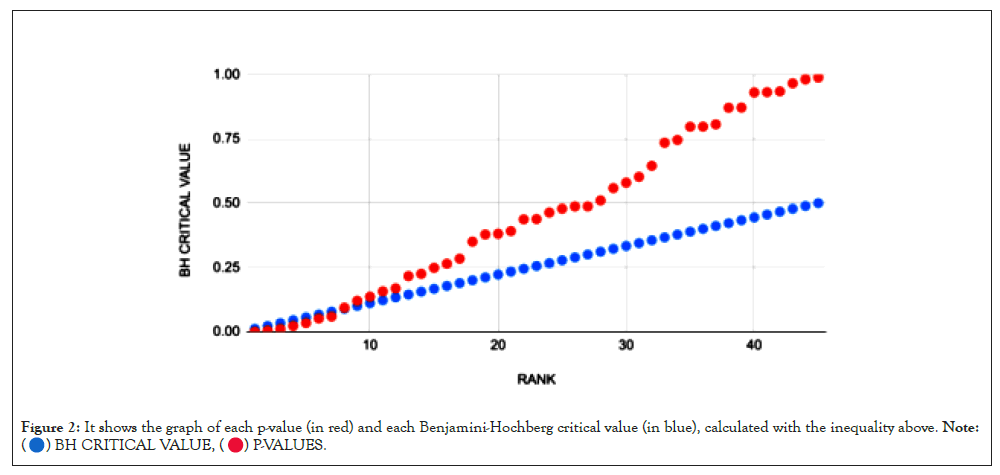
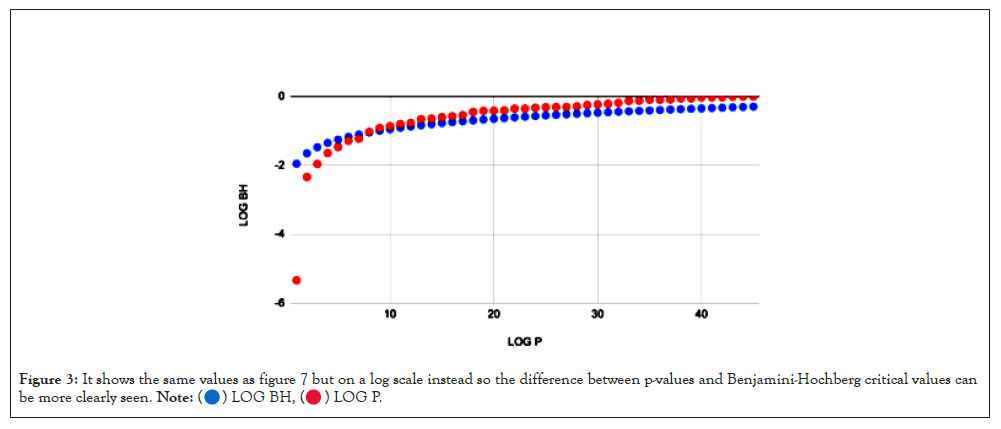
To correct for false positives, the Benjamini-Hochberg procedure was applied to the set of p-values generated for each correlation. It ranks the p-values least to greatest (1 to k) [11] and calculates the Benjamini-Hochberg critical value for each p-value according to the formula BH=k/m × α, where α refers to the p-value threshold (usually 0.05) and m refers to the total number of p-values [12]. Then, the greatest p-value less than its corresponding Benjamini-Hochberg critical value is found, and every p-value less than or equal to the chosen value is considered significant (Figures 2 and 3).

Figure 2: It shows the graph of each p-value (in red) and each Benjamini-Hochberg critical value (in blue), calculated with the inequality above. Note:

Figure 3: It shows the same values as figure 7 but on a log scale instead so the difference between p-values and Benjamini-Hochberg critical values can
be more clearly seen.
After comparing the mean correlation coefficient for each region and verifying the findings using the Benjamini-Hochberg procedure, it was found that the most notable neurocognitive phenotype of autism present in the default mode network is lower functional connectivity between the right Posterior Cingulate Cortex (PCC) and the right Medial Pre-Frontal Cortex (mPFC). This manifests as a higher chance of restricted and repetitive behaviors, like repetitive hand movements or repetitive speech like echolalia. Higher functional connectivity between the right angular gyrus and left dorsolateral prefrontal cortex was also noted in non-ASD patients; this manifests as higher FIQ and PIQ scores (Table 7).
| 2001 | 2002 | 2101 | 2102 | 4101 | 4102 | 4501 | 4502 | 4701 | 4702 | |
|---|---|---|---|---|---|---|---|---|---|---|
| 2001 | 0.00000 | 0.00020 | -0.02508 | -0.01045 | 0.01567 | 0.00577 | 0.00779 | -0.00409 | 0.00408 | 0.00914 |
| 2002 | 0.00020 | 0.00000 | -0.00535 | -0.00053 | 0.01377 | -0.00377 | 0.00494 | -0.01852 | -0.00459 | 0.00231 |
| 2101 | -0.02508 | -0.00535 | 0.00000 | 0.00028 | 0.00737 | -0.00479 | 0.00913 | 0.00835 | 0.00432 | -0.00107 |
| 2102 | -0.01045 | -0.00053 | 0.00028 | 0.00000 | -0.00717 | -0.00113 | -0.00493 | -0.00574 | -0.00532 | 0.01040 |
| 4101 | 0.01567 | 0.01377 | 0.00737 | ·0.00717 | 0.00000 | ·0.00462 | 0.00670 | 0.00915 | -0.00069 | -0.02200 |
| 4102 | 0.00577 | -0.00377 | -0.00479 | -0.00113 | -0.00462 | 0.00000 | -0.00198 | 0.00251 | -0.01748 | -0.00234 |
| 4501 | 0.00779 | 0.00494 | 0.00913 | -0.00493 | 0.00670 | -0.00198 | 0.00000 | -0.00170 | -0.00011 | 0.00064 |
| 4502 | -0.00409 | -0.01852 | 0.00835 | 0.00574 | 0.00915 | 0.00251 | ·0.00170 | 0 | 0.01259 | 0.00307 |
| 4701 | 0.00408 | -0.00459 | 0.00432 | -0.00532 | -0.00069 | -0.0175 | -0.00011 | 0.01259 | 0 | 0.0064 |
| 4702 | 0.00914 | 0.00231 | -0.0011 | 0.0104 | -0.022 | -0.0023 | 0.00064 | 0.00307 | 0.0064 | 0 |
Note: A more negative number designates lower functional connectivity between the two regions in autism spectrum disorder patients. The red box designates the connectivity difference between the right posterior cingulate cortex and the right medial prefrontal cortex. The blue highlighted box designates the connectivity difference between the left dorsolateral prefrontal cortex and the right angular gyrus.
Table 7: It indicates heatmap of differences in connectivity between ASD and non-ASD patients. A more negative number designates lower functional connectivity between the two regions in autism spectrum disorder patients. The red box designates the connectivity difference between the right posterior cingulate cortex and the right medial prefrontal cortex. The blue highlighted box designates the connectivity difference between the left dorsolateral prefrontal cortex and the right angular gyrus.
The hypothesis was supported by the data, but only partially. Instead of general under-connectivity between default mode network hubs, there was only under-connectivity between two regions of the default mode network: the right posterior cingulate cortex and the right medial prefrontal cortex.
This project is just one step towards establishing a methodology for discovering more neurocognitive phenotypes of autism spectrum disorder. This is extremely useful considering that the primary method of diagnosing autism spectrum disorder in children is observing a child’s behavior. Using resting-state fMRI to diagnose autism spectrum disorder allows doctors to diagnose autism spectrum disorder faster and potentially think of ways to reduce the most debilitating effects of autism spectrum disorder, such as delayed language and cognitive skills, epilepsy, and hyperactive or impulsive behavior.
In the future, larger collaborative datasets like ABIDE would be extremely useful for researchers. While ABIDE is comprehensive, much of the phenotypic data, such as intelligence scores or autism diagnostic scores, are not consistent between the 17 different research groups that supplied data. With a larger, more standardized dataset, phenotypic research and neuroimaging analysis would provide a much more detailed look at the neurophysiological causes of autism spectrum disorder. Once researchers discover a neural substrate for autism spectrum disorder, they can determine a therapeutic target for future gene therapies or drug therapies that can eliminate the most debilitating effects of autism spectrum disorder, like epilepsy or delayed development.
I would like to thank Dr. Joshua Lee from the UC Davis MIND Institute and Dr. Judith Ford from the UCSF Brain Imaging and EEG Laboratory for invaluable help with data collection, procedure development, and statistical analysis of the neuroimaging data.
This research received no specific grant from any funding agency in the public, commercial, or not-for-profit sectors.
All data is anonymized; the only phenotypic data available for each patient is their age, their gender, any medications they have taken, and their scores on various autism spectrum disorder assessment tests.
[Crossref] [Google Scholar] [PubMed].
[Crossref] [Google Scholar] [PubMed].
[Crossref] [Google Scholar] [PubMed].
[Crossref] [Google Scholar] [PubMed].
[Crossref] [Google Scholar] [PubMed].
[Crossref] [Google Scholar] [PubMed].
[Crossref] [Google Scholar] [PubMed].
[Crossref] [Google Scholar].
[Crossref] [Google Scholar] [PubMed].
[Crossref] [Google Scholar] [PubMed].
[Crossref] [Google Scholar] [PubMed]
Citation: Vasantha A (2022) Discovery of Neurocognitive Phenotypes of Autism by Analyzing Functional Connectivity in the Default Mode Network and Dorsolateral Prefrontal Cortex. J Clin Chem Lab Med.5:221.
Received: 30-Apr-2022, Manuscript No. JCCLM-22-17264; Editor assigned: 03-May-2022, Pre QC No. JCCLM-22-17264 (PQ); Reviewed: 17-May-2022, QC No. JCCLM-22-17264; Revised: 24-May-2022, Manuscript No. JCCLM-22-17264 (R); Published: 31-May-2022 , DOI: 10.35248/JCCLM.22.5.221
Copyright: © 2022 Vasantha A. This is an open access article distributed under the terms of the Creative Commons Attribution License, which permits unrestricted use, distribution, and reproduction in any medium, provided the original author and source are credited.