Journal of Proteomics & Bioinformatics
Open Access
ISSN: 0974-276X
ISSN: 0974-276X
Original Research Article - (2022)Volume 15, Issue 6
Alzheimer’s Disease (AD) has attracted the attention of many developed countries due to the increasing population of the elderly. Global statistics show that more people will be afflicted in the coming years. Due to the lack of definitive treatment for AD, this study aimed to discover and repurpose drugs to treat AD with an approach based on gene co-expression networks. In this study, genes related to AD were collected from recently published genetic articles and databases. Then, the gene co-expression network was reconstructed for the collected genes. Next, gene modules with similar expression levels were extracted using clustering algorithms and reported as important gene modules in AD. Also, to investigate the effects of genes obtained for microRNAs, the list of microRNAs that target the module genes was retrieved, and the miRNA-Mrna bipartite networks were reconstructed separately for the gene modules. After reconstructing the bipartite miRNA-mRNA networks, we checked the drug databases and identified genes targeting the modules. After identifying the drugs and their gene targets, we reconstructed the drug-gene networks for each module separately. Finally, some drugs that target more genes were selected, studied, and evaluated. The most important drugs were suggested as candidate drugs for treatment of AD.
Drug repurposing; Alzheimer; Systems biology; Gene co-expression network; Gene modules
Alzheimer’s disease (AD) is a neurological condition which is classified as a disease of old age for which there is no cure. Due to the aging population in countries, and considering the costs of AD, the study of AD has attracted the attention of many researchers [1]. The National Center for Health Statistics lists AD as the sixth leading cause of death in the United States [2]. People with AD face health problems and many disabilities throughout their life, which leads to a decrease in their quality of life. AD patients usually need someone to help them with their daily activities; thus, other people in the community are inadvertently involved in the disease [3]. AD is one of the costliest diseases, especially from an economic point of view in a society. The percentage of AD patients increases with population growth, making it difficult to optimally manage the patients [4]. The existing relevant articles can be divided into two main categories according to their approach. A high percentage of research in the field of AD is based on the use of brain images as data sources, and application of various image processing methods on such data [5]. The second category, which is the method proposed in this study, is to predict the likelihood of developing AD by using the gene co-expression data [6]. Given that there is no definitive cure for AD, it is important to predict the onset and treatment of the disease. In this regard, to achieve this goal, gene expression data may be used, which may lead to identification of biomarkers for this particular disease [7]. The discovery of biomarkers is one of the most important and challenging issues in genetic studies. Biomarkers play an important role in diagnosis, prognosis, and treatment of genetic diseases, especially AD. Various biomarkers such as DNA, RNA, protein and epigenetic markers have been introduced to predict and diagnose AD [8]. MicroRNAs are among the most important biomarkers in genetic diseases [9]. In mammals, about 50% of genes are regulated by microRNAs [10]. Therefore, any change in the expression of microRNAs can affect the biological process and cause a specific disease. Non-coding RNAs play an important role in the onset and progression of genetic diseases, especially AD [11]. There is a significant shortage of articles in the field of AD compared with other fields. Thus, more research is required in this field. Our inquiry concentrates on these gaps and attempts to extricate important bunches of genes. Materials and methods utilized dataset is depicted in detail, adopted technique and approaches are described. The results demonstrate the dataset description, enrichment examination of these quality bunches, and the experiments’ outputs by relevant charts and tables. The discussion contains clinical and therapeutic occurrences supporting the appropriateness of the proposed strategy.
Dataset collection
A list of all genes involved in AD (human genes) was first compiled based on recent credible articles from the NCBIPubMed database. The search was conducted on March 1, 2021, and a total of 431 AD-related genes were identified [12]. A stepby- step strategy was utilized.
Co-expression network
We utilized the STRING database to develop a PPI network. This database provides a comprehensive worldwide network that coordinates all the accessible PPI information. With this information, the gene expression network was reconstructed in Cytoscape software [13].
Clustering
Cluster examination of biological systems is one of the foremost vital approaches for distinguishing useful modules and anticipating protein functions and is supported by the Cytoscape platform. Cytoscape is an open-source bioinformatics software platform for visualizing molecular interaction networks and integrating them with gene expression profiles and other state data [14]. ClusterViz employs three distinctive clustering. The FAG-EC is a Fast AGglomerate algorithm of identifying functional modules based on the Edge Clustering coefficients. There are also two other clustering algorithms named MCODE and EAGLE [15].
Functional enrichment analysis
We proposed a novel method to standardize descriptions of enriched pathways for a set of genes using Gene Ontology terms. We used this method to examine the relationships among pathways and biological processes for a set of condition-specific genes, represented as a functional biological pathway-process network. To discover the vital pathways utilizing the DAVID database, the pathways with a typical p-value <0.05 were chosen as critical on the examined quality list [16].
Bipartite miRNA_mRNA networks
Since microRNAs have an important role in regulating gene expression, to further investigate the effect of microRNAs on module gene expression, a list of all microRNAs that regulate module genes was compiled separately for each module from the miRWalk database [17].
Drug-gene networks
Within the following step, the drugs that target the genes introduced in the modules reported in this study were extracted from the DGIdb database which is a noteworthy database overhaul by overhauling assets and adding new assets [18]. A summary of this content is shown in a flow chart in Figure 1.
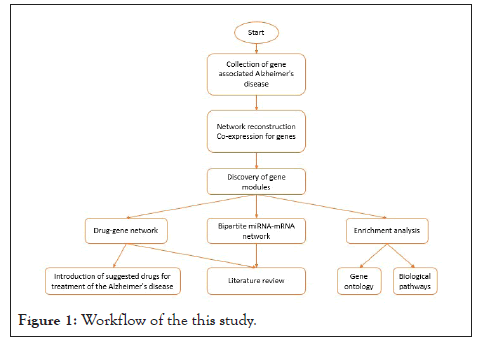
Figure 1: Workflow of the this study.
As shown in Figure 1, after collecting genes associated with AD, the network also reconstructed co-expression for genes and then extracted gene modules. Enrichment analysis which includes gene ontology and biological pathways was accomplished. Two sorts of bipartite networks, drug-gene networks, and miRNAmRNA networks, were constructed by gene modules. According to the primary purpose of this study, which is the introduction of drugs for AD, it was performed using a gene-drug network. Another examination for the proposed drugs was investigating previous experimental studies to demonstrate the rightness of the strategy.
Discovery of modules
Using network co-expression derived from the STRING that includes all interactions between genes, and reconstructing the network in Cytoscape software, it was observed that out of 431 genes, only 184 genes were co-expressed; thus, some of the genes that had no co-expression were not displayed in the network (Figure 2). The reconstructed network was modulated using the ClusterViz plugin by the FAG-EC algorithm. There is a parameter associated with FAG-EC algorithm, named “ComplexSize Threshold”. After doing various values, number 5 was chosen for this parameter, then 5 modules were selected and represented in Figures 3-7 and the list of genes in each module assemble are shown in Table 1.
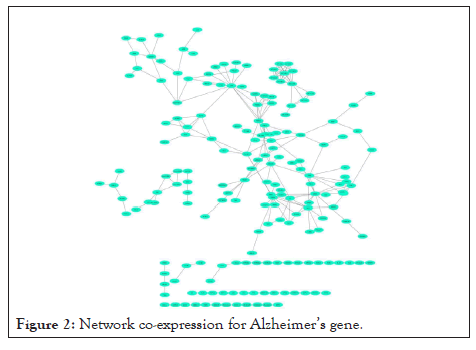
Figure 2: Network co-expression for Alzheimer’s gene.
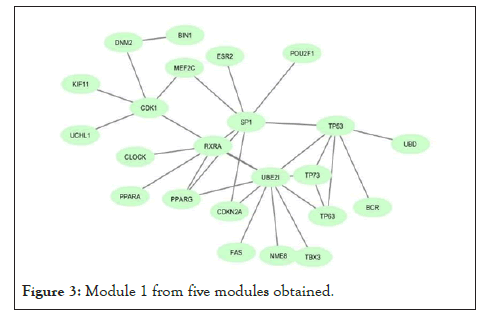
Figure 3: Module 1 from five modules obtained.
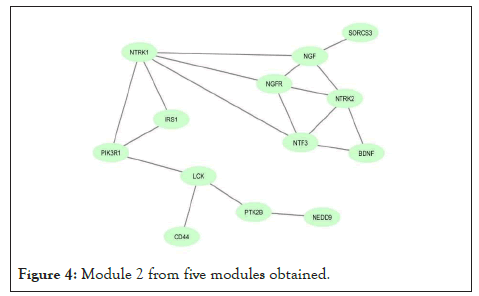
Figure 4: Module 2 from five modules obtained.
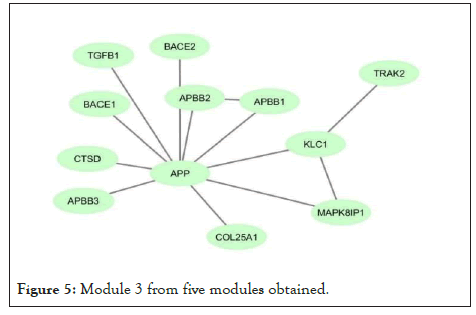
Figure 5: Module 3 from five modules obtained.
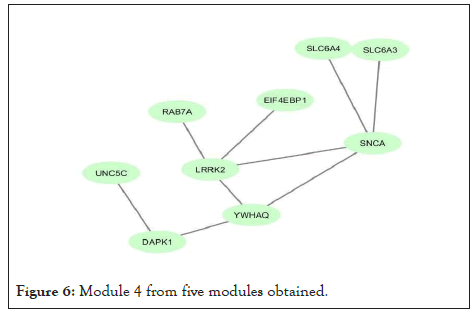
Figure 6: Module 4 from five modules obtained.
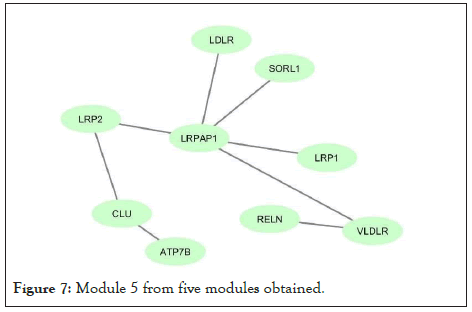
Figure 7: Module 5 from five modules obtained.
| Number of modules | List of genes | Number of genes |
|---|---|---|
| Module 1 | PPARG, UCHL1, RXRA, SP1, BIN1, NME8, ESR2, UBE2I, TP63, TP73, PPARA, FAS, MEF2C, UBD, KIF11, POU2F1, CDK1, TBX3, CLOCK, CDKN2A, TP53, BCR, DNM2 | 23 |
| Module 2 | NEDD9, NGF, SORCS3, NTRK1, LCK, NTRK2, PTK2B, BDNF, NGFR, NTF3, IRS1,PIK3R1, CD44 | 13 |
| Module 3 | COL25A1, BACE2, APP, BACE1, TRAK2, APBB1, KLC1, MAPK8IP1, CTSD, TGFB1, APBB3, APBB2 | 12 |
| Module 4 | LRRK2, YWHAQ, DAPK1, SLC6A3, SLC6A4, SNCA, EIF4EBP1, UNC5C, RAB7A | 9 |
| Module 5 | LRP2, RELN, LDLR, ATP7B, VLDLR, CLU, SORL1, LRP8, LRPAP1 | 9 |
Table 1: List of genes in each of the 5 modules.
Enrichment analysis
We accomplished functional enrichment for each module separately. The achievement is illustrated in separate table. According to gene ontology analysis, the most important biological processes for module 1 were the multi-organism process (P-value=1.05E-06) and it included 14 genes, growth (P-value=1.39E-05) with 9 genes, signaling (P-value=2.46E-05) with 19 genes, and cellular component organization or biogenesis (P-value=2.49E-05) with 19 genes. For module 2, locomotion was the most significant biological process with 9 genes (P-value=1.65E-06), signaling with 13 genes (P-value=7.16E-06), and response to stimulus with 13 genes (P-value=2.21E-04). In module 3, the important process was growth with 4 genes (P-value=0.020108). For module 4, signaling with 9 genes (P-value=3.72E-04), and for module 5 localization (P-value=2.23E-04) with 9 genes were the most important biological processes. The other imperative biological processes sorted by their p-value are accessible in isolated tables in additional File 1 (Tables 2-6). Based on biological pathway analysis, the most significant pathway for module 1 was the signaling pathway with 5 genes (P-value=2.27E-05). In module 2, it was the neurotrophin signaling pathway (P-value=4.74E-11) with 8 genes. In module 3, the most crucial pathway was AD with 4 genes (P-value=7.32E-04). For module 4, it was Parkinson’s disease with 3 genes (P-value=0.01092), but no pathway was found for module 5. Additional information obtained regarding all pathways is available in additional File 1 (Tables 7-10).
| Number of miRNA-mRNA network | List of miRNA candidates |
|---|---|
| Network 1 | hsa-miR-92a-3p (6), hsa-miR-124-3p(6), hsa-miR-21-5p(6), hsa-miR-34a-5p(5), hsa-miR-335-5p(5) |
| Network 2 | hsa-miR-335-5p(6), hsa-miR-204-5p(3), hsa-miR-200c-3p(3), hsa-miR-16-5p(3), hsa-miR-145-5p(3) |
| Network 3 | hsa-miR-17-5p(3), hsa-miR-19b-3p(3), hsa-miR-26b-5p(3), hsa-miR-484(3), hsa-miR-335-5p(3) |
| Network 4 | hsa-miR-335-5p(3) |
| Network 5 | hsa-miR-130b-3p(3), hsa-miR-17-5p(3), hsa-miR-93-5p(3) |
Table 2: List of miRNAs that targeted modules.
| Number of drug-gene networks | List of candidate drugs |
|---|---|
| Network 1 | PROGESTERONE(4), CISPLATIN(4), ABEMACICLIB(3), BEZAFIBRATE(3), CARBOPLATIN(3), CLOFIBRATE(3), FENOFIBRATE(3), GEMCITABINE(3), RALOXIFENE,HYDROCHLORIDE(3) |
| Network 2 | PILOCARPINE(4), FOSTAMATINIB(4), METHADONE(3), CYCLOPHOSPHAMIDE(3),PTK2B(3) |
| Network 3 | AMIFOSTINE(2), ALUMINUM ACETATE(2 |
| Network 4 | FOSTAMATINIB(2), DAPK1(2), VENLAFAXINE(2), DEXMETHYLPHENIDATE(2), CHLORPHENIRAMINE(2), LEVOMILNACIPRAN(2), METHYLPHENIDATE(2),ATOMOXETINE(2), PSEUDOEPHEDRINE(2), MIANSERIN(2), TRIMIPRAMINE(2), ESCITALOPRAM(2), OPAMINE(2), SERTRALINE(2), NEFAZODONE(2), OXAPINE(2), MAZINDOL(2), UPROPION(2), PHENELZINE(2), AMPHETAMINE(2), PHENTERMINE(2), CLOMIPRAMINE(2), AMOXAPINE(2), COCAINE(2), SOLRIAMFETOL(2), DULOXETINE(2), DESVENLAFAXINE(2), ARIPIPRAZOLE(2), MEPERIDINE(2), IMIPRAMINE(2), CLOZAPINE(2), HALOPERIDOL(2) |
| Network 5 | All drugs in this network just have one target gene |
Table 3: List of drugs extracted for each module.
| Term | Count | PValue | Bonferroni | Benjamini | FDR |
|---|---|---|---|---|---|
| GO:0040007~growth | 4 | 0.020108 | 0.320188 | 0.382046 | 0.382046 |
| GO:0008152~metabolic process | 11 | 0.068536 | 0.740489 | 0.651091 | 0.651091 |
Table 4: The list of results of gene ontology for module 3.
| Term | Count | P-Value | Bonferroni | Benjamini | FDR |
|---|---|---|---|---|---|
| GO:0023052~signaling | 9 | 3.72E-04 | 0.007414 | 0.00744 | 0.004464 |
| GO:0007610~behavior | 4 | 0.001795 | 0.035285 | 0.01336 | 0.008016 |
| GO:0099531~presynaptic process involved in chemical synaptic transmission | 3 | 0.002004 | 0.039326 | 0.01336 | 0.008016 |
| GO:0051179~localization | 8 | 0.003543 | 0.068527 | 0.01463 | 0.008778 |
| GO:0050896~response to stimulus | 9 | 0.003658 | 0.070664 | 0.01463 | 0.008778 |
| GO:0032501~multicellular organismal process | 8 | 0.01138 | 0.204591 | 0.037932 | 0.022759 |
| GO:0032502~developmental process | 7 | 0.020279 | 0.336183 | 0.05794 | 0.034764 |
| GO:0050789~regulation of biological process | 9 | 0.032004 | 0.478243 | 0.077931 | 0.046759 |
| GO:0071840~cellular component organization or biogenesis | 7 | 0.035069 | 0.510306 | 0.077931 | 0.046759 |
| GO:0065007~biological regulation | 9 | 0.049993 | 0.641458 | 0.099985 | 0.059991 |
Table 5: The list of results of gene ontology for module 4.
| Term | Count | PValue | Bonferroni | Benjamini | FDR |
|---|---|---|---|---|---|
| GO:0051179~localization | 9 | 2.23E-04 | 0.003561 | 0.003566 | 0.003121 |
| GO:0032501~multicellular organismal process | 9 | 9.38E-04 | 0.014907 | 0.007506 | 0.006568 |
| GO:0032502~developmental process | 7 | 0.020279 | 0.279492 | 0.108155 | 0.094635 |
| GO:0050896~response to stimulus | 8 | 0.033413 | 0.419434 | 0.133654 | 0.116947 |
Table 6: The list of results of gene ontology for module 5.
| Term | Count | P-Value | Bonferroni | Benjamini | FDR |
|---|---|---|---|---|---|
| hsa04115:p53 signaling pathway | 5 | 2.27E-05 | 0.001746 | 0.001748 | 0.001634 |
| hsa05202:Transcriptional misregulation in cancer | 5 | 7.86E-04 | 0.058727 | 0.030249 | 0.028285 |
| hsa05216:Thyroid cancer | 3 | 0.002518 | 0.176458 | 0.052652 | 0.049233 |
| hsa05200:Pathways in cancer | 6 | 0.002735 | 0.190142 | 0.052652 | 0.049233 |
| hsa05223:Non-small cell lung cancer | 3 | 0.009161 | 0.507685 | 0.141077 | 0.131916 |
| hsa05168:Herpes simplex infection | 4 | 0.011258 | 0.581803 | 0.142239 | 0.133003 |
| hsa03320:PPAR signaling pathway | 3 | 0.012931 | 0.632918 | 0.142239 | 0.133003 |
| hsa05220:Chronic myeloid leukemia | 3 | 0.014834 | 0.6836 | 0.142774 | 0.133503 |
| hsa05206:MicroRNAs in cancer | 4 | 0.036525 | 0.943022 | 0.297612 | 0.278286 |
| hsa04110:Cell cycle | 3 | 0.040854 | 0.959718 | 0.297612 | 0.278286 |
| hsa05162:Measles | 3 | 0.046381 | 0.974185 | 0.297612 | 0.278286 |
| hsa05160:Hepatitis C | 3 | 0.046381 | 0.974185 | 0.297612 | 0.278286 |
| hsa04932:Non-alcoholic fatty liver disease (NAFLD) | 3 | 0.058212 | 0.990128 | 0.344792 | 0.322403 |
| hsa05016:Huntington's disease | 3 | 0.08853 | 0.999205 | 0.486913 | 0.455296 |
| hsa05203:Viral carcinogenesis | 3 | 0.098979 | 0.999673 | 0.491534 | 0.459616 |
Table 7: The list of results of biological process for module 1.
| Term | Count | P-Value | Bonferroni | Benjamini | FDR |
|---|---|---|---|---|---|
| hsa04722:Neurotrophin signaling pathway | 8 | 4.74E-11 | 3.98E-09 | 3.98E-09 | 3.84E-09 |
| hsa04010:MAPK signaling pathway | 5 | 3.15E-04 | 0.026113 | 0.013228 | 0.012755 |
| hsa04210:Apoptosis | 3 | 0.003433 | 0.250914 | 0.096135 | 0.092702 |
| hsa04750:Inflammatory mediator regulation of TRP channels | 3 | 0.008392 | 0.507319 | 0.17623 | 0.169936 |
| hsa04151:PI3K-Akt signaling pathway | 4 | 0.011529 | 0.622442 | 0.179077 | 0.172682 |
| hsa04650:Natural killer cell mediated cytotoxicity | 3 | 0.012791 | 0.660878 | 0.179077 | 0.172682 |
| hsa04015:Rap1 signaling pathway | 3 | 0.035517 | 0.952056 | 0.426208 | 0.410987 |
| hsa04014:Ras signaling pathway | 3 | 0.040641 | 0.969351 | 0.426732 | 0.411492 |
| hsa04960:Aldosterone-regulated sodium reabsorption | 2 | 0.055305 | 0.991596 | 0.516178 | 0.497743 |
| hsa04930:Type II diabetes mellitus | 2 | 0.06767 | 0.997221 | 0.568426 | 0.548125 |
| hsa04923:Regulation of lipolysis in adipocytes | 2 | 0.078538 | 0.998962 | 0.568663 | 0.548354 |
| hsa04150:mTOR signaling pathway | 2 | 0.081238 | 0.999189 | 0.568663 | 0.548354 |
| hsa05230:Central carbon metabolism in cancer | 2 | 0.089293 | 0.999613 | 0.576968 | 0.556362 |
Table 8: The list of results of biological process for module 2.
| Term | Count | PValue | Bonferroni | Benjamini | FDR |
|---|---|---|---|---|---|
| hsa05010:Alzheimer's disease | 4 | 7.32E-04 | 0.024594 | 0.024892 | 0.024892 |
Table 9: The list of results of biological process for module 3.
| Term | Count | PValue | Bonferroni | Benjamini | FDR |
|---|---|---|---|---|---|
| hsa05012:Parkinson's disease | 3 | 0.01092 | 0.2727 | 0.316675 | 0.316675 |
Table 10: The list of results of biological process for module 4.
Bipartite miRNA-mRNA network
For all 5 modules extracted from the co-expression network, we separately extracted the list of miRNAs that regulate the genes of these modules. Five high-grade miRNA-mRNAs were constructed and selected in these networks, illustrated by Cytoscape, and sorted by the degree of the genes. The Bipartite miRNA-mRNA network is demonstrated in Figures 8-12. The list of miRNAs with their degree is shown in Table 11.
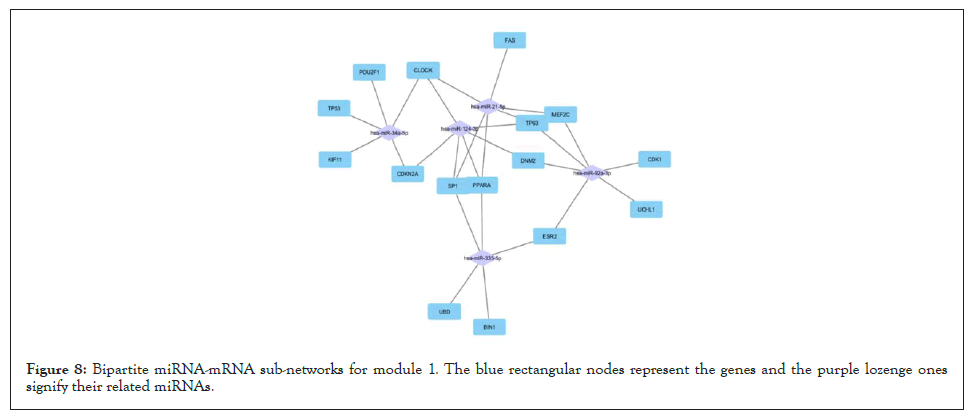
Figure 8: Bipartite miRNA-mRNA sub-networks for module 1. The blue rectangular nodes represent the genes and the purple lozenge ones signify their related miRNAs.
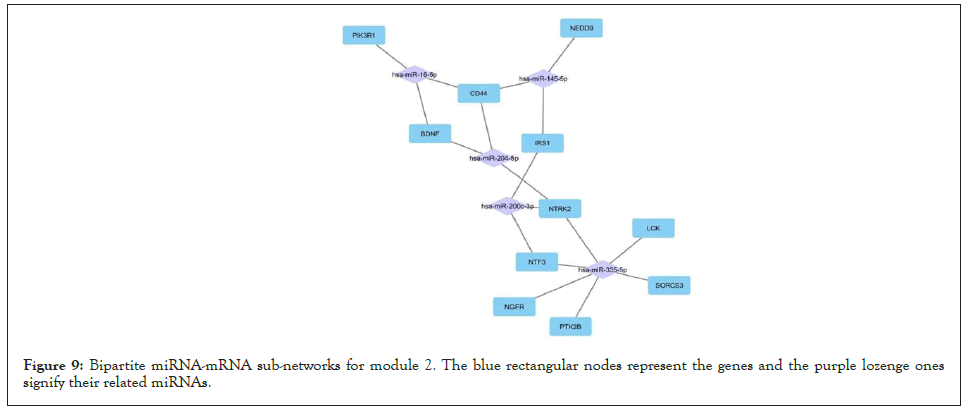
Figure 9: Bipartite miRNA-mRNA sub-networks for module 2. The blue rectangular nodes represent the genes and the purple lozenge ones signify their related miRNAs.
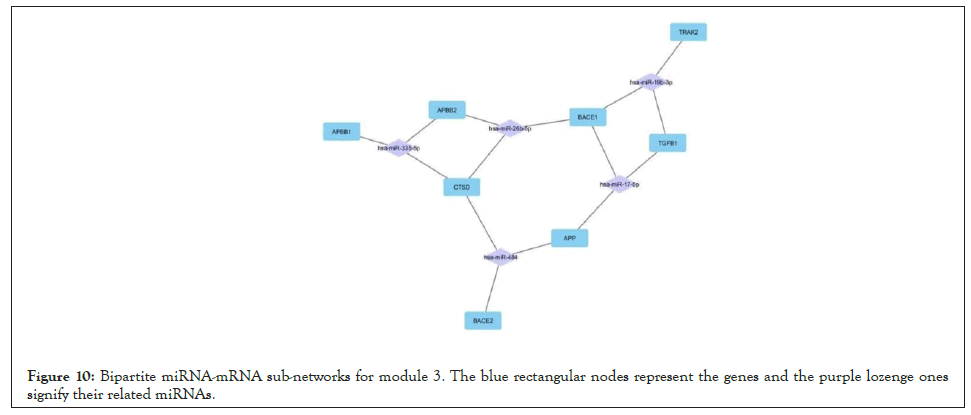
Figure 10: Bipartite miRNA-mRNA sub-networks for module 3. The blue rectangular nodes represent the genes and the purple lozenge ones signify their related miRNAs.
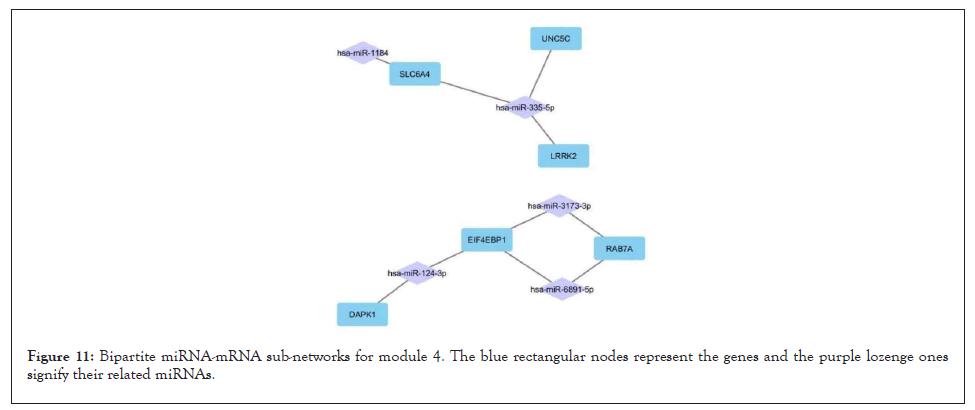
Figure 11: Bipartite miRNA-mRNA sub-networks for module 4. The blue rectangular nodes represent the genes and the purple lozenge ones signify their related miRNAs.
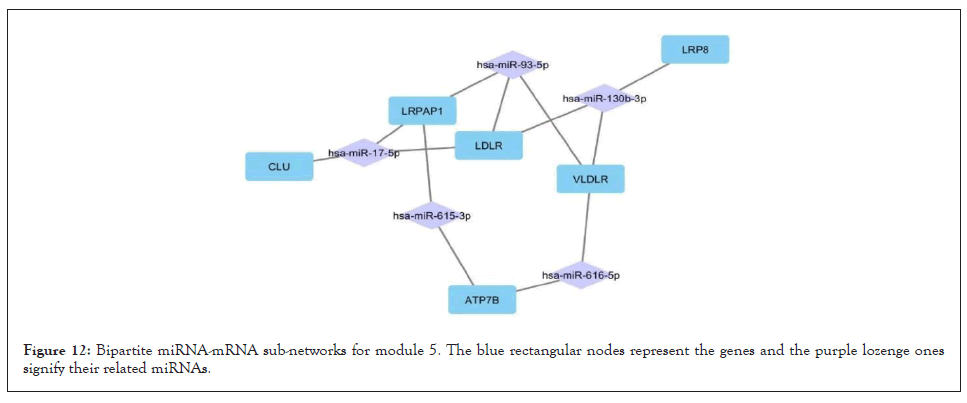
Figure 12: Bipartite miRNA-mRNA sub-networks for module 5. The blue rectangular nodes represent the genes and the purple lozenge ones signify their related miRNAs.
| Term | Count | P-Value | Bonferroni | Benjamini | FDR |
|---|---|---|---|---|---|
| GO:0051704~multi-organism process | 14 | 1.05E-06 | 2.11E-05 | 2.11E-05 | 2.11E-06 |
| GO:0040007~growth | 9 | 1.39E-05 | 2.78E-04 | 1.25E-04 | 1.39E-05 |
| GO:0023052~signaling | 19 | 2.46E-05 | 4.92E-04 | 1.25E-04 | 2.46E-05 |
| GO:0071840~cellular component organization or biogenesis | 19 | 2.49E-05 | 4.98E-04 | 1.25E-04 | 2.49E-05 |
| GO:0032502~developmental process | 18 | 3.36E-05 | 6.71E-04 | 1.34E-04 | 3.36E-05 |
| GO:0048511~rhythmic process | 6 | 4.36E-05 | 8.71E-04 | 1.45E-04 | 4.36E-05 |
| GO:0050789~regulation of biological process | 23 | 7.71E-05 | 0.001541317 | 2.20E-04 | 7.71E-05 |
| GO:0032501~multicellular organismal process | 19 | 1.50E-04 | 0.002997949 | 3.75E-04 | 1.50E-04 |
| GO:0022414~reproductive process | 9 | 2.21E-04 | 0.004406655 | 4.46E-04 | 2.21E-04 |
| GO:0000003~reproduction | 9 | 2.23E-04 | 0.004451289 | 4.46E-04 | 2.23E-04 |
| GO:0065007~biological regulation | 23 | 2.63E-04 | 0.00524958 | 4.78E-04 | 2.63E-04 |
| GO:0051179~localization | 17 | 3.42E-04 | 0.006812641 | 5.70E-04 | 3.42E-04 |
| GO:0050896~response to stimulus | 20 | 3.72E-04 | 0.007423321 | 5.73E-04 | 3.72E-04 |
| GO:0008152~metabolic process | 21 | 0.007768471 | 0.144420326 | 0.011097816 | 0.007768471 |
| GO:0002376~immune system process | 8 | 0.033073244 | 0.489645961 | 0.043736527 | 0.033073244 |
| GO:0007610~behavior | 4 | 0.034989222 | 0.509495181 | 0.043736527 | 0.034989222 |
Table 11: The list of results of gene ontology for module 1.
Drug-gene network
We separately extracted 5 drug-gene networks from the DGIdb database for each module and selected only drugs with more targeted genes in each module. Their constructed drug-gene network is demonstrated in Figures 13-17. By using this database, the drugs related to each gene of the modules with their degree are illustrated in Table 12.
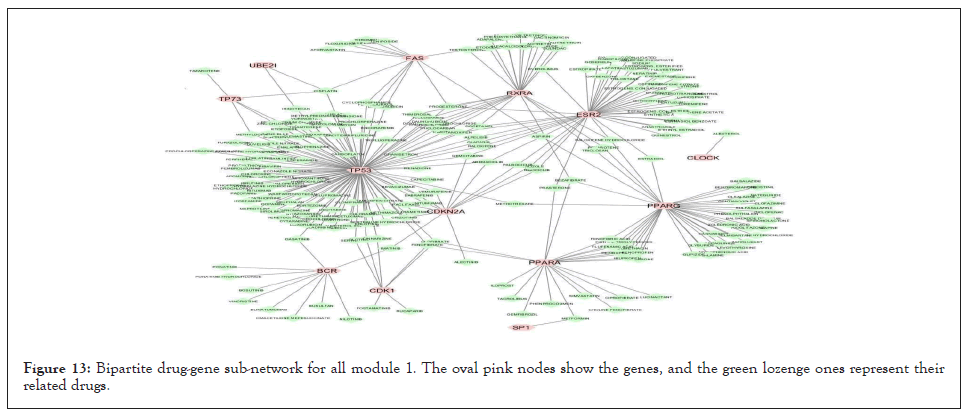
Figure 13: Bipartite drug-gene sub-network for all module 1. The oval pink nodes show the genes, and the green lozenge ones represent their related drugs.
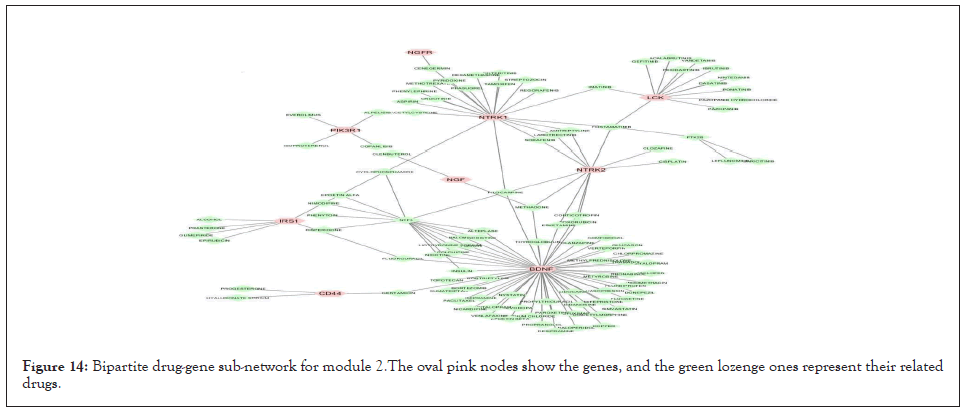
Figure 14: Bipartite drug-gene sub-network for module 2.The oval pink nodes show the genes, and the green lozenge ones represent their related drugs.
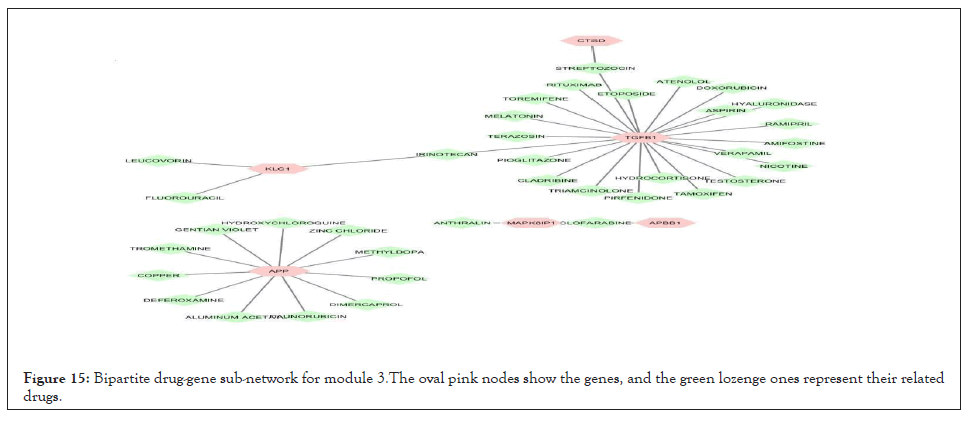
Figure 15: Bipartite drug-gene sub-network for module 3.The oval pink nodes show the genes, and the green lozenge ones represent their related drugs.
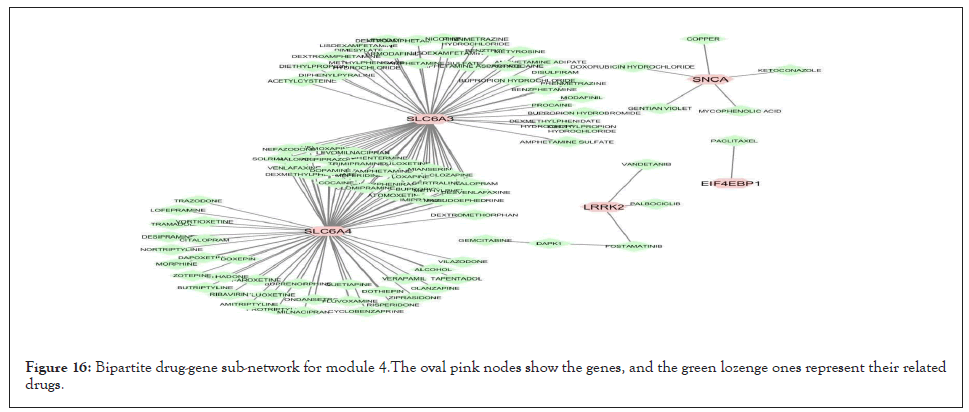
Figure 16: Bipartite drug-gene sub-network for module 4.The oval pink nodes show the genes, and the green lozenge ones represent their related drugs.
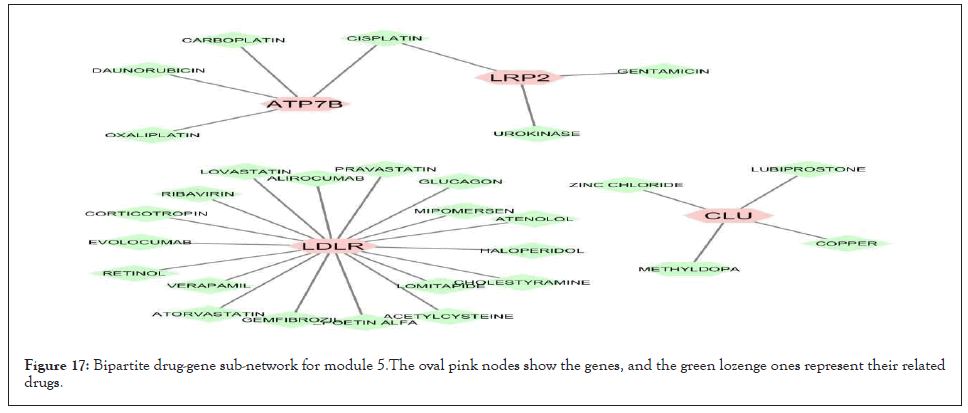
Figure 17: Bipartite drug-gene sub-network for module 5.The oval pink nodes show the genes, and the green lozenge ones represent their related drugs.
| Term | Count | P-Value | Bonferroni | Benjamini | FDR |
|---|---|---|---|---|---|
| GO:0040011~locomotion | 9 | 1.65E-06 | 3.31E-05 | 3.31E-05 | 1.32E-05 |
| GO:0023052~signaling | 13 | 7.16E-06 | 1.43E-04 | 7.16E-05 | 2.86E-05 |
| GO:0050896~response to stimulus | 13 | 2.21E-04 | 0.004408 | 0.001473 | 5.89E-04 |
| GO:0032502~developmental process | 10 | 0.004032 | 0.077624 | 0.016697 | 0.006679 |
| GO:0032501~multicellular organismal process | 11 | 0.004174 | 0.080254 | 0.016697 | 0.006679 |
| GO:0050789~regulation of biological process | 13 | 0.005721 | 0.108411 | 0.01907 | 0.007628 |
| GO:0071840~cellular component organization or biogenesis | 10 | 0.009081 | 0.166774 | 0.025946 | 0.010378 |
| GO:0065007~biological regulation | 13 | 0.011171 | 0.20122 | 0.027927 | 0.011171 |
| GO:0048511~rhythmic process | 3 | 0.020085 | 0.333543 | 0.04376 | 0.020085 |
| GO:0002376~immune system process | 6 | 0.02188 | 0.357546 | 0.04376 | 0.02188 |
| GO:0051179~localization | 9 | 0.025324 | 0.40131 | 0.044865 | 0.025324 |
| GO:0022610~biological adhesion | 5 | 0.026919 | 0.420598 | 0.044865 | 0.026919 |
| GO:0007610~behavior | 3 | 0.058178 | 0.698435 | 0.089504 | 0.058178 |
| GO:0044699~single-organism process | 13 | 0.065259 | 0.740685 | 0.093227 | 0.065259 |
Table 12: The list of results of gene ontology for module 2.
In this study, we assessed the genes related to AD and reconstructed the gene co-expression network for them to find effective genes related to AD. Next, we performed modulation and enrichment analysis for each module; accordingly, we detected the biological processes and biological pathways for each module to better understand their function [19]. Due to the importance of miRNAs in genetic disorders, we selected 4 miRNAs with a higher degree that targeted 6 genes of a module (hsa-miR-92a-3p, hsa-miR-124- 3p, hsa-miR-21-5p and hsa-miR-335-5p). Then, sub-networks for each group were constructed. In a previous study, Hsa-miR- 92a-3p was reported to play a key regulatory role in AD19. Also, another study reported this miRNA in AD, and MCI showed a high rate of expression [20]. Another study demonstrated the association of this miRNA with cancer and AD [21]. The second miRNA was hsa-miR-124-3p. A previous study showed its significant downregulation in AD [22,23]. Also, this miRNA has been studied in connection with diseases that destroy the nervous system [24]. Another study showed the role of this miRNA in neurological diseases, especially in AD [25,26]. The next miRNA was hsa-miR-21-5p. Another study demonstrated that hsa-miR-21- 5p had a significant effect on both AD and cancer [27]. In another published paper on genetic differences between dementia with Lewy bodies and AD, the authors reported significantly lower expression of hsa-miR-21-5p in AD than in dementia with Lewy bodies [28]. A study based on analysis of omics data reported the effect of hsa-miR-21-5p on AD [29]. The last miRNA was hsa-miR-335-5p. The present study showed that this miRNA had a low expression rate in AD patients [30]. In addition, this miRNA has been introduced as a biomarker for the diagnosis of AD and Mild Cognitive Impairmrnt (MCI) atients [31]. In order to introduce efficient drugs, target drugs were extracted and their drug-gene network was constructed; next, we sorted drugs by their degree. The highest grade drugs that target and control all 4 genes in a module are Cisplatin, Progestrone, Pilocaprine, and Fostamatinib. Cisplatin, Progesterone and Pilocarpine have been extensively studied in the field of neurological diseases and the effect of these drugs on AD has also been studied. Of the above mentioned 4 drugs, no study was found regarding the efficacy of Fostamatinib in the field of neurological diseases and AD. According to our literature review, Cisplatin has been reported to be effective in treating oxidative stress in AD and other neurological diseases [32,33]. Another study reported the optimal efficacy of this drug [34-37]. The effect of Progesterone on glucose metabolism of neurons has also been investigated and its effectiveness for protection of neurons was confirmed [38]. The efficacy of this drug along with estrogen for AD was tested and evaluated in mice [39]. Another study showed optimal efficacy of this drug in reducing depressive disorders in AD in mice [40]. Some other studies confirmed that this drug has an optimal effect on neurological diseases [41-43]. Pilocarpine can be used to diagnose AD [44,45], and also for prevention of AD [46]. Another study investigated the effect of this drug on Parkinson’s disease [47]. Extensive investigations have been conducted on this drug and its association with neurological diseases[14,15,48-51]. There is no study on the effect of Fostamatinib on AD, and this drug can be studied and tested as a new candidate for treatment of AD. The drugs identified in the present study can be used for AD, and other drugs can be candidates for further experiments in this regard.
In this study, the main goal was to identify and re-target drugs in treatment of AD. Therefore, from a bio systemic approach and by presenting a new methodology, an attempt was made to identify drugs related to AD. In addition, a number of miRNAs that have a functional and fundamental effect on gene expression were identified and introduced as biomarkers for AD. In the proposed methodology, after collecting genes related to AD from various articles, a gene expression network for the collected genes was reconstructed. Then, 5 gene modules (gene clusters) were extracted from the gene expression network, which has almost the same level of expression and was introduced as functional modules for AD. Then the list of miRNAs that regulate and target the genes of these 5 modules was retrieved, and then some of the miRNAs that regulate a large number of module genes were identified as important and effective miRNAs in AD. In addition to introduce a list of miRNAs, a study was conducted on targeting drugs in treatment of AD. As such, drugs targeting the genes in all 5 modules were extracted from valid databases, and then 5 drug-gene networks were reconstructed separately for each gene module. Drug-gene networks of these drugs, which target many genes, were identified as effective drugs in AD. The total number of drugs that target the modules genes was 1222. From these drug-gene networks, only high-grade drugs were selected and introduced for re-targeting in AD. The candidate drugs and miRNAs can be experimentally examined in future works.
[Crossref] [Google Scholar] [PubMed].
[Crossref] [Google Scholar] [PubMed].
[Crossref] [Google Scholar] [PubMed].
[Crossref] [Google Scholar] [PubMed].
[Crossref] [Google Scholar].
[Crossref] [Google Scholar] [PubMed].
[Crossref] [Google Scholar] .
[Crossref] [Google Scholar].
[Crossref] [Google Scholar] [PubMed].
[Crossref] [Google Scholar] [PubMed].
[Crossref][Google Scholar][PubMed].
[Crossref] [Google Scholar] [PubMed].
[Crossref] [Google Scholar] [PubMed].
[Crossref] [Google Scholar] [PubMed].
[Crossref] [Google Scholar] [PubMed].
[Crossref][Google Scholar][PubMed].
[Crossref] [Google Scholar] [PubMed].
[Crossref] [Google Scholar] [PubMed].
[Crossref] [Google Scholar] [PubMed].
[Crossref] [Google Scholar] [PubMed].
[Crossref] [Google Scholar] [PubMed].
[Crossref][Google Scholar][PubMed].
[Crossref] [Google Scholar] [PubMed].
[Crossref] [Google Scholar] [PubMed].
[Crossref] [Google Scholar] [PubMed].
[Crossref] [Google Scholar] [PubMed].
[Crossref] [Google Scholar] [PubMed].
[Crossref][Google Scholar][PubMed].
[Crossref] [Google Scholar] [PubMed].
[Crossref] [Google Scholar] [PubMed].
[Crossref] [Google Scholar] [PubMed].
[Crossref] [Google Scholar] [PubMed].
[Crossref] [Google Scholar] [PubMed].
[Crossref] [Google Scholar] [PubMed].
[Crossref] [Google Scholar] [PubMed].
[Crossref] [Google Scholar] [PubMed].
[Crossref] [Google Scholar] [PubMed].
[Crossref] [Google Scholar] [PubMed].
[Crossref][Google Scholar][PubMed].
[Crossref] [Google Scholar] [PubMed].
[Crossref] [Google Scholar] [PubMed].
[Google Scholar] [PubMed].
[Crossref] [Google Scholar] [PubMed].
[Crossref] [Google Scholar] [PubMed].
[Crossref] [Google Scholar] [PubMed].
[Crossref] [Google Scholar] [PubMed].
[Crossref] [Google Scholar] [PubMed].
[Crossref] [Google Scholar] [PubMed].
[Crossref] [Google Scholar] [PubMed].
[Crossref][Google Scholar][PubMed].
Citation: Amini S (2022) Drug Repurposing For Treatment of Alzheimer’s Disease Using Gene Co-Expression Networks. J Proteomics Bioinform. 15:590.
Received: 09-Jun-2022, Manuscript No. JPB-22-17876; Editor assigned: 13-Jun-2022, Pre QC No. JPB-22-17876 (PQ); Reviewed: 27-Jun-2022, QC No. JPB-22-17876; Revised: 04-Jul-2022, Manuscript No. JPB-22-17876 (R); Published: 11-Jul-2022 , DOI: 10.35248/0974-276X.22.15.590
Copyright: © 2022 Amini S. This is an open access article distributed under the terms of the Creative Commons Attribution License, which permits unrestricted use, distribution, and reproduction in any medium, provided the original author and source are credited.