Journal of Clinical and Experimental Ophthalmology
Open Access
ISSN: 2155-9570
ISSN: 2155-9570
Research Article - (2013) Volume 4, Issue 5
Objective: To develop a method for detecting drusen and quantifying drusen size in macular region from standard color retinal images for early diagnosis of Age related Macular Degeneration (AMD).
Materials and methods: Color retinal images were used which were captured by Canon D60 non-mydriatic camera for genetic and epidemiology study. Local intensity distribution, adaptive intensity thresholding and edge information were used to detect potential drusen areas. For validation, we considered 50 images with various types of drusen. For the drusen area segmentation accuracy (DAA), 12 images were selected, and an expert grader marked the drusen regions in pixel level. We then quantified the areas and compute the sensitivity and specificity by comparing the drusen detected output images with the hand-labeled ground truth (GT) images.
Results: The proposed method detected the presence of any drusen with 100% accuracy (50/50 images). For drusen detection accuracy (pixel level), mean sensitivity and specificity values of 74.94% and 81.17%, respectively. For drusen subtypes we achieved 79.59% accuracy in intermediate drusen and 82.14% in soft drusen which is a highly significant result for early and intermediate AMD detection.
Conclusion: In this study, we applied a novel automated method for drusen detection and quantification which is ready to be used in initial screening of early stage of AMD and drusen area changes i.e., AMD progression. The method will also be highly suitable for telemedicine platforms in ophthalmology for selecting patient from rural areas using fundus imaging - for refereeing to an expert ophthalmologist.
Keywords: Fundus image, Age-related macular degeneration (AMD), Macula, Drusen, Gaussian derivative, Region growing technique
Age-related macular degeneration (AMD) is the leading cause of vision loss in people over the age of 50 years in developed countries [1-3]. The number is expected to increase by ~1.5 fold over ten years due to ageing population [3,4]. While the treatment of AMD with antivascular endothelial growth factor (VEGF) is effective in maintaining or improving vision in the neovascular form of advanced disease, it does not provide a cure. Currently, there are no specific interventions available to stop the development of AMD. The Age-Related Eye Disease Study (AREDS) showed that specific anti-oxidant vitamin supplementation reduces the risk of progression from intermediate stages (defined as the presence of either many medium-sized drusen or one or more large drusen) to late AMD [5]. As further strategies are developed that might impact on the risk of progression from early to late disease, it will be important that we can identify amongst the group of people with early signs, those that have a significant risk of progression as these people are the ones that should be targeted to enter treatment trials and use interventions as they become available. Therefore, identifying people with early signs of the disease and then determining their risk based upon their fundus characteristics is important considering both the social and economic impact of AMD.
When determining the relative risk of a fundus with early stage AMD, standard retinal images are graded for the presence of drusen (i.e., deposits of cellular waste that form beneath the retina [6]). In turn, drusen are then classified into subtypes by their appearance and then the drusen area within the macular region is computed (Figure 1). Existing AMD grading systems require human grader’s subjective manual interaction, which is time consuming and difficult to maintain intra or inter-rater agreement [7-10]. Due to the high degree of graders’ involvement, the methods can be prone to inaccuracy and poor repeatability if experienced graders are not used [11]. Although a number of automated methods have been proposed for drusen detection, they mainly focus on detecting the drusen without quantifying its area [6,11-14]. In addition, to identification and quantification of drusen, their classification (e.g., hard and soft drusen, soft distinct or soft indistinct drusen) is also important. In this paper, we proposed a method which can automatically detect, classify and quantify drusen with subtypes for early AMD detection.

Figure 1: Retinal image showing macula in the center (left), hard drusen (middle) and soft drusen (right).
Drusen subtypes for AMD grading
Drusen are considered one of the first clinical sign of AMD and are yellow deposits lying beneath the retina on Bruch’s membrane which separates the retinal pigment epithelium from the underlying choroidal blood supply (Figure 1). Many people over the age of 60 will have some drusen [15] which can be classified depending upon their size. The international Classification and Grading System for Age Related Maculopathy defines hard drusen as having diameters up to 63 microns, intermediate drusen, between 63-125 microns and soft drusen which are greater than 125 microns (Figure 1) [16]. Soft drusen with uniform density with sharp margin are classified as soft ‘distinct” drusen, while those with fuzzy edges are classified as soft ‘indistinct’ drusen. In an effort to categorize eyes with early AMD into a scale of severity the Age- Related Eye Disease Study (AREDS) adopted 4 categories (No AMD, Early Stage AMD, Intermediate AMD and Advanced AMD) where each successive group denoted a higher risk of developing advanced AMD [17]. They defined “early stage AMD” as multiple hard drusen or intermediate drusen with or without RPE pigment abnormalities in one or both eyes. “Intermediate AMD” was defined as having soft drusen, extensive intermediate drusen without signs of advance AMD. Therefore, in an attempt to better define those people at significant risk of progression to vision loss the detection and classification of drusen is important.
Retinal imaging for AMD grading
Retinal color fundus imaging has been widely used for AMD grading. A number of grading protocols has been established for grading drusen and identify AMD stage using color fundus imaging. Among them Wisconsin Age-related Maculopathy Grading System, the International Classification and Grading System for Age-related Maculopathy and Age-related Macular Degeneration and its modified version are widely used [7,16,18]. The methods mainly use computer software tools that a grader uses to manually count the drusen through drawing different sizes of circles in the software interface. This is very time consuming, tedious and prone to human error. Although a number of automated methods have been proposed to detect drusen, they mainly identify the absence or presence of drusen. The techniques rely on image analysis algorithms such as global intensity thresholding [19], stochastic classification of pixels into object classes [20], histogram thresholding [2] and textures [12]. The challenging issues associated with drusen detection include the range in size, shape and intensity distribution for the same type of drusen. Intensity distribution varies a lot between drusen and even in a single druse. Therefore, global intensity thresholding and histogram thresholding may fail occasionally. Texture of drusen is also varying with different drusen types. Therefore, stochastic classification of pixels into object classes and texture based drusen segmentation do not work consistently. A huge improvement is required to achieve high accuracy with an automated system to identify drusen and categorize subtypes [11]. An automatic, accurate and efficient detection and quantification of drusen with considering drusen intensity distribution and shape information can provide a useful tool to define the severity of AMD. Use of such a tool would help determine the severity of risk for progressing to vision threatening advanced AMD. This will become more important as new interventions need to be trialed on high risk individuals and the ability to monitor the outcome through accurate measurement of macular changes becomes important.
Macular area mapping in color retinal imaging
We map the macular area to detect the drusen following the AREDS protocol. Macular area is mapped based on optic disc center and blood vessel. Using the macular center images, we determine the upper and lower arcade of the blood vessels based on optic disc center and approximate the macular area. We have developed algorithms for optic disc detection and blood vessel segmentation which are described elsewhere [21,22]. For completeness we briefly describe the methods.
Optic disc detection
We proposed a method for OD detection and center computation which utilizes OD size, shape and color information in the image [21]. Firstly, the method automatically determines the threshold intensity value by approximating the OD area information (considering average optic disc diameter 1800 microns) in each image and using this number to select the maximum intensity levels from the image histogram. Secondly, using this threshold value, the potential OD area is selected from the image. Following this, Region Growing Technique is applied in the thresholded image to identify the potential OD regions. Finally, the Hough circle detection algorithm is applied in the gradient image based on the potential OD regions to identify the OD and compute its center and radius.
Blood vessel detection
We presented a method for blood vessel segmentation based on the texture property analysis of vessel and non vessel parts in the color retinal image [22]. We use Gaussian and L*a*b* perceptually uniform color spaces with original RGB for texture feature extraction on retinal images. A bank of Gabor energy filters are used to analyze the texture features from which a feature vector is constructed for each pixel. The Fuzzy C-Means (FCM) clustering algorithm is used to classify the feature vectors into vessel or non-vessel based on the texture properties. From the FCM clustering output we attain the final output segmented image after a post processing step. Following that a morphological skeletonisation operation is applied on the segmented image to extract the vessel centerlines.
From the optic disc center and vessel center we map the macula area within 3000 microns of macula by approximating the upper and lower arcade of blood vessels. The method for macular area mapping is followed the method described in Niemeijer, et al. study [23]. In this paper, we focus on an automated technique for drusen identification, sub-classification and quantification. The overall method for drusen detection from macular area is shown in Figure 2. The proposed drusen analysis method can be subdivided into two major modules: (1) drusen segmentation and detection (i.e., quantification of drusen area) and (2) number of intermediate and soft drusen computation.

Figure 2: Block diagram of the proposed drusen detection and quantification method.
Drusen segmentation
Vessel and background mask generation: A healthy retinal image depicts the optic disc, blood vessels and macula. Drusen show up in the retina as bright objects. Thus, in order to detect drusen, the pixels of any retinal image are divided into three pixel groups based on the intensity levels for any retinal image; these are dark pixel, medium range of intensity pixel and bright pixel. The vessel and macula pixels mostly belong to dark pixel group, the background pixels belong to medium range intensity pixel and the bright pixel group represents the drusen, optic disc and other bright objects. The image is analyzed by using local histograms by splitting the image into a number of blocks of pixel window. For each block of the image, the pixels are ranked based on intensity levels and appropriate cluster number is added. For this, we analyze the intensity histogram and compute a cutoff intensity level based on the histogram signal. In general, it is less than 10% of the pixels which are vessel pixels in the retinal image. We use this percentile value in the macular area to find the cutoff intensity value for vessel pixels using an intensity histogram.
We use 50 × 50 pixels window of image region to compute the histogram and intensity distribution. This allows us to adjust the local intensity level in the image. Once we compute the pixel cluster we construct a mask. Figure 3 shows the mask for potential drusen areas in white color to be considered for final drusen detection. Most of the vessel areas are removed after applying this mask. We aim to remove only the noise and background from this mask generation. Our final drusen detection is based on using the drusen pattern which is described in the next subsections.
Figure 3: Mask showing edge pixel detection in horizontal, vertical and both diagonal directions (left) and edge image after removing most vessel and background (right).
Preprocessing by Gaussian derivative: We apply Gaussian derivative in the image to produce edges of the potential drusen regions. The Gaussian derivative image is obtained after convolving with the Gaussian derivative kernel to produce the potential edges. The Gaussian kernel is obtained by derivation of the Gaussian smoothing kernel. The Derivative of Gaussian smoothing kernel can significantly enhance the edge properties and hence, can be used in edge tracking based vessel detection. Due to the image properties (i.e., 2-D and discrete), we use 2-D Gaussian mask with its first derivative. The Gaussian derivative is applied on the Green channel image, which returns the highest contrast between vessel and background from all three color channels in the original retinal RGB image. For implementation, a 2-D Gaussian first derivative kernel is constructed and is used for convolving the image. The Gaussian distribution in 2-D form is as follows [24]:
where σ is the standard deviation of the distribution, and x and y define the kernel position.
In theory, the Gaussian distribution is non-zero everywhere, which would require an infinitely large convolution kernel, but in practice it is effectively zero from more than 3σ ; so the kernel is truncated at this point. For implementation, we used 5 × 5 window sized Gaussian kernel with standard deviation of 3. First Derivative operation is implemented for using the magnitude of the gradient. The gradient of M(x,y) at location (x,y) is defined as the two dimensional vector G(x,y)=[G’x, G’y]=
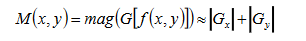
where the angle is measured with respect to the x-axis. M(x, y) is created as an image of the same size as the original one, when x and y are allowed to vary over all pixel locations. It is common practice to refer to this image as the gradient image and for edge detection, we are focusing in the magnitude M(x,y).
Filtering vessel and background for potential drusen area detection: Once we apply Gaussian derivative and produce the gradient image we then map and remove the small vessel regions which we produce earlier as vessel and background mask. Simple AND logical operation between the gradient image and vessel mask will produce the desired output. Then we filter out the vessel pixels from the gradient magnitude image and consider the remaining pixels for drusen detection.
Edge pixel grouping: Edge pixel grouping is applied after filtering the background and vessel from the gradient image. The seeded region growing operation [24] is applied on the filtered gradient image to find the potential drusen edges. This is accomplished by scanning the image from the beginning and start of the region growing process once an edge pixel is found. The initial seed pixel is selected by searching a particular intensity pattern from a window w of 1 × 5 pixels (Figure 4). Within a window w, the center pixel i is considered as an edge pixel if it satisfies the criteria: w[i-2] ≤ w[i-1 ≤ w[i] ≥ w[i+1] ≥ w[i+2]. Once the initial seed pixel is selected, the region is mapped by seeded region growing technique. We apply this technique as it is robust in fuzziness of the edge and able to detect real edges other than noisy edges (Figure 4). Due to the fuzziness of the edge in soft drusen, the edge pixels are detected considering the specific pattern in the gradient distribution rather than thresholding the gradient magnitude.

Figure 4: Retinal cropped image showing drusen, vessel and background (left) and mask showing region of interest with removing vessel and partial background (right).
Filter discrete noise points
Discrete noises due to impulse noise and background irregularities are removed by measuring the area or number of pixels. After detecting the edges, individual regions are traced based on the detected edges. Finally, regions having area or number of pixels less than a certain threshold are discarded and otherwise, assigned a unique identification number for each region.
Drusen detection
After noise removal, the size and shape of each region is analyzed to detect the region as a druse as follows. We detect the potential regions that are the edges of the objects in the image we check the size and shape of the objects. We trace individual regions and assign a unique identification number for each of the regions. Following this, we analyze the size and shape for each of the regions as follows:
Drusen shape analysis: A druse is circular or oval shaped region. These shapes are 2-D and can be represented using a real or complex 1-D function. Our focus is to determine the shape of the identified regions, to verify whether it is circular or oval, using the boundary and centroid. The region, its centroid and boundary points are shown in Figure 5. In the first variation of the idea, the values of the 1-D function for circular or oval shapes are equal to distances between centroid and boundary points [25]. Boundary points are selected so that the central angles are equal. In this study, we use the distance between subsequent boundary points for the 1-D function values and compute the ratio of the minimum and maximum radius to determine the shape as circular or oval. Drusen with shapes different from circular or oval are discarded at this stage.

Figure 5: The Centroid to boundary distance approach.
Drusen size analysis: After shape filtering, drusen are filtered based on the size. Since, all drusen are now either circular or oval shaped, the diameter of the region provides the size of the region. In this study, we calculate diameter of each shape filtered drusen and then discard regions with diameter more than 600 microns (1 pixel=7 microns). These size filtered regions are finally detected as the drusen of the retinal image.
Define and quantify true drusen areas: Each druse detected in the gradient image is inversely mapped in the druse image using the center of the druse. The true area is calculated based on the druse boundary and region information from the image which includes drusen (Figure 6). Calculation of individual druse area allows us to map individual size and the total drusen area in the macula, which allow us to define the severity of early AMD. For each druse we count the number of pixels, and compute the area in microns. The calibration factor between the pixels per distance is utilized for finding the area in microns. We used seeded region growing technique [24] to map the pixels belong to each regions which are identified as drusen earlier. Finally, we provide a summary of drusen based on the size in diameter and area.

Figure 6: Original retinal cropped gray scale image of the macula (left) and processed image for drusen detection output (right).
In this study, we compared our automated drusen detection method with manually graded retinal images. We considered twelve images randomly selected by an experience retinal image grader which include variety of drusen types. The performance is measured in two steps:
(1) Drusen detection accuracy (DDA): DDA represents the percentage of retinal images with the presence or absence of drusen detected correctly. DDA focused on absent and present of drusen compared to those grade d by the grader.
(2) Drusen area accuracy (DAA): For DAA the same grader marked the drusen regions (we call them hand-labeled ground truth images) from the images using a software tool i.e., Photoshop. We then quantified the areas as the sensitivity and specificity by comparing the drusen detected output images with the hand-labeled ground truth (GT) images. Considering drusen pixel positive and background pixel negative, we used the following formula and computed the sensitivity and specificity:
Sensitivity=TP/(TP+FN)
Specificity=TN/(TN+FP)
where, TP is the number of overlapped positive pixels in drusen and GT image FP is the number of positive pixels in drusen image does not match with GT image, TN is the number of overlapped negative pixels in drusen and GT image, FN is the number of negative pixels in drusen image does not match with GT image.
(3) Numbers of drusen: For drusen types accuracy measurement we selected the images which includes intermediate drusen and soft drusen. We then counted the numbers of each drusen type in the individual images for both manually measured and automatically detected. We compute the number of intermediate drusen (63-125 microns) and soft drusen (>125 microns) and compute the accuracy in percentage.
We achieved 100% (50/50 images) for drusen detection accuracy as absent or present drusen in the image. Table 1 shows the sensitivity and specificity for the individual images in drusen area accuracy. For drusen segmentation accuracy in pixel-by-pixel, we achieved an overall mean sensitivity of 74.94% (53.40% to 100%, median 75.10%) and 81.17% (51.92% to 98.32%, median 86.15%). We note that we can extend the computation of overall drusen area covered in the macular region by summing the individual druse area. For drusen subtypes accuracy, the total number of subtypes and detected drusen for individual images are shown in Table 2. We note that the subtypes were present in five images for the dataset we considered. Our method could identify all the intermediate drusen. On average, we achieved 79.59% for intermediate drusen detection and 82.14% for soft drusen detection. Table 3 shows the results. On average each image took less than a second to segment the image and indentify the drusen subtypes.
| Image | Sensitivity (%) | Specificity (%) |
|---|---|---|
| Image 1 | 53.40 | 98.32 |
| Image 2 | 68.56 | 87.38 |
| Image 3 | 76.37 | 67.51 |
| Image 4 | 71.21 | 76.91 |
| Image 5 | 81.32 | 69.75 |
| Image 6 | 72.48 | 92.94 |
| Image 7 | 100 | 51.92 |
| Image 8 | 79.20 | 88.94 |
| Image 9 | 73.78 | 89.30 |
| Image 10 | 77.72 | 74.08 |
| Image 11 | 55.29 | 92.59 |
| Image 12 | 90.13 | 84.84 |
Table 1: Sensitivity and specificity for drusen area accuracy individual images.
| Image number | Intermediate Drusen (63-125 microns) | Soft Drusen (>125 microns) | ||
|---|---|---|---|---|
| Total No. | Correctly detected | Total No. | Correctly detected | |
| 1 | 8 | 8 | 3 | 3 |
| 2 | 15 | 12 | 11 | 9 |
| 3 | 12 | 5 | 5 | 2 |
| 4 | 6 | 6 | 5 | 5 |
| 5 | 8 | 8 | 4 | 4 |
Table 2: Number of intermediate and soft drusen for individual images.
| Drusen types | Total number of drusen (in 12 images) | Correctly detected | Accuracy (%) |
|---|---|---|---|
| Intermediate Drusen (63-125 microns) | 49 | 39 | 79.59 |
| Soft Drusen (>125 microns) | 28 | 23 | 82.14 |
Table 3: Overall accuracy on intermediate and soft drusen detection.
In this paper, we present a novel method of drusen detection which will enable fast, accurate automated method to determine the characteristics of drusen. We achieved high accuracy in the quantification of individual druse area with 74.94% sensitivity and 81.17% specificity. We consider this as high accuracy where some soft drusen area is very difficult to identify by human eye due to the fuzziness of the boundary. While the existing drusen detection algorithms achieve similar results (maximum sensitivity on drusen detection reported as 74% [26]) our method outperforms them in the area of efficiency (takes less than 0.5 seconds for an image) which is important to grade large datasets and drusen grading with human grader intervention for poor quality images. Among the detected drusen types, we determine intermediate drusen with 79.59% accuracy and soft drusen with 82.14% accuracy. This is very important to identify an individual at early or late stage of AMD following international drusen grading protocols. We note that we did not do any separate accuracy analysis on hard drusen detection. The reasons are - firstly, hard drusen alone has no significant effects on AMD severity and secondly, the measurement of overall accuracy and the soft drusen detection accuracy is sufficient to understand the level of accuracy for drusen types. Our method can also be used for telemedicine platform in ophthalmology where automation is necessary for selecting patients from rural areas using fundus imaging for refereeing to an expert ophthalmologist.
We emphasize that there is not any existing method to grade drusen with 100% accuracy, thus a human grader intervention is a necessity to select all drusen types. As our method is very efficient, involving a human grader should provide an accurate and efficient system. However, this system needs to be validated in terms of repeatability of producing the results by grading the same image with two individual graders. We plan to conduct this study in future. The method can also be combined with the Spectral Domain Optical Coherent Tomography (SD-OCT) image grading system which can provide drusen volumetric information [27]. Thus, a grading system can be developed which can grade fundus imaging and SD-OCT separately and use the drusen size, area and volume information, and can be used as complement to each other. As new interventions for early AMD become available for therapeutic trials we believe this automated method will be useful in helping define endpoints within early AMD so that the ability to slow progression to advanced AMD can be well characterized using fundus images.