Journal of Geography & Natural Disasters
Open Access
ISSN: 2167-0587
ISSN: 2167-0587
Research Article - (2024)Volume 14, Issue 1
Background: Bangladesh is in a high-risk zone of earthquake hazard due to historical records, geological evident and recent trends in earthquake. The Comprehensive Disaster Management Program (CDMP) predicting a seven-magnitude earthquake causing serious human tragedy in Dhaka owing to the defective structure. This study considered the characteristics of RCC building elements and their behaviors to assess the risk against earthquake vulnerability in Lalmatia of Dhaka city. The purpose of this study is to assess the earthquake vulnerability in the existing buildings using Turkish method and to investigate the earthquake vulnerability priority using Analytical Hierarchy Process.
Methods: This study considered the Turkish method for calculating building seismic performance by Peak Ground Velocity (PGV). In the method of this research, a pair wise comparison matrix for a numerical relationship between two elements and the Analytical Hierarchical Process (AHP) model has been applied to decide in weight and to get rank of the vulnerability factors. By weighted sum vector among the six factors and calculating Vulnerability Index (VI), the overall vulnerability were identified in Lalmatia. Using Geographic Information System (GIS) and defining an ordinal scale of calculated result, the vulnerability status of single buildings of the study area is presented here.
Results: This research demonstrates that 8.23% buildings are highly vulnerable and 14.24% buildings are moderately vulnerable to earthquake. About 77.53% buildings are less vulnerable. As the study area is in a major urban center (Dhaka City), the scenario of unplanned urbanization increases the overall vulnerability to higher scale. With the value of Turkish method the vulnerability level is higher compared to AHP method. At the time of AHP model the range of vulnerability levels is depended on huge population, very high construction age, narrow road and building use as residential.
Conclusions: This research examines the earthquake vulnerability in the areas of Lalmatia and Dhaka, with a focus on the use of GIS mapping to provide detailed information on the buildings vulnerability. The model that is applied in this study will expressly contribute to the vulnerability appraisement and also helps to take mitigation attempts of Dhaka city against earthquake.
Analytical hierarchy process; Earthquake; Retrofit; Social appraisal; Vulnerability
Dhaka with estimated population in 2020 is roughly 2.1 million and density of population is 44,500 per sq.km [1]. UN- Habitat which is a muddy plain including of a shallow water table [2,3].
Unplanned urbanization has been going on rapidly for the last few decades without appropriate planning. Consequently, fast urbanization has resulted in hasty population growth and unplanned building to accommodate Dhaka city dwellers. Dhaka is said as one of the 20 most risky cities in the world in the perspective of the earthquake risk and infrastructure protection disaster risk index [4]. Though Bangladesh has not evidenced any serious damaged earthquake for more than 100 years but the unplanned situation of the infrastructure and the geological situation may happen that Bangladesh is at high risk of damaging earthquake in upcoming future [5-7].
Earthquake seismic problems faced by the undulating ground and cities in Bangladesh (e.g., Chittagong and Dhaka city) and the problems are also enlarging the spatial vulnerability as like as movement of plate, neo-tectonic depression, geological development and weekend in earth structure [8-16]. The city with rapid population and unplanned urbanization [16], without seismic capacity multi-storied buildings [17] and old aged building which is non-regulated with seismic capacity also may added dangerous problems in earthquake [16-21]. In last 100 years Bangladesh and adjacent areas faced 1000 earthquakes taking a magnitude equal or more than 4 scale and earthquakes are expected equivalent about 60% of total natural disaster in world [22,23]
Without appropriate planning Dhaka is developing very fast and as a result we can see more incidents like the collapse of the Begunbari building on June 1, 2010. The buildings were built on wet land and in earthquake the soil liquefaction may happened on this building [24]. The Meteorological Department and BUET has identified about 90 earthquakes were occurred in Bangladesh through May 2007 to July 2008. Among the identified history of earthquakes, nine of which are above five on the Richter scale and 95% of which were within a radius of 600 km of Dhaka city [25]. CDMP assessed that the Madhupur fault generates 7.5 Mw magnitude for Dhaka city [5-7]. According to this assessment, out of total 3,26,000 buildings, approximately 270,604 buildings will be at least moderately damaged which comprises over 89% of total building stock. Besides 238,164 buildings will be damaged outside restoration. Around 260,788 and 182,450 people will die respectively for an earthquake taking place at 2:00 AM and 2:00 PM. Around 1,527,668 people will be displaced aftermaths an earthquake [5-7].
An assessment was piloted by ADPC from February 2008 to August 2009 in Bangladesh Government initiatives titled on Comprehensive Disaster Management Program (CDMP). According to this study, a 7.5 magnitude earthquake originated from the Madhupur fault could have killed at least 1,30,000 people if the earthquake had been attacked in daytime in Dhaka. An earthquake of 8 Richter scale created close to the Chittagong of plate boundary fault 2 may kill about 69,900 people living in the capital if the earthquake had been attacked in daytime. There may 13,600 people need to be hospitalized and 61,288 people may need first aid treatment [26].
The planning interference in emergency evacuation preparedness may reduce the hazard impact [27,28]. Thus, the capital city Dhaka and Bangladesh both are extremely vulnerable to earthquake and considering these aspects the earthquake vulnerability in the study area of Lalmatia was conducted. The study was also conducted to realize the public’s awareness about the willingness of building owners to retrofit the existing building against earthquake vulnerability.
Aims and objectives
The main aim of this research is to assess the earthquake vulnerability of Lalmatia area, Dhaka city. To implement this aim, the following objectives have been taken into consideration: To assess the earthquake vulnerability in the existing buildings using Turkish method and to investigate the earthquake vulnerability priority using Analytical Hierarchy Process.
Data for this research were collected through field observation and checklist survey. Primary data will be collected about number about stories, existence of a soft story, apparent building quality, existence of heavy overhangs, shape of the building, existence of short columns and pounding effect. For the study sample size is calculated through the following procedure: Total population (Building) size (N)=1647, Error level (e)=5%, Confidence level 95% and sample size was determined as 316. Secondary data were collected from different published and unpublished materials, journals, websites of different responsible organization etc.
Study area
Lalmatia is located between Mohammadpur and Dhanmondi in the heart of Dhaka, Bangladesh as shown in Figure 1. Geographically the area located at latitude 23° 45’ 20.2068’’ N and longitude 90° 22’ 6.9276’’ E [29]. Known for its slender streets, and red bricked houses are now being currently experiencing a full-scale renovation. Satmasjid road, Old 27 number road and Mirpur road enclosures lalmatia from three sides [29].

Figure 1: Study area map. Note: 

Methods
The Turkish government and the Japan International Cooperation Agency (JICA) came forward to implement a regional earthquake assessment and rehabilitation program after the 1999 earthquake in Kocaeli and Duzce. The Turkish method Level-1 is used in this work. The first phase of the survey from the sidewalk was conducted by observers through a walkdown visit.
Survey parameters: The parameters selected in the Level-1 survey to indicate building vulnerabilities are as follows:
• General Information: Type of existing building, Number of building stories, Year of construction, Number of occupants, Maintenance record.
• Appearance of a soft story: Yes (=1) or No (=0)
• Appearance of heavy overhangs: Yes=1 or No=0
• Discernible building quality: Good=0, Moderate=1 or Poor=2
• Pounding possibility between adjacent buildings: Yes=0 or No=0
• Appearance of a short columns: Yes=1 or No=0
The intensity of ground motion at a particular location depends mainly on the efficiency of the distance and the local soil conditions. There is a strong relationship between PGV (Peak Ground Velocity) and local soil shear wave velocity [8]. So PGV was selected to represent the intensity of ground motion in the study. Peak Ground Velocity (PGV) can be taken between 40 cm /sec to 50 cm /sec [30]. Thus, Zone II (40
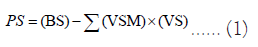
Building seismic performance: At first the vulnerability factors are fixed by the walk down survey and then the location of the building is determined by its location (by GPS survey), the seismic Performance Score (PS) can be finding out by using Equation 1. The Base Score (BS), the Vulnerability Scores Multiplies (VSM) and the Vulnerability Scores (VS) to be used in Equation 1 and the corresponding values are represented in Table 1.
| Number of stories | Base Scores (BS) | Vulnerability Scores (VS) | ||||
|---|---|---|---|---|---|---|
| Zone II | Soft story | Heavy overhang | Apparent quality | Short column | Pounding | |
| 1 or 2 | 130 | 0 | -5 | -5 | -5 | 0 |
| 3 | 120 | -15 | -10 | -10 | -5 | -2 |
| 4 | 100 | -20 | -10 | -10 | -5 | -3 |
| 5 | 85 | -25 | -15 | -15 | -5 | -3 |
| 6 or 7 | 80 | -30 | -15 | -15 | -5 | -3 |
Table 1: Base Score (BS) and Vulnerability Score (VS) for concrete buildings [31].
Then, the vulnerability value is found which is equal to the PS divided by BS. If this computed value is low, the vulnerability of the building will be high. Decide the range of vulnerability levels as shown in Table 2 in the study (very low, low, medium, high and very high) and develop a map of vulnerability of concrete buildings.
| Score | Vulnerability level |
|---|---|
| 0.1-0.2 | Very high |
| 0.21-0.4 | High |
| 0.41-0.6 | Moderate |
| 0.61-0.8 | Low |
| 0.81-1 | Very low |
Table 2: The range of Vulnerability score and level [31].
This assessment process of building vulnerability is only applicable for RCC (pucca) building. In this process tin shed and semi pucca buildings are not evaluate for the vulnerability assessment of the study area.
Analytical Hierarchy Process (AHP): The AHP approve the decision maker to create a model consisting complex problem in hierarchical way indicating the relevance of the goal, criteria, sub criteria and alternatives. It additionally permits the decision maker to incorporate each subjective and objective concerns during this method [32]. The AHP method involves the following basic steps:
• Construction of the hierarchy.
• Comparative judgments or executing data collection to achieve pair wise comparison data of the hierarchical structure on elements.
• Overall priority rating construction [33].
At the first stage, decision maker’s necessity to break down the complex multiple criteria decisions into its component. At each level of hierarchy, the criteria and sub criteria are not equally important to taking decision. In the decision-making task, AHP is able to consolidate and combine the evaluations of the criteria and alternatives by group or individual [34]. AHP and Multi criterion analysis is using in this study to explore the vulnerability of Lalmatia against earthquake torment. Table 3 explore that six parameters were selected to vulnerability appraisement and then six factors are further categorized into five sub criteria. Factors affecting the vulnerability against earthquake is shown in Table 3.
| Main criteria | Following criteria | Vulnerability | ||||
|---|---|---|---|---|---|---|
| Very high | High | Medium | Low | Very low | ||
| Building vulnerability by Turkish method | Wight | 9 | 7 | 5 | 3 | 2 |
| 0.1-0.2 | • | |||||
| 0.21-0.40 | • | |||||
| 0.41-0.60 | • | |||||
| 0.61-0.80 | • | |||||
| 0.81-1 | • | |||||
| Construction year of building | Before 1970 | • | ||||
| 1970-1980 | • | |||||
| 1981-1990 | • | |||||
| 1991-2000 | • | |||||
| 2001-2010 | • | |||||
| Population per building | 91 and more | • | ||||
| 90-71 | • | |||||
| 70-40 | • | |||||
| 40-21 | • | |||||
| 20-0 | • | |||||
| Area of parcel | Less than 100 m2 | • | ||||
| 101-250 m2 | • | |||||
| 251-500 m2 | • | |||||
| 501-1000 m2 | • | |||||
| More than 1000 m2 | • | |||||
| Road width | Less than 10' | • | ||||
| 10'-20' | • | |||||
| 21'-30' | • | |||||
| More than 30' | • | |||||
| Building use | Residential | • | ||||
| Educational | • | |||||
| Commercial | • | |||||
| Service facilities | • | |||||
| Official | • | |||||
Table 3: Factors affecting vulnerability along their weight.
Pair-wise comparison: Saaty developed the pair wise comparison method in the context of AHP (Analytical Hierarchy Process) [32]. Comparisons create a ratio matrix, as it takes the parameter in pair wise to produce the relative weights. Personal and subjective judgements can be taken in comparison [35]. At a given time, two elements compared of this analysis can reduces the conceptual complexity as shown in Table 4 [32,36,37]. Three task involves in this analysis:
• A comparison matrix development at each level of hierarchy.
• Relative weights calculation for each element of hierarchy.
• Consistency ratio estimating to check the judgment consistency [38].
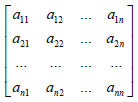
Analytical hierarchy used the 9-point scale for ranging from 1 to 9 (indifference or equal importance to extreme preference or absolute importance) which is shown in Table 4. In this comparison matrix elements are compared in pairs in each level with respect to importance. The decision maker evaluates the contribution of each factor in this pair wise comparison matrix. In the comparison matrix at a given level will be reduced to a number of square matrices M= [aij]n×n as in the following:
| Importance ranking | Meaning | Description |
|---|---|---|
| 1 | Equal rank | Two events give equal judgment |
| 3 | Weak position of one over another | Results are marginally favor one action over another |
| 5 | Strong importance | Result strongly favor one activity over another |
| 7 | Confirmed importance | Strongly favored an activity and its control is validated in practice |
| 9 | Entire importance | Strongly favored an activity and is the maximum potential order of confirmation |
| 2, 4, 6, 8 | Middle values between the two-neighboring decision | Negotiation is required |
| Reciprocals of above nonzero | If i shows the above nonzero numbers in the activity when comparing to activity j, then j will be common values in relating with i | |
Table 4: Relative important scale of point intensity.
Vector of weights, [W=W1,W2,……Wn] is calculated after formed the pair wise comparison matrix. The matrix M=[aij]n×n is normalized by Equation 2.
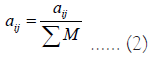
For all j=1, 2,... n.
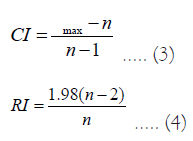
To calculate the CR, the CI (Consistency Index) and RI (Random Index) for each level of matrix of order “n” can be obtained from Equation 3 and Equation 4.
Then CR is computed using Equation 5
Here, RI is Random Consistency Index shown in Table 5 which is obtained from randomly generated pair wise comparison matric. The comparisons are acceptable if CR<0.1 and the comparisons are not acceptable if CR>0.1 which is inconsistent judgements. One should revise and reconsider in such cases with their original values in this matrix A.
| N (number) | 2 | 3 | 4 | 5 | 6 | 7 | 8 | 9 | 10 | 11 | 12 | 13 | 14 |
| Random Index (RI) | 0 | 0.58 | 0.9 | 1.12 | 1.24 | 1.32 | 1.41 | 1.45 | 1.49 | 1.51 | 1.48 | 1.56 | 1.57 |
Table 5: Comparison of random consistency index and number.
From the field investigation, it has been identified that several kind of land uses are presents in lalmatia like residential, commercial, educational, institutional, recreational etc as shown in Figure 2. A very general picture in the study area are the first floor of buildings used for commercial purposes when the upper floors are completely residential. It was found that many mixed use activity like shops, service activity, residence are belonging the same building at a time. Lalmatia is now taken by developer and rapid development contributes to land use change in this area. Privatization is main factors of land use change. Residential land use increases day by day. Now the residential land use is 81.83% of the total land of Lalmatia area. Field survey reveals that Lalmatia is residential area, here most of the buildings use is residential. Second most use type is commercial, and then community service. Table 6 will present the number of building with their use.
| Building use | Building number |
|---|---|
| Residential | 1347 |
| Commercial | 41 |
| Educational and research | 33 |
| Mixed use | 171 |
| Community service | 51 |
| Government services | 3 |
| Total | 1646 |
Table 6: Number of building with their use.

Figure 2: Land use map of Lalmatia area. Note: 


In case of response and recovery phase after a severe earthquake, road network especially road width has great momentous in moving the emergency vehicles. The road network of Lalmatia area is far better now. The road network has a deep relation with urban development because the easy communication system attracts all types of development. Development of road network contributes to urbanization in this area. Road map in Lalmatia area is shown on Figure 3.

Figure 3: Road network of Lalmatia. Note: Road category: 

There are different types of a buildings structure in Lalmatia area. Both contain three types of building like RCC, masonry and semi-pucca building as shown in Figure 4, but they are different in amount. Most of the building types are RCC. The modern RCC buidings are comparatively more safer during earthquake than old-fashion masonry building. The masonry structures are more risky during earthquake or building collapse.

Figure 4: Building types in Lalmatia, Dhaka. Note: 


Nowadays the structural development occurred and high-rise buildings are constructed rapidly. In Lalmatia area, 6 storied, 10 storied and 14 storied buildings are available. Different developer and private real estate firm constructed many high-rise buildings in this area. Different private hospitals, organization offices, commercial buildings, etc. are constructed at this time period. Arrangement of the buildings in the study area according to build height is shown on Figures 5 and 6.

Figure 5: Building stories map of study area. Note: Structure floor: 


Figure 6: Construction year map of buildings. Note: 


The relation between numbers of buildings with the presence of short columns (Existence/Nonexistence) in the building are displayed in the Table 7. Table 7 shows that about 4% buildings have short columns. Due to the presence of the short columns, building makes it subject to tensional effect.
| Presence of short column | |||
|---|---|---|---|
| Criteria | Existent | Non-existent | Total |
| No. of building | 13 | 303 | 316 |
| % of Presence of short column | 4% | 96.00% | 100% |
Table 7: Relation between numbers of buildings with the presence of short columns.
For analyzing the current building vulnerability of the study area, 316 buildings as shown in Figure 7 were selected based on preliminary survey. Such buildings were selected which are RCC, masonry and others type of buildings having one to above ten stories. The survey for seismic vulnerability analysis was mainly focused on earthquake issues such as identifying building type, number of building story, presence of soft story, presence of heavy overhang, apparent building quality, presence of short column, pounding effect, number of inhabitants, area of parcel, road width, building use, year of construction, etc.

Figure 7: Selected building for vulnerability assessment. Note: 


Lalmatia contain three types of building like RCC, masonry and semi-pucca building, but they are different in amount. Most of the building types are RCC. The relation between numbers of buildings with the number of stories (such as one-two, three-four, five-six and above stories) are shown in Figure 1. Figure shows that, five to six stories buildings are more (31.3%) than other stories in the study area as shown in Figure 8. After 2005, construction and reconstruction of buildings is increasing most in Lalmatia. Among 2005-2014, almost 47.8% buildings are constructed. Before 2005 building construction was more in 1985 to 1995. Again, construction of structures is increasing in last ten years as shown in Figure 9.

Figure 8: Number of stories of building. Note: 

Figure 9: Construction year of building. Note: Construction year:  After 2015.
In Figure 10 represent the relation between numbers of buildings with the presence of heavy overhangs. In the study area, found that most buildings tend to have overhangs (mostly balcony). Here, almost 38% building having a heavy overhang. Buildings with heavy overhang was built in most of the upper floor from two to three feet. Figure 11 reveals that the percentage of soft story buildings are less than the buildings without soft story. Almost 38% buildings having soft story. Figure 12 shows the relation between numbers of buildings with the apparent building quality in the study area. It is found that the majority of the apparent building quality is good in Lalmatia area, and it is almost 59.2%.

Figure 10: Presence of heavy overhang. Note: Existent.

Figure 11: Presence of soft story. Note:  Existent.

Figure 12: Apparent building quality. Note: 

Figure 13 represents the relationship between numbers of buildings with adjacent buildings pounding possibility. It is found from field survey that the majority of the buildings have been pounding possibility. Almost 59.8% buildings having pounding possibility. Lalmatia is the residential area and figure 14 depicts that almost 83.2% of the buildings used as residential purpose. Others building used for the purpose of commercial, service activity, education, and mixed purpose.

Figure 13: Pounding between adjacent building. Note:

Figure 14: Percentage of building use.
Vulnerability scoring by turkish method
This vulnerability scoring conducted on the total 316 building. To develop vulnerability score of these buildings first assigns the value of the given Table 1 parameter for individual building. Calculate a Performance Score (PC) of an individual building by using the base score from Table 1. Then find PS using PS = (BS) −Σ(VSM)×(VS) as shown in Table 8.
| Basic score=120 | ||||
|---|---|---|---|---|
| Base zone 2 No. of storied-3 |
VSM | VS | VSM × VS | |
| Soft story | Yes | 1 | -15 | -15 |
| Heavy overhang | No | 0 | 0 | 0 |
| Apparent quality | Moderate | 1 | -10 | -10 |
| Short column | Yes | 1 | -5 | -5 |
| Pounding possibility | No | 0 | 0 | 0 |
| ∑ (VSM) × (VS) | -30 | |||
Table 8: Example of vulnerability scoring by Turkish method
For calculating the vulnerability value individual PS divided by BS.
PerformanceSccore(PS) = BaseScore −Σ(VSM)×(VS) =120-30=90
So, Vulnerability Value=PS/BS =90/120=0.75
If the vulnerability value is low, the vulnerability of the building is high. Define a range of vulnerability levels (very high, high, moderate, low and very low) and developing the vulnerability map as shown in Figure 8 of the RCC building of Lalmatia.
Overall vulnerability scoring by AHP
AHP (Analytical Hierarchy Process) is a flexible, effective, and simple method to decision-making process. Saaty proposed the AHP method in 1980. It is a familiar method that decomposes several level decision-making problems through creating hierarchical relationship between different levels. This method uses comparison as a pair to distribute weights of different factors that helps to measuring the relative importance through the suing Saaty’s 1 to 9 level scales. Consistency Ratio (CR) is also calculating to verify the judgmental coherence. The accepted consistency ratio must be about 0.1 or less. This method includes following three steps-
• Two comparison matrices generation
• Calculation of weights for different factors
• Calculation of agreement ratio
Generating of a binary comparison matrix
According to Saaty, a pair wise comparison matrix is a numerical relationship between two elements that appreciate more important element. In the numerical representation the weight of each factor compared together. Matric n × n (in this case 6 × 6) record the results that also called binary comparison matric Aij= [an × n]. In Analytical Hierarchy Process, all elements of the metric are positive and concerning the “reverse condition” (the weight of j in regard to i will equal to 1/k, if the weight of i in regard to j equals to k). In every binary comparison matric, we will have two numerical quantity of Aij and 1/Aij.
Calculation step for different factors
A comparison matrix as shown in Table 9 has been developed to ascertain the each factors weight. Calculation step includes the following:
| Pair-wise comparison matrix (A1) | ||||||
|---|---|---|---|---|---|---|
| Criteria | BV | CY | Popn | AoP | RW | LU |
| Building Vulnerability by turkish method (BV) | 1 | 7 | 7 | 7 | 7 | 7 |
| Construction Year of building (CY) | 0.143 | 1 | 2 | 4 | 6 | 7 |
| Population per building (Popn) | 0.143 | 0.5 | 1 | 2 | 4 | 5 |
| Area of Parcel (AoP) | 0.143 | 0.25 | 0.5 | 1 | 2 | 3 |
| Road Width (RW) | 0.143 | 0.167 | 0.25 | 0.5 | 1 | 2 |
| Land Use (LU) | 0.143 | 0.143 | 0.2 | 0.333 | 0.5 | 1 |
| Sum | 1.71471 | 9.06 | 10.95 | 14.833 | 20.5 | 25 |
Table 9: Pair-wise comparison matrix of six vulnerability factors.
Step 1: Computation of Weighted Sum Vector (WSV) Table 8.
Step 2: Calculating the Inconsistency Vector (IV) Table 10.
| Normalized pair-wise comparison matrix | A2 | A3=∑A1 × A2 | A3 ÷ A2 | ||||||
|---|---|---|---|---|---|---|---|---|---|
| Criteria | BV | CY | Popn | AoP | RW | LU | Criteria weight | ||
| BV | 0.583 | 0.773 | 0.639 | 0.472 | 0.342 | 0.28 | 0.515 | 3.912 | 7.599 |
| CY | 0.083 | 0.11 | 0.183 | 0.27 | 0.293 | 0.28 | 0.203 | 1.35 | 6.645 |
| Popn | 0.083 | 0.055 | 0.091 | 0.135 | 0.195 | 0.2 | 0.127 | 0.81 | 6.401 |
| AoP | 0.083 | 0.028 | 0.046 | 0.067 | 0.098 | 0.12 | 0.074 | 0.459 | 6.238 |
| RW | 0.083 | 0.018 | 0.023 | 0.034 | 0.049 | 0.08 | 0.048 | 0.292 | 6.1 |
| LU | 0.083 | 0.016 | 0.018 | 0.022 | 0.024 | 0.04 | 0.034 | 0.21 | 6.181 |
| Average | 6.527 | ||||||||
Table 10: Average significance through criteria weight calculation.
Step 3: Attaining λmax as shown in Table 10.
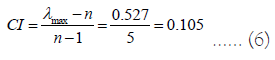
Step 4: Calculation of inconsistency index: Identified by equation (6).
Step 5: Calculating the inconsistency ratio (CR)
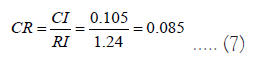
Step 6: Calculation of Inconsistency Ratio (CR): Defined by equation (7).
Here,
CI=Consistency Index,
RI=Random Consistency Index,
n=Number of attributes,
And λma=Weighted Matrix
RI is derived from the Table 5.
In our result the CR is estimated 0.085 which means there is a consent in result because we know that if CR is greater than 0.1 then the result should be reassessed and if CR ≤ 0.1 then it should be agreement in the result.
Overall vulnerability evaluation
The weights for the criteria are computed to evaluate the overall vulnerability using AHP method and afterwards vulnerability map of Lalmatia is prepared based on vulnerability level.
At the stage of Turkish method, the range of vulnerability levels is depended on high rise, large, heavy overhang, huge soft story, have close change of pounding effect, short column existence is severe and apparent building quality is bad. Table 11 represents high vulnerable buildings score by Turkish method.
| Uniq_id | No. of stories | Building type | Soft story | Heavy overhang | Apparent building quality | Short column | Pounding possibility | Building use | Vulnerability score by Turkish method |
|---|---|---|---|---|---|---|---|---|---|
| 761 | 6 | 1 | 1 | 1 | 2 | 2 | 1 | 1 | 0.19 |
| 1571 | 6 | 1 | 1 | 1 | 2 | 2 | 1 | 1 | 0.2 |
| 1406 | 10 | 1 | 1 | 1 | 2 | 2 | 1 | 1 | 0.2 |
| 1532 | 6 | 1 | 1 | 1 | 2 | 2 | 1 | 1 | 0.19 |
| 970 | 5 | 1 | 1 | 1 | 3 | 2 | 2 | 3 | 0.18 |
Table 11: Vulnerability score of very high vulnerable building by Turkish method.
Using Turkish method (total buildings 316) 21 buildings are high vulnerable, 5 buildings are very high vulnerable, 45 buildings are moderate vulnerable, 157 buildings are very low vulnerable, 88 buildings are low vulnerable found in the study area. Result of building vulnerability assessment (very high, high, moderate, low, and very low) by Turkish Method of the study area is shown Figure 15.

Figure 15: Vulnerability assessment map by Turkish method. Note: Vulnerability ranking: 

With the value of Turkish method, at the time of AHP model the range of vulnerability levels is depended on huge population, very high construction age, narrow road and building use is residential. AHP considers all multiple aspects that can affect any building vulnerability and weighted with seismic buildings related factors and present the vulnerability category as shown in Table 12.
| Uniq_id | No of stories | Vulnerability score by Turkish method | CY | Popn | AoP | RW | LU | Score |
|---|---|---|---|---|---|---|---|---|
| 761 | 6 | 0.19 | 1990 | 55 | 46.87 | 22 | R | 42 |
| 1571 | 6 | 0.20 | 1998 | 52 | 322.13 | 22 | R | 36 |
| 1406 | 10 | 0.20 | 1990 | 76 | 118.97 | 22 | R | 42 |
| 1532 | 6 | 0.19 | 1990 | 54 | 283.68 | 26 | R | 40 |
| 970 | 5 | 0.18 | 1990 | 37 | 106.43 | 22 | R | 38 |
Table 12: Vulnerability score of very high vulnerable building by AHP method.
According to AHP method, by giving a priority on very high vulnerable and high vulnerable building (Turkish method) represents the three priority ranking. In case of very high vulnerable buildings (total buildings 5), 2 buildings get first priority, 1 get second priority and 2 gets third priority. In case of high vulnerable building (total buildings 21), 13 buildings get first priority, 5 gets second and 3 gets third priority. This priority list represents priority-based retrofitting. Figures 16A and 16B represents the priority list of high vulnerable buildings.

Figure 16: Priority of (A): Very high; (B): High vulnerable building (AHP method).
AHP method is used only for very high vulnerable building and a high vulnerable building in Lalmatia area. Figure 17A represents the very high vulnerable building priority and Figure 17B represent the high vulnerable building priority. It was concluded that (based on AHP results) 5 buildings of very high vulnerable get more priority for retrofitting. And then 21 buildings get priority for retrofitting.

Figure 17: Vulnerability assessment (A): Very high vulnerable and; (B): High vulnerable. Note: 


Earthquakes is the tremendous threat for the economy, and well-being of the cities, and communities. Thousands of buildings may collapse because of strong earthquake. These strong earthquakes create serious loss of a city that imposed to urban elements. Unplanned urbanization, rapid population growth and density, weak building structure, etc. will produce an uncontrolled condition in most urban areas of the cities, and countries. Other impacts created by the destructive earthquake such as a loss of infrastructure, livelihoods may lead the country to exaggerated misery for a long time. Due to scarcity of digital technology and data, risk zoning map have not been prepared yet for Dhaka city against earthquake stress. The proper analysis of the vulnerable element against earthquake helps to identify risk level of damage. The present study, AHP method has been applied for weighting major building components and the results are also drawn up using GIS with several factors to stimulate earthquakes. Retrofit is one of the important techniques to reduce damage against earthquake hazard. But in the study more people can’t be interested as because lacking of information and financial support. The concept of social retrofitting helps to communities and individuals to allow them to recover and react against earthquake hazards. This research will support in planning and development of community as well as developers to exercised reconstruction techniques that was not properly exercised yet. The model that applying in this study will expressly contribute in the vulnerability appraisement and also helps to take mitigation attempts of Dhaka city against earthquake.
[Crossref]
Citation: Shawon TA, Rahman MM, Mahmud A, Ahmmed MZ, Sharmin S (2024) Earthquake Vulnerability Mapping Using Binary Comparison Matrix and Analytical Hierarchical Process (AHP) In Lalmatia, Dhaka. J Geogr Nat Disasters. 14: 295.
Received: 17-Jan-2024, Manuscript No. JGND-24-29209; Editor assigned: 22-Jan-2024, Pre QC No. JGND-24-29209 (PQ); Reviewed: 06-Feb-2024, QC No. JGND-24-29209; Revised: 13-Feb-2024, Manuscript No. JGND-24-29209 (R); Published: 20-Feb-2024 , DOI: 10.35841/2167-0587.24.14.295
Copyright: © 2024 Shawon TA, et al. This is an open-access article distributed under the terms of the Creative Commons Attribution License, which permits unrestricted use, distribution, and reproduction in any medium, provided the original author and source are credited.