Fisheries and Aquaculture Journal
Open Access
ISSN: 2150-3508
ISSN: 2150-3508
Research Article - (2013) Volume 4, Issue 1
A new approach to post larval shrimp (PLS) collection using a locally designed PLS trawler has been successfully tried in the Volta Estuary of Ghana for 3 years (2000, 2002 and 2005). The PLS trawler had 4 major components: the pulley system, the post larvae (PL) collector, the control room and a work space. The PL collector had an aperture area of 0.433 m2 and a volume of 0.389 m3. Trawling for PLS was made at designated water depths at trawl speed of approximately 0.25 knots (0.128 m/s). Each trawl session lasted for 10 min and was replicated. The distance traversed by the PL collector in a trawl session was estimated at 77.07 m and covered a swept area of 33.40 m2. The associated volume of water filtered through the PL collector was 33.38 m³. The average number of PLS collected per trawl session ranged from 682 6 604 to 758 6 761 at high tide and from 324 6 273 to 414 6 248 at low tide. The ‘other larvae’ (OL) (by-catch discards) collected in the PL collector comprised of the larvacean, Oikopleura spp.; the chaetognatha, Parasagitta (Sagittidae) spp.; crab larvae and fish larvae. Mean OL numbers collected for each trawl session ranged from 295 6 188 to 349 6 292 at high tide and from 257 6 164 to 396 6 261 at low tide. Total PLS collected over 36 trawl months spread over a period of 3 years was 39,549. The corresponding OL numbers was estimated at 21,543. The OL (by-catch discards) to PLS ratio per trawl session was thus estimated at 54.47%. The comparatively low catches of the OL was attributed to the combined effect of the filtering
efficiency of the 500 μ mesh PL collector net, the ability of the PL trawler to sample at variable water depths and the relatively shorter time of 10 min used in a trawl session. This method of PLS collection would provide a viable and reliable alternative to the marine resources (by-catch) destruction which accompanies wild PLS harvest and also ensure biodiversity preservation in the Ghanaian coastal region. The mode of operation of the PL trawler and its operational efficiency is presented and discussed.
Keywords: Post larval shrimps (PLS), PL trawler, knots, trawl session, by-catch discards, other larvae (OL).
The blue revolution which was ushered during the 1970s (akin to the green revolution of the FAO in the 1960s) has taken its full toll on environmental degradation and received appropriate criticisms from environmentalists and biodiversity advocates [1]. It is estimated that between 65% and 75% of all post larval shrimps (PLS) required world wide to stock the 1.5–2.0 million ha of shrimp ponds come from hatcheries. The 35%–25% deficit in the post larvae (PL) supply is provided by about 1 million people world wide, earning them approximately $400 million [2].
In a developing country like Ghana, an emerging shrimp culture industry cannot hope to depend on sophisticated and expensive hatcheries as sources of PLS for shrimp farms that are likely to range only between 0.1 and 1.0 ha in sizes [3]. PLS will thus be collected by coastal fishers as it is done in the shrimp producing countries like Ecuador, Thailand and Indonesia among others and with its attendant difficulties. The case of PL collectors will be worsened because of the generally high energy beaches of the Ghanaian coast [4].
Many shrimp producing countries in South America and in Asia have relied very heavily on wild PL supply as the major source of seed for their grow-out ponds. According to [5], this supply outlet is still significant in those areas despite the introduction of hatchery produced PL in many farms. The practice of collecting wild PLS provide huge employment opportunities for many people, although it also brings about a depletion of marine resources as mortality levels of both shrimp PL and other non-target marine larvae are often very high [6]. A trade off between supporting a vibrant local shrimp industry and keeping wastage of very low non-target marine larvae would be offered by the PL trawler.
The PL shrimp trawler
The PL shrimp trawler comprise of 32-piece plank boat built from well-seasoned local light wood Clyploclyton excelsa (known locally as wawa). The boat carries a pulley system, a collector system, a work space and a control room where all activities on the boat are controlled. The major sections and external characteristics of the PL shrimp trawler are presented below.
The pulley system
The pulley system comprise of a 5 m long, 3 cm diameter steel pipe mast fixed to the base of the boat, two sets of pulleys, a mechanical winder and a pair of 20 m long, 10 mm diameter steel tow lines. The mast carries one set of pulleys located 4.5 m above the base of the boat (mast pulley). A second set of pulleys is fixed on the deck (deck pulley) to carry the tow lines via the mast pulley. The mechanical winder works the tow lines that are hooked onto a pair of triangular metal frames of the PL collector system (Figure 1).
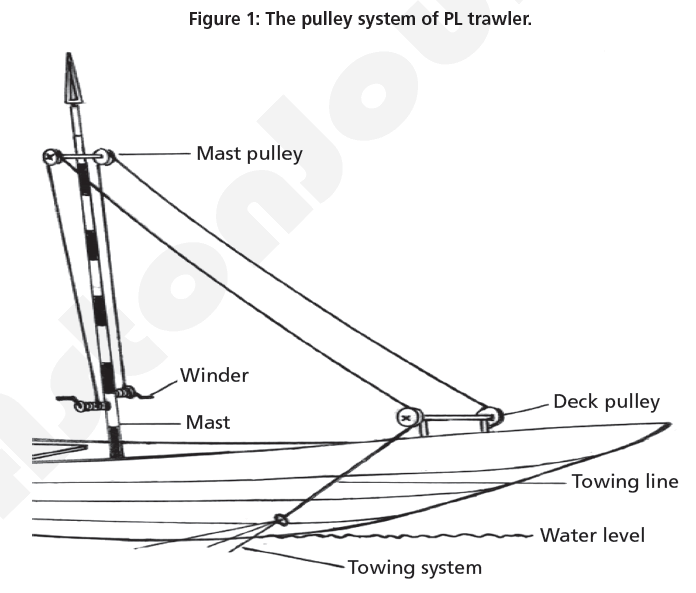
Figure 1: The pulley system of PL trawler.
The PL collector system
The PL collector system comprise of two 3 m long, 500 μ nylon net (Ecuadoran net) securely hemmed onto a set of triangular 5 cm diameter steel pipe frame. The collector net is hemmed onto a 500 mm diameter collection bottle at its tapered end to receive the retained larvae. Each arm of the frame measures 1 m long and carries three rings at the three joints of the frame. Three 1.5 m steel lines originate from the respective rings on the metal frame and are centrally knotted to hook onto a 2.5 cm diameter metal ring connected to the main tow line from the deck pulley. The length of the tow line is regulated by the mechanical winder via the mast and deck pulleys (Figure 2).
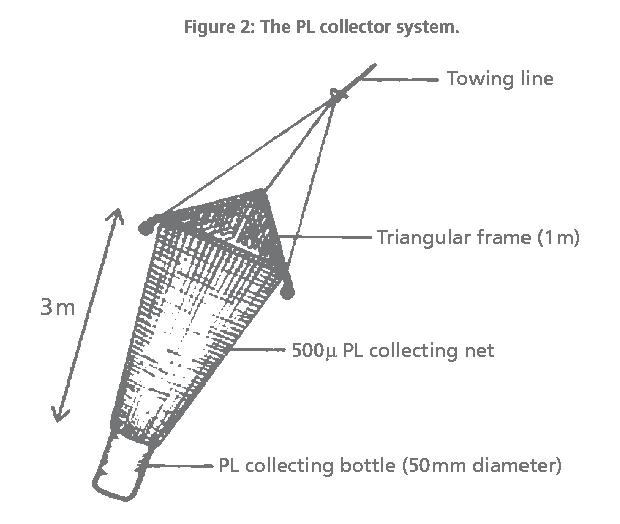
Figure 2: The PL collector system.
The control room and work space
The control room houses one 40-HP out-board engine remotely controlled through metal cables, gears and a steering wheel to regulate towing speed, tow depth and provide appropriate steering routes. The room is fully wired to an on-board one HP electrical generator to provide illumination in the night and to power on-board water pumps for aerating sample water tanks. Three 20 L plastic containers with sand filters are located on the roof of the control room and connect two sets of 15 mm diameter polymerised polyvinyl chloride (PVC) pipe lines to carry saline water and freshwater supplies for work on the PL trawler.
The work space adjoins the control room and carries a working table, a set of working benches, electrical system, brackish water and freshwater pipe lines connected to 1 m3 (1000 L) capacity glass tanks (Figure 3).
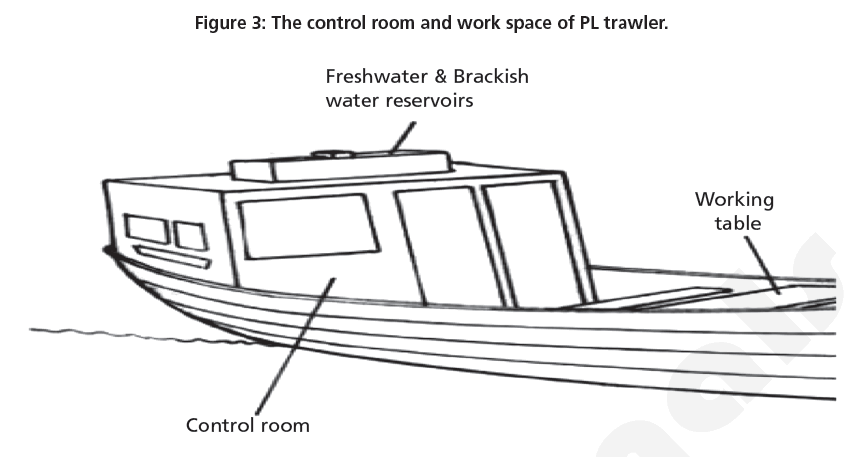
Figure 3: The control room and work space of PL trawler.
Mode of operation of PL trawler
At the designated sampling location, the two PL collectors located at both sides of the boat were deployed to selected water depths that ranged between 3 and 5 m and towed against the current for 10 min. The tow speed was regulated at 0.25 knots (0.125 m/s). The PL trawler covered a distance of 77.04 m and swept an area of 33.4 m2 per trawl session. Approximately 33.38 m³ of water was filtered through each PL collector for each trawl session. Trawling was repeated at the ebb tide.
At the end of a trawl session, the PL collectors were hauled using the mechanical winder worked over the set of mast and deck pulleys (Figure 4). The content of the collection bottle was washed into wide-mouth sorting containers using water from the reservoirs tanks. Sorting for PLS was done under intense lighting, using a flat hand-held 250 μm scoop net. PLS were transferred into ice-cooled water at 228C in the 1000 L tanks for pre-conditioning ahead of full acclimatization in hatchery tanks. All other larvae (OL) were retained for identification and enumeration in the field laboratory. Each trawl session was replicated and average numbers computed.
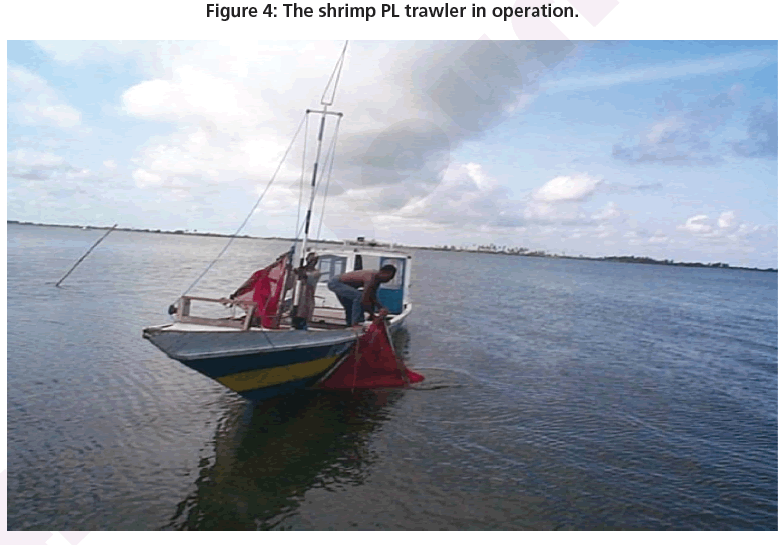
Figure 4: The shrimp PL trawler in operation.
Statistical analysis
Descriptive statistics
Descriptive statistics of simple means and standard deviation was computed for the data on the PLS and the OL. Ratios of the OL to PLS were computed for each trawl session.
The moving average forecast was applied to data generated to provide a good estimate of the mean in the frequently changing OL/PLS ratios for the 36 months study period.
Study area
Zone B (trawl locations)
The general sampling area (B) is bounded by sampling points 1, 2, 5 and 6. It covers an area of 84.375 km2 extending from the mouth of the Volta River (latitude 5º30′) to approximately 20 km upstream of the river estuary at latitude 5850′ and along longitudes 0º25′ – 0º43′. This area encompasses over 30 Islands within the main river channel. It has a maximum breadth of 4000 m with a mean water depth of 7 m and a tidal displacement of 2.1 m at spring tide. PL trawl took place within the sampling area A (bounded by sampling points 2, 3 and 4). This area is, located within the general sampling area at the confluence of two creeks at approximately 8 km from the river mouth. The width of the river at the trawl area ranges from 2000 to 3500 m. It is characterized by mass movement of water at both flood and ebbing tides. During periods of spring tides, the entire water body is stratified but the surface column is occupied by a relatively thin freshwater layer of about 2 m (Figure 5).
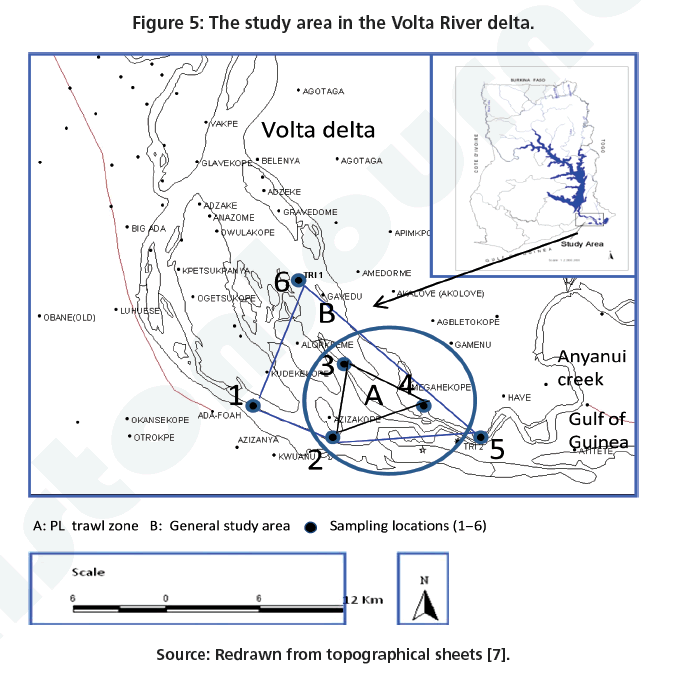
Figure 5: The study area in the Volta River delta.
Variations in PLS numbers in PL trawler survey
Variations in number of PLS and OL forms collected from the PL trawler for 2005, 2002 and 2000 are presented in Table 1. The number of OL (by-catch) comprising largely of the larvacean; Oikopleura spp., the chaetognatha; Parasagitta (Sagittidae) spp., crab larvae and fish larvae are presented in Table 2. The OL (by-catch)–PLS ratio is computed and presented in Table 3.
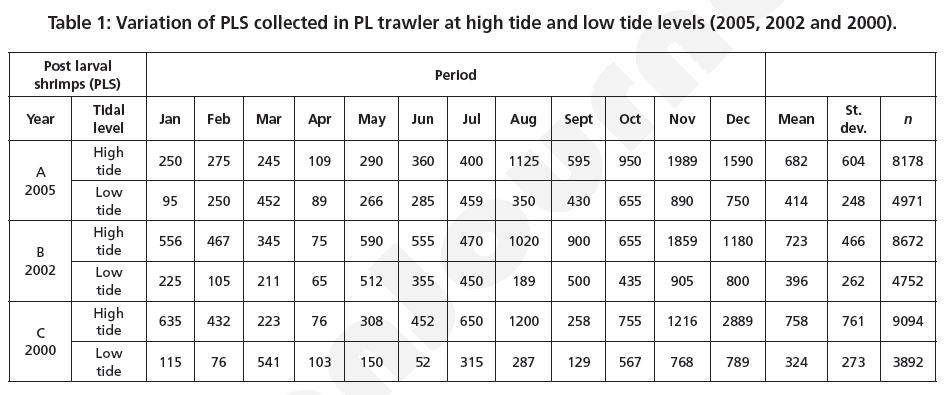
Table 1: Variation of PLS collected in PL trawler at high tide and low tide levels (2005, 2002 and 2000).
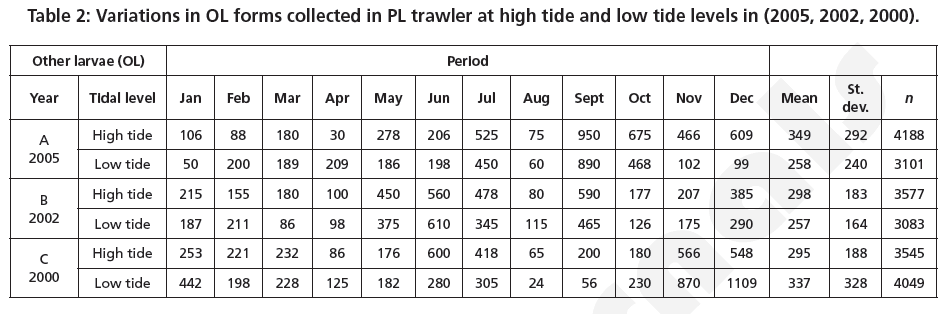
Table 2: Variations in OL forms collected in PL trawler at high tide and low tide levels in (2005, 2002, 2000).
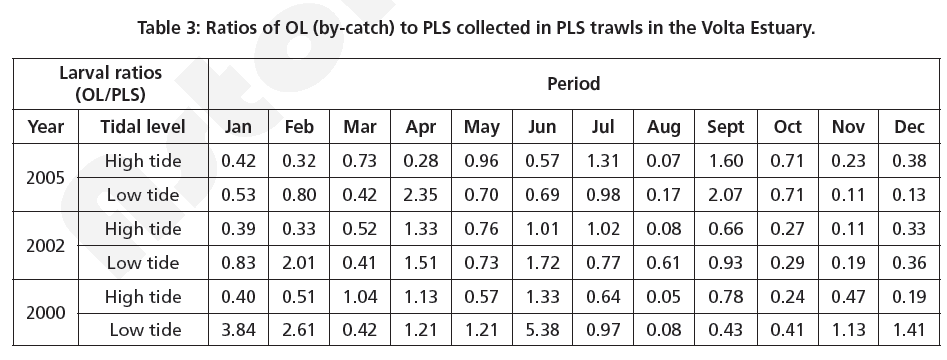
Table 3: Ratios of OL (by-catch) to PLS collected in PLS trawls in the Volta Estuary.
In 2005, monthly catches of PLS ranged from 109 in April to 1989 in November and averaged at 682 6 604 (n 5 8178) in the year for high tide trawl sessions. The corresponding low tide numbers ranged from 89 in April to 890 in November and averaged at 414 6 248 (n 5 4971). High tide numbers were recorded in the last quarter of that year (October–December) for low tide and in August, November and December for high tide. Number of PLS harvested were low from January to June for both tidal levels with the exception of low tide catches in March (Table 1A).
In 2002, high tide PLS collections were highest at 1859 per trawl session in November and the lowest at 75 in April. The low tide values were highest at 905 in November and lowest at 65 in April. Mean high tide trawl shrimp larvae was recorded at 723 6 466 (n 5 8672). The corresponding low tide value was 396 6 262 (n 5 4752) (Table 1B).
In 2000, high tide PLS collections were highest at 2889 per trawl session in December and the lowest at 76 in April. The low tide values were highest at 789 in December and lowest at 52 in June. Mean high tide value was 758 6 761 (n 5 9094). The corresponding low tide value was 324 6 273 (n 5 3892) (Table 1C).
Variations in population of OL (by-catch) in PL trawler survey
In 2005, the number of OL accidently collected with PLS per trawl session ranged from 30 to 950 in April and September for high tide and 50 to 890 in January and September respectively for the low tide. The mean values for high tide was 349 6 292 (n 5 4188) and that of low tide was 258 6 240 (n 5 3101). Comparatively high numbers were collected at high tide in the months of September, October and December at 950, 675 and 609 respectively. The low numbers collected at high tide were in the months of February, April and August at 88, 30 and 75. Higher numbers for the low tide trawls were in July, September and October at 450, 890 and 468 respectively. The corresponding low numbers occurred in the months of January, August and December at 50, 60 and 99 (Table 2A).
In 2002, the highest high tide population density was in September at 590 and the lowest was in August at 80. The corresponding low tide values were in June and March at 610 and 86. The mean values for high tide was 298 6 183 (n 5 3577) and that of low tide was 257 6 164 (n 5 3083). Comparatively the high numbers for high tide were in June, July and September at 560, 478 and 590. The low numbers were in April and August at 100 and 80. For low tide, high numbers were in May, June and September at 375, 610 and 465. The low numbers were in March and April at 86 and 98 respectively (Table 2B).
In 2000, the highest high tide population density was in June at 600 and the lowest was in August at 65. The corresponding low tide values were in December and August at 1109 and 24. The mean values for high tide was 295 6 188 (n 5 3545) and that of low tide was 337 6 328 (n 5 4049). Comparatively the high numbers for high tide were in June, November and December at 600, 566 and 548 respectively. The low numbers were in April and August at 86 and 65. For low tide, high numbers were in November and December at 870 and 1109. The low numbers were in August and September at 24 and 56 respectively (Table 2C).
Comparison of OL (by-catch) and shrimp PL densities
Ratios of the OL to PLS (OL/PLS) were computed for the 3 years. In 2005, highest OL/PLS ratios were at 1.60:1.00 in September for the high tide and 2.35:1.00 in April for low tide. The lowest ratios for high tide were in August at 0.07:1.00 and 0.11:1.00 in November for low tide.
In 2002, the highest OL/PLS ratio was in April at 1.33:1.00 for the high tide trawls and 2.01:1.00 in February for the low tide trawls. The respective lowest ratios were 0.08:1.00 in August and 0.19:1.00 in November.
In 2000, OL/PLS ratio for high tide was highest in June at 1.33:1.00 and lowest in August at 0.05:1.00. The corresponding low tide values were 5.38:1.00 in June and 0.08:1.00 in August (Table 3).
Statistical analysis
Descriptive statistics
A total of 36 trawl sessions (spread over a period of 3 years) yielded a total 39,549 shrimp PLS. The corresponding number of the OL by-catch was 21,543 or 54.47% of the shrimp larvae collected. A projected 365 days PLS collection would yield approximately 400,983 PLS and an estimated 218,422 other larval forms based on the 3 years mean OL–PL ratio of 54.47%.
Moving averages on OL–PLS ratios
Moving average projections for the OL–PLS ratios were largely moderate at values ranging between 50% and 75% throughout the study period.
In 2005, the OL–PLS ratios had high percentages recorded in April, July and September at 125%, 110% and 180% respectively. All the remaining months recorded ratios between 10% and 80%. The moving averages predicted ratios of over 100% in only October and with ratios below 50% for 2 months, November and December. The predicted ratios for the remaining months of the year all fell within the range of 50%–100% (Figure 6).
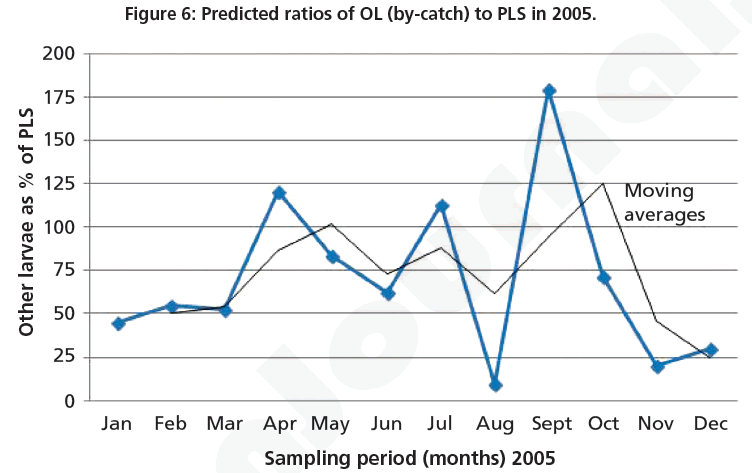
Figure 6: Predicted ratios of OL (by-catch) to PLS in 2005.
In 2002, ratios of the numbers of the OL to the PLS were over 100% in April and July. The moving averages however predict 3 months (May, June and July) of higher OL–PLS population ratios at more than 100%. The remaining 8 months had predicted OL–PLS ratios below 50% (Figure 7).
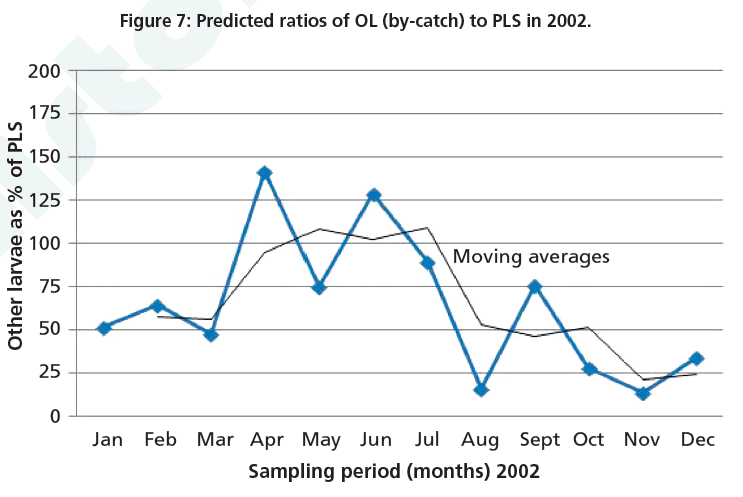
Figure 7: Predicted ratios of OL (by-catch) to PLS in 2002.
In the year 2000, ratios of OL forms to the PLS ranged from 7% to 131% and with 10 months of recording falling below 100%. The moving averages also predicted 10 months of OL–PLS ratio below 100%, June was the only month in 2000 where predicted OL–PLS ratio recorded was above 100% (Figure 8).
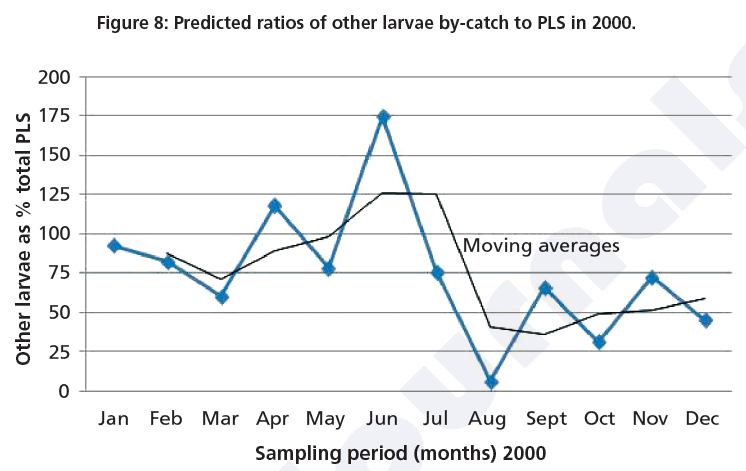
Figure 8: Predicted ratios of other larvae by-catch to PLS in 2000.
Traditionally, shrimp farming had been based on use of shrimp fry collected from the wild for stocking in grow-out ponds. With increasing demand for shrimps, supply of wild fry for the increasing number of shrimp farms had become insufficient and inconsistent. The breakthrough in the completion of the life cycle in captivity of commercially important shrimps such as the black tiger shrimp (Penaeus monodon), the Japanese kurumaebi (Penaeus japonicus), the eastern shrimp (Penaeus chinensis (orientalis)), the white shrimp, (Penaeus vannamei) and the banana shrimp of India (Penaeus indicus), had greatly enhanced mass production of shrimp fry under hatchery conditions [8]. The hatchery produced PLS however appear inadequate in an ever expanding shrimp culture industry, thereby making room for wild-shrimp collectors to fill in the short falls. This is commonest in the shrimp aquaculture producing countries in South and Central America and large area in Asia [5].
In a World Bank sponsored study on shrimp seed collection, it was estimated that over 1 million people are involved in wild shrimp larvae collection throughout the world [9]. While wild shrimp collection may be contributing to poverty reduction in the impoverished shrimp-producing communities of the world by providing jobs for the unemployed, one important factor that is often overlooked is the destruction of biodiversity resulting from discards of non-target marine larvae [6]. Frequently, there is also a problem with destabilization of the Estuarine salinity gradient resulting from excessive dilution which prevents the establishment of typical fish, shellfish and other communities thus affecting the genetic mix of biota and consequently, the biodiversity [10,11]. Not withstanding, in the face of high unemployment rate in many coastal developing countries, the business of wild shrimp collection must go on.
The Ghanaian situation may be further complicated by the largely high energy rocky beaches and highly erosive coast [12] which will make wild shrimp collection very difficult. In an environment where shrimp farming does not exist, it is important that the necessary structures are put in place to allow for a smooth take off of the industry. The PL trawler is designed to solve the combined problems of importation of exotic shrimp larvae that will result from inaccessibility of indigenous PL seed (thereby preserving biodiversity) and substantially reducing wastage of marine larvae through unwanted by-catch discards.
According to [13] about 3.3 billion wild shrimp larvae collected in 1 year for on-land culture elicited a corresponding marine larvae by-catch of 15–20 billion—a figure that represents approximately 530% of other marine larvae wasted through by-catch discards. This ranks the PL trawler’s OL (by-catch discards)–PLS ratios of 54.7% as an efficient and biodiversity friendly equipment. Also, the projections of moving averages for the OL–PLS ratios falling largely between 50% and 75% is indicative of efficiency of the harvesting equipment in isolating non-target larvae from the PLS. Furthermore, the operational system of the shrimp larvae collection on the PL trawler allows for the return of large numbers of the OL back into the water as soon as the PLS are separated using an enhanced lighting system.
Freshwater discharges into higher salinity estuarine waters are known to increase stratification due to density differences [14]. According to work done by [15] in the Urban University, PLS must be at least PL15 to be able to tolerate low salinity acclimatization. This study thus assumed that the shrimp larvae would, as much as possible, strive to avoid the less saline surface waters at ebbing tides. The PL trawler speed was thus so regulated to operate in more saline waters during ebb tide in order to maximize PL harvests. The fact that there were mostly lower numbers in catches at low tide confirms the observation of a possible freshwater avoidance mechanism employ by the PLS to ensure survival in the less saline waters of the Estuary. Saline water carried on the PLS trawler facilitated mixing of water to preferred salinity levels for the PLS and reduced mortality losses.
The results of the current study provide a good basis for policy-makers to begin to think about how to regulate an emerging shrimp industry that would otherwise resort to importing exotic PLS and shrimp brood stock into such an ecologically balanced ecosystem as the Volta Estuary.
It is anticipated that when the economics of running the PLS trawler is fully established, the three major drivers of successful shrimp farming: economic feasibility, reliability of quality and adequate shrimp seed supply and preservation of biodiversity would be met to make the future shrimp culture development take off in a more scientific and cost effective manner.
Shrimp culture development in any part of the world, will have to rely on locally harvested wild PLS in the absence of sophisticated hatcheries, as it happened in South and Central America as well as in South East Asia. Ghana will not be an exception.
The generally high energy beaches and coastal areas of most parts of the West Africa coastline, including Ghana, would not easily lend support to wild PLS collection; thus making importation of exotic shrimp larvae into the new environment a lucrative business. The consequent potential marine larvae destruction and biodiversity loss can be minimized or avoided altogether with the use of the PL trawler.
The PL trawler provides a more viable alternative to manual local wild shrimp post larvae collection in the high-energy beaches and coastal areas.
The mode of operation of the PL trawler during PLS collection ensures a marked reduction in OL (bycatch discards) thereby contributing to preservation of biodiversity while supporting a viable shrimp industry.
It can be reasonably assumed that when the shrimp aquaculture industry has taken off, the local artisanal fishermen who spend 6 months in a year idling at home during the lean fishing season would find PLS seed collection a viable alternative business, thus contributing to creating an all-year round job for the people while alleviating poverty and helping to contribute to biodiversity preservation in the Estuaries and the Seas.
Regulation of the industry right from the start is highly recommended if the errors encountered in the shrimp aquaculture producing countries of Latin America and South East Asia are to be avoided.
The author declares that he has no competing interests.
The author acknowledges the support of the field assistant, Mr. Korletey Aggrey of Azizakpe near, Ada, S.E. Ghana, for his contribution towards the building of the PL trawler and being its captain throughout the study period. The Volta Basin Research Project of the University of Ghana, where the author worked, is also greatly acknowledged for providing some partial logistical support and permitting the use of sampling gears for the work.