Fisheries and Aquaculture Journal
Open Access
ISSN: 2150-3508
ISSN: 2150-3508
Research Article - (2018) Volume 9, Issue 3
Keywords: Ice storage; Rheological properties; Gel strength; C. carpio ; Functional properties
In developing countries like India, fish is still an essential food and one of the best sources of protein. Fish is one of the perishable commodities and public requires continuous reassurance about its quality. Better utilization calls for a good understanding of the composition, spoilage process and stability to different processing conditions. Assurance of both quality and safety of the food will be the major challenge faced by a human being in recent times. The demand for processed fishery products is rising as the standard of life changing especially with the urban population. The contemporary consumer is increasingly asking food products of convenience, balanced calorie and nutrients, safe and more wholesome like gel based comminuted products.
The proteins of fish especially myofibrillar proteins exhibit desired functional properties. The gel-forming ability is an essential functional attribute of big interest in fish processing technology imparting the textural properties. Gels can vary markedly in their textural properties depending on the source and process adopted. The use of fish species for the preparation of gelled products like fish sausage is done for better understanding of the properties of proteins. Among different proteins, myofibrillar proteins (myosin and actomyosin) mainly contribute to physicochemical, functional and rheological properties which ultimately determine the eating quality. Gelation is one of the most important functional properties that influence the textural properties of fish products. Formation of gel involves partial denaturation of protein with irreversible ordered aggregation leading to a three-dimensional network [1]. Heat-induced protein gelation has been studied exclusively to understand gelation mechanism and food texture. The components and ingredients in food and the processing conditions they undergo determine the textural properties of any food product. The instrumental testing of texture is required to consistently correlate with the texture which in turn can determine the acceptability of the product and influence quality control.
To improve the utilization and consumption of freshwater fish products, there is a need to understand the changes occurring in muscle components during ice storage. In this context, the effect of ice storage of carps on the suitability for preparation of mince based products like fish sausage is expected to provide valuable information. The primary requirement for preparation of these products is the gel forming ability of the mince. Hence, objectives of the present investigation are to assess changes in the textural, physicochemical and rheological properties of common carp during ice storage and to evaluate its suitability for the preparation of gel products by gel forming ability.
Material
Fresh common carp (C. carpio ) has been used in this study. Fish were collected from the farmer at Mangalore city, in India from a freshwater. Fish has been conserved in ice and transported to the laboratory in an iced condition in a poly-urethane box. The average length and weight of these fishes were between 18 g to 26.3 g and 860 g to 1080 g respectively. The fish has been iced in the ratio of 1:1 (fish:ice). The fish and ice were packed in an alternative layer in the box and transported to the laboratory. The ice has been replaced once in 24 h after draining the melted water. The total period of ice storage has been 15 days.
The samples have been used for analysis at (0, 3, 6, 9, 12 and 15) days of ice storage. The fish has been removed from the thermocouple box and cleaned. Cleaning has been done with a clean knife. The scales were removed, and fishes have been washed in clean water. The meat has been separated manually from bones and the separated meat has been macerated using pestle and mortar in an ice bath and used for analysis.
Analysis of the proximate composition
The moisture content has been determined according to the method described by AOAC [2]. The crude protein content of the meat has been determined by estimating its total nitrogen content using the Kjeldahl method [2]. The nitrogen obtained has been multiplied by a factor of 6.25 for the determination of the total protein content. Lipid content has been determined by the Soxhlet extraction method. Ash content has been determined as described by AOAC [2].
Determination of total amino acid by HPLC
The separation and quantification of the amino acid component were carried out using an HPLC with an ion exchange column; model Hitachi L-2130 Elite La Chrom. This equipment has been equipped with auto sample L-2200 and FL detector L-2485. About 100 mg of finely homogenized fish mince was weighed in a Pyrex test tube. Ten mL of 6N HCl has been added to the test tube. The Pyrex tube has been sealed after filling nitrogen and the digestion (protein hydrolysis) of the tube content has been done by keeping it at 110°C for 24 hours in an oven. At the end of the hydrolysis step, the test tube has been cooled, and the content has been filtered using Whatman No one filter paper. The filtrate has been evaporated in a vacuum flash evaporator. 50 mL of deionized water is added to the test tubes during the evaporation until the content is acid free (04 washing). The amino acid has been dissolved in buffer A (prepared using sodium citrate and citric acid, NaCl and 4 mL Brij; and the pH has been adjusted to 3.5) and injected into the HPLC system. The eluted amino acids are derivatized post column with O-phtaladehyde for fluorescence detector).
Spectrophotometric determination of tryptophan
The tryptophan content in protein has been determined according to the methods described by Sastry et al. [3]. 300 mg of finely homogenized fish mince has been introduced into a test tube. 10 mL of 5% NaOH has been introduced. After filling it with nitrogen gas, the content has been digested in an air oven at 110°C for 24 hours. After the hydrolysis, content has been neutralized to pH 7 using 6N HCl. Total volume has been made to 100 mL and filter through Whatman No 1 filter paper. After this preparation step, 0.1 mL of 2.5% sucrose and 0.1 mL thioglycolic acid successively were add in the test tube containing 4 mL of 50% H2SO4 keep in the water bach at 45°C to 50°C for 5 min and cool. 0.5 mL sample has been added to the test tube and mixed. The intensity of the color has been evaluated at 500 nm.
Determination of fatty acid profile
The fatty acid profile has been determined by Gas chromatograph as describe by AOAC [4]. Preparation of fatty acid methyl ester (Direct method): 5 mL of 0.5N Methanolic NaOH (1 g NaOH in 50 mL methanol) has been added to 100 mg of fish oil. Reflux for 5 min in a boiling water bath under N2.6 mL of BF3- Methanol (Boron Trifluoride Methanol) has been added to the flask and reflux for five more minutes. Flask has been cooled and 6 mL saturated NaCl has been added and transfer in the separating funnel. The upper layer has been washed thrice with petroleum ether and filter through Na2SO4. Evaporate the extract and make up to 1 mL in petroleum Ester for gas chromatographic analysis.
Gas chromatographic analysis: The analysis of the fatty acid methyl esters has been carried out using a gas chromatograph analysis. The GC has been programmed such as Injector was at 265°C and the FID (Flame Ionization Detector at 275°C. The capillary column (Elite -225) (30 m, 0.25 mm id, 0.25 μm, the carrier gas was nitrogen at 0.6 mL/ min; temperature programme 110°C for 4 min, the temperature has been programmed to raise at 2.7°C/min to 240°C and maintained at that temperature for 5 min; Split flow 20 mL. 1 μl of a sample has been injected and identified by the retention time by comparison with standards using Chrome card software, area of each component is obtained from the computer generated data and concentration calculated using the software by the standard external method.
Total Volatile Base Nitrogen (TVBN) and during ice storage: Total volatile base nitrogen (TVBN) content of meat has been determined during ice storage using Conway’s micro diffusion technique [5] and expressed as mg N/100 g meat.
pH: The pH of C. carpio meat sample has been measured using a pH meter (Systronic μ pH 361 pH meter, India). Five grams of meat has been macerated with 45 mL of distilled water and the pH has been measured.
Aerobic Mesophilic Bacteria (AMB): The determination of Aerobic Mesophilic Bacteria (AMB) has been carried out according to the plate count method using spread plate technique and plate count agar. Twenty-five grams of fish portions were aseptically weighed and homogenized with 225 mL sterile 0.85% normal saline for 1 min. The homogenized sample has been serially diluted using 9 mL sterile saline for bacteriological analysis. The TPC values were log transformed to establish correlations with other quality parameters.
Sensorial analysis
Effect of ice storage on the sensorial properties: The sensory analysis of C. carpio was performed during iced storage according to the European Community (EC) grading scheme by panellists [6]. 10 point hedonic scale was used for evaluating the sensory attributes of cooked meat. The following characteristics have been evaluated: appearance, odor, flavor and texture. Appearance of the skin, eyes, gills and internal organs, surface slime of each fish has been assessed into four quality grades excellent quality (perfect condition, E), high quality (slight loss of excellent characteristics, A), good quality (some deterioration but can be used, B) and bad quality (C).
Effect of ice storage on sensorial properties of cooked fish: The sensorial analysis during 15 days ice storage has been performed by an untrained sensory panel composed of laboratory staff and student. While drawing the samples for sensory evaluation, attention has been given to check any change in color or odor. The panel assessed different attributes like appearance, odour, flavor and texture. Each sample was classified using a 10 point hedonic scale, 4 being the acceptability limit.
Calcium activated ATPase activity
Calcium-activated ATPase activity was determined according to the method of Naguchi et al. [7] and expressed as microgram of inorganic phosphorus (Pi)/mg protein/min. About 1 g of meat was macerated into 10 mL 50 mM glycine-NaOH buffer, pH 9.2. The obtained solution was filtered using Whatman N°1 filter paper and used as an enzyme solution. The mixture containing 0.06 mL of ATP solution (0.05 M), 0.4 mL CaCl2 (0.1 M), 2 mL buffer (0.05 M glycine-NaOH, pH 9.2) and 0.4 mL of meat extract was made up to 4.0 mL with buffer and incubated at 27°C during 5 min. The reaction has been stopped by the addition of 2 mL of 15% TCA. The blank was carried out by adding 15% TCA before adding the enzyme. The mixture has been filtered using Whatman N°1 filter paper and the inorganic phosphorus released has been estimated according to the procedure described by Taussky et al. [8].
Dynamic Visco-elastic Behavior (DVB) of fresh fish
Dynamic Visco-elastic Behavior (DVB) of flesh was measured using Controlled Stress Rheometer (AR 1500 ex, New Castle, DE) at a temperature range of 25°C to 90°C under oscillatory mode using 4 cm parallel plate geometry. The DVB was carried out under strain mode which has been fixed at 0.25% strain. The gap between measuring geometry and Peltier plate has been set at 2000 μm and a frequency of applied stress was 1 Hz. About 2.0 g of meat has been macerated with NaCl (2.5% of the mixture) using pestle and mortar maintained at low temperature using crushed ice. The paste has been placed on the Peltier plate. The temperature ramp rate of 1°C/min has been followed. At a regular interval of time, the storage modulus (G’), loss modulus (G”) and tan delta (tan δ) have been registered by the instrument. A plot of temperature against G’, G’’ and tan δ has been obtained for analysis.
The gel obtained after temperature sweep has been subjected to frequency sweep with a frequency range of 0.1 Hz to 10.00 Hz at a constant temperature of 25°C. A plot of frequency against G’, G” and tan δ has been obtained. The slope of curves for G’ and G” were calculated.
Gel strength of fish sausage
Gel strength of sausage has been measured using a Texture Profile Analyzer (TA-XT plus, Stable Micro System, Surrey, England) that has 50 kg of a load cell. The gel strength measurements included the spherical probe of 5 mm diameter with the test speed of 2.00 mm/sec, 10 g of trigger force and 15 mm of distance. Sausage of 30 mm length has been taken and equilibrated to room temperature for 30 min before analysis. Breaking force (g) and breaking distance [deformation (cm)] were determined and gel strength has been calculated in g cm. All the results reported are an average of triplicates.
Texture Profile Analysis (TPA)
TPA has been carried out using Texture profile analyzer (TA-XT plus, Stable micro systems texture analyzer, Surrey, England). The test conditions given were two consecutive cycles of 75% compression during 5 second time interval between cycles using compression probe of 75 mm. This analysis has been carried out at 5 mm/s. Sausage of 30 mm length has been taken and equilibrated to room temperature for 30 min before the test.
The resulting curve has been used to determine the following parameters characterizing the texture: hardness (N), maximum force required to compress the sample; adhesiveness (N). The cohesiveness, the extent to which the sample could be deformed prior to rupture (A2/A1, where A1 was the total energy required for the first compression and A2 the second compression); springiness has been evaluated. The height which food recovers during the time elapsed between the end of the first compression and start of second compression cycle; gumminess (N), the force needed to disintegrate a semisolid sample to a steady state of swallowing (hardness × cohesiveness); chewiness (N), resilience, and measure of elasticity have been also determined. All the results reported are an average of triplicate.
Statistical analysis
Tests have been performed in triplicate and results were expressed as mean ± standard deviations. The proximate chemical composition, TVBN was subjected to the analysis of variance (one-way ANOVA with Post-test) at 0.05% probability level. The Bonferroni tests have been used to ascertain the specific pairs that were significantly different using GraphPad InStat 3 software.
Proximate chemical composition of fish
The proximate composition of C. carpio flesh revealed protein content of 19.80% ± 0.65% and fat content of 1.60% ± 0.12% (Table 1). This result shows that this fish is rich in protein. The results obtained are comparable to the proximate composition of freshwater fishes like Indian Major Carps and common carp [9] with relatively low-fat content. One of the reasons has been attributed to nature of feed provided during aquaculture practices [10]. The freshness as assessed by TVBN revealed a value of 16.4 mg/100 g. The permissible limit of VBN in fish and fishery product is 40 mg/100 g [11].
| Parameters | C. gariepinus | C. carpio |
|---|---|---|
| Moisture content | 80.04 ± 0.04 | 79.89 ± 0.14 |
| Lipid content (%DM) | 7.46 ± 0.13 | 5.46 ± 0.11 |
| Protein content (%DM) | 86.56 ± 3.09 | 87.65 ± 1.54 |
| Ash content (%DM) | 5.92 ± 0.03 | 6.79 ± 0.05 |
| Hydrocarbon content (%DM) | 0.02 ± 0.01 | 0.04 ± 0.14 |
Table 1: Proximate chemical analysis of C. carpio .
Amino acid composition
The amino acid composition has been illustrated in Table 2. From this Table, it appears that this fish contains 17 several amino acids. Glutamic acid, aspartic acid and lysine were found to be the major amino acid. Among the essential amino acids, isoleucine, leucine and arginine are the most represented.
| Amino acid composition | Raw fish (%) |
|---|---|
| ASP | 8.55 ± 0.22 |
| THR | 3.51 ± 0.11 |
| SER | 2.86 ± 0.02 |
| GLU | 13.71 ± 0.25 |
| PRO | 2.89 ± 0.06 |
| GLY | 3.20 ± 0.14 |
| ALA | 4.17 ± 0.11 |
| CYS | 0.68 ± 0.07 |
| VAL | 4.02 ± 0.09 |
| MET | 1.71 ± 0.03 |
| ILEU | 3.52 ± 0.14 |
| LEU | 6.41 ± 0.22 |
| TYR | 3.31 ± 0.07 |
| PHE | 3.51 ± 0.22 |
| HIS | 5.20 ± 0.14 |
| LYS | 10.97 ± 0.45 |
| ARG | 5.11 ± 0.25 |
| TRY | 1.63 ± 0.02 |
Table 2: Amino Acid composition of C. carpio .
Fatty acid composition
The fatty acid composition of C. carpio has been summarized in Table 3. The saturated, monounsaturated, polyunsaturated fatty acids Fatty acid content and ω-3/ω-6 polyunsaturated fatty acids ratio are presented in this Table. In the present investigations, we found that Common carp oil has 29 fatty acids.
| Fatty Acid | Quantity (%) |
|---|---|
| C11 | 0.14 ± 0.01 |
| C12 | 1.10 ± 0.02 |
| C13 | 0.26 ± 0.00 |
| C14 | 18.81 ± 0.03 |
| C14:1 | 0.23 ± 0.04 |
| C15 | 1.04 ± 0.01 |
| C15:1 | 0.27 ± 0.05 |
| C16 | 26.31 ± 0.12 |
| 16:1(n-7) | 6.23 ± 0.12 |
| C17 | 0.70 ± 0.21 |
| C17:1 | 0.25 ± .0.15 |
| C18:0 | 3.54 ± 0.02 |
| 18:1(n-9) | 12.08 ± 0.15 |
| 18:1(n-7) | 1.95 ± 0.12 |
| 18:2(n-6) | 4.91 ± 0.10 |
| 18:3(n-3) | 0.86 ± 0.05 |
| C18:3(n-6) | 2.21 ± 0.03 |
| C20:0 | 0.26 ± 0.05 |
| 20:1(n-9) | 0.78 ± 0.08 |
| C20:2 | 0.53 ± 0.02 |
| 20:4(n-3) | 0.64 ± 0.01 |
| 20:4(n-6) | 1.26 ± 0.01 |
| C21:0 | 0.50 ± 0.01 |
| 20:5(n-3) EPA | 3.23 ± 0.01 |
| C22:0 | 0.30 ± 0.01 |
| C22:2 | 0.29 ± 0.01 |
| 22:5(n-6) | 0.49 ± 0.04 |
| C24 | 4.90 ± 0.05 |
| 22:6(n-3) DHA | 5.90 ± 0.04 |
| Total Saturated Fatty Acid (TSFA) | 57.36% |
| Mono Unsaturated Fatty Acid (MUFA) | 21.79% |
| w-3 PUFA | 10.63% |
| w-6 PUFA | 8.87% |
| PUFA | 19.50% |
| w-3/w-6 | 1.2 |
Table 3: Fatty acid composition of C. carpio .
This fish is mainly composed of saturated fatty acids (SFA: 57.36%) amount which, we can have myristic acid (C14:0), pentadecanoic acid (C15:0), palmitic acid (C16:0), heptadecanoic acid (C17:0), stearic acid (C18:0) and arachidic acid (C20:0). The monounsaturated fatty acid content is higher (21.79%) than the polyunsaturated fatty acids (19.5).
Oleic acid is the most abundant monounsaturated fatty acid in this fish. These results are different when compared to an earlier study on fresh marine fish in Malaysia, where the concentrations of saturated fatty acid were low [12].
Proximate chemical composition change during ice storage
Results of proximate analysis of C. carpio during the 15 day storage have been given in Table 4. Raw common carp has a fat content of (1.60 ± 0.12) g/100 g edible meat, with a protein content of (19.80 ± 0.65) g/100 g and ash content of (0.61 ± 0.23) g/100 g. The fat and ash content was low compared to that reported for trout from other regions [13]. During ice storage, no significant variations in moisture, protein and fat content have been observed. A slight increase of 2.0% moisture content has been observed after 15 days in chilled storage. The retention of a good texture of fish muscle during ice storage can be attributed to the minimum leaching of the major constituents and low water penetration into the flesh.
| Days | Moisture (%) | Protein (%) (ww) | Fat (%) (ww) | Ash (%) (ww) |
|---|---|---|---|---|
| 0 | 78.04 ± 0.31a | 19.80 ± 0.65a | 1.60 ± 0.12a | 0.61 ± 0.23a |
| 3 | 79.06 ± 0.41b | 19.18 ± 0.82a | 1.56 ± 0.05a | 0.66 ± 0.04a |
| 6 | 79.12 ± 0.23c | 19.06 ± 0.56a | 1.54 ± 0.06a | 0.64 ± 0.07a |
| 9 | 79.41 ± 0.32c | 18.48 ± 0.77a | 1.57 ± 0.14a | 0.66 ± 0.04a |
| 12 | 79.73 ± 0.45c | 18.09 ± 0.54a | 1.47 ± 0.09a | 0.65 ± 0.04a |
| 15 | 80.64 ± 0.11d | 17.97 ± 0.28a | 1.42 ± 0.04a | 0.61 ± 0.00a |
Values carrying different letters are significantly (P<0.05) different from control and each other when compare all pairs of columns. The results presented are the means of three values followed by their standard deviation. n=3.
Table 4: Effect of ice storage on the proximate chemical composition of C. carpio .
Effect of ice storage on pH, TVBN and AMB
The initial AMB load of 3.61 log10 CFU/g indicate that the quality of common carp has been good as it ranged from 2 to 6 log10 CFU/g [14]. These values obtained in this study are close to the values reported earlier by Gonzalez [15] during the study base on the aquaculture fresh fish in Spain. It has been widely accepted that the initial microbial load of freshwater varies depending on water conditions and temperature. The initial and final aerobic mesophilic bacterial associations of fish stored in ice were found to be similar to those reported in the literature for fish stored aerobically. In this study, mesophilic counts in fresh fish tissues were close to or lower than the value (5.25 log10 CFU/g) recommended by the International Commission of Microbiological Specification for Foods [16] for whole freshwater fish. Considering this result, the shelf life of chilled stored common carp in this study was 9 days to 12 days as reported earlier by Rezaei et al. [17].
pH values of samples increased with storage time from an initial value of 6.75 (Table 1) indicating bacterial growth and production of volatile basic compounds such as ammonia by fish spoilage bacteria. Increase in pH due to the accumulation of alkaline compounds through autolytic activities and microbial metabolism has been reported in earlier studies [18-20]. Many microbes including Pseudomonas produce ammonia during amino acid metabolism.
TVBN, ammonia and other volatile basic nitrogen compounds, has been produced mainly by bacterial decomposition of fish flesh. In this study, TVBN levels increased to 30 mg% on day 15. The values exceeded the limit of acceptability of 25 mg% proposed by Alverson [21]. However, fish were acceptable based on sensory score and microbiological counts until day 12.0 mg% and 35 mg% of TVBN were established for different groups of fishes [22]. There is a good correlation between TVBN and microbiological parameters in the present study as reported earlier by Katikou et al. [23]. The results also suggest that since TVBN values exceeded the limit of acceptability on day 14 when fish had a stale order, it may be useful as a measure of the degree of freshness; although some reports differ in this context while evaluating the spoilage potential [24].
Changes in functional properties
Effect of concentration of salt on the protein solubility: The solubility profile as a function of NaCl concentration indicated a maximum solubility of 77.17% ± 0.14% at 1M NaCl concentration (Tables 5 and 6). Generally, solubility increases at a low salt concentration (salting in). Salting is the condition where the solubility of the protein increased by a smaller quantity of neutral salt added to the protein solution. In that situation, the protein is greater concentration maximizes it’s bounding with water molecules in term of ionic, hydrogen or Van der Walls bounding. In salting out, the concentration of salt is higher and it that way, the salt will gather water molecules from proteins for its solubility, leading to a lack of water for proteins which will favor hydrophobic interactions between them, leading to protein-protein interaction, giving rise to complexes which precipitate. The solubility of proteins depends on the nature of proteins, the ratio of meat and, the pH of the buffer used during the extraction. This result is similar to those obtained from other fish and shellfish [9].
| Storage Days | TVBN (mg %) | AMB (log10 cfu/g) | pH |
|---|---|---|---|
| 0 | 16.40 ± 0.08a | 3.61 ± 0.19a | 6.75 ± 0.02a |
| 3 | 17.55 ± 0.12b | 3.30 ± 0.14a | 6.82 ± 0.01b |
| 6 | 20.45 ± 0.22c | 3.87 ± 0.24b | 6.83 ± 0.02b |
| 9 | 21.64 ± 0.04d | 4.98 ± 0.07c | 6.91 ± 0.03c |
| 12 | 25.22 ± 0.08e | 5.89 ± 0.09d | 6.95 ± 0.02c |
| 15 | 30.11 ± 0.10f | 6.97 ± 0.19e | 7.04 ± 0.01d |
Table 5: Effect of ice storage on pH, TVBN and AMB.
| Concentration of NaCl (N) | % Solubility |
|---|---|
| 0 | 34.54 ± 0.75a |
| 0.25 | 51.42 ± 1.02b |
| 0.5 | 61.65 ± 0.45c |
| 1 | 77.17 ± 0.14d |
| 1.5 | 47.77 ± 0.89e |
| 2 | 42.95 ± 0.09f |
Table 6: Effect of different concentration of salt on the solubility of protein using Lawry method.
Effect of ice storage on sensory attributes of raw fish: Changes in sensory characteristics of C. carpio during ice storage have been evaluated by the sensorial analysis and the results have been presented in Table 7. Base on skin, eyes, gills, flesh color and outer slime, C. carpio were in excellent condition up to six days in chilled conditions and the good quality has been retained for nine days. The fish samples were spoiled on the 15 day. The overall acceptability scores remained in the range of seven points up to nine days indicating that there was no significant loss of sensory attributes.
| Skin | Bright, shining; Firm | Bright shining; Firm | Bright shining; Firm | Waxy; Slight loss of shine; Soft | Waxy; Slight loss of shine; Soft | Dull; Some bleaching |
|---|---|---|---|---|---|---|
| Eyes | Translucent cornea; Convex; Absence mucus | Translucent cornea; Convex; Absence mucus | Translucent cornea; Convex; Absence mucus | Opalescent cornea; Plane ; Moderate mucus | Opalescent cornea; Plane; Moderate mucus | Opalescent cornea; Sunken; Excessive mucus |
| Gills | Fresh odor; red color | Fresh odor; red color | Fresh odor; red color | Fresh odor; red color | Stale odor; dark red color | Spoiled odor; dark red color |
| Flesh color | Pinkish white | Pinkish white | Pinkish white | Moderate pinkish white | Whitish | Whitish with slight yellow stain |
| Outer slime | Thin; Transparent | Thin; Transparent | Thin; Transparent | Aqueous; Transparent | Opaque; Thick; Slight milky | Thick; Milky |
| EC Grade | E | E | E | A | B | C |
Table 7: Effect of ice storage on the sensorial analysis of C. carpio .
The effect of ice storage on sensorial quality of cooked C. carpio has been presented in Figure 1. We found that the chilled fish quality is decreasing. The quality deterioration has been correlated with reduced tastefulness of the boiled fish. The reduction in tastefulness may be caused nucleotide decomposition [25,26]. Based on the sensory scores, C. carpio in our study case had a shelf life of 12 days in ice.
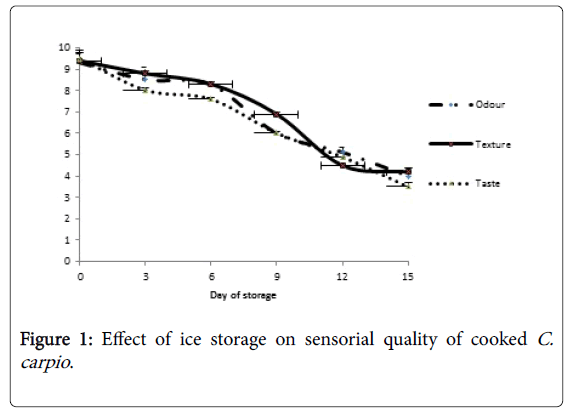
Figure 1: Effect of ice storage on sensorial quality of cooked C.carpio .
Effect of ice storage on Ca2+ ATPase enzyme activity: The Ca2+ ATPase enzyme activity is used to evaluate the state of degradation of myofibrillar proteins. The solubilization of myofibrillar proteins is the essential factor affecting the properties of fish protein during ice and frozen storage [27,28]. Figure 2 presents the effect of ice storage on Ca2+ ATPase enzyme activity. The initial Ca2+ ATPase enzyme activity of 0.63, decrease during the ice storage. Changes in solubility of total protein were due to alterations in conformational status. As revealed by Kamal et al. [29] the changes in the solubility profile of myofibrillar proteins lead to the decrease in enzyme activity. In the present study, the enzyme activity decreased significantly after 15 days of ice storage. Factors that can cause the denaturation of myofibrillar proteins can thus, affect ATPase enzyme activity [1]. The action of proteolytic enzymes in the muscle can also reduce the enzyme activity [30]. A significant decrease in solubility is then the key factors contributing to a reduction in Ca2+ ATPase enzyme activity.
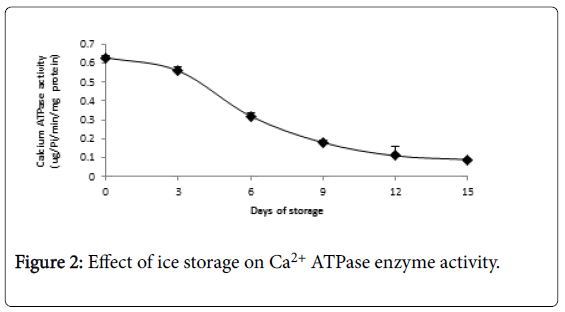
Figure 2: Effect of ice storage on Ca2+ ATPase enzyme activity.
Rheological changes during storage
Gel strength and TPA: The result of gel strength and TPA are presented in Tables 8 and 9 respectively. There was a significant reduction in gel strength after 15 days of ice storage. The decrease in gel strength values of the gels prepared was rapid at the end of 5-days of ice storage. The initial gel strength values of the gels were 668,28 ± 58,18 when prepared using 2.5% NaCl. In fact, the process of gelation is cross-linking the polypeptide chain to form a well-defined tridimensional network with entrapment of water in the muscle [31].
| Days of Ice storage | Gel strength | |
|---|---|---|
| Day | 0 | 668,28 ± 58,18a |
| 5 | 477,40 ± 49,38b | |
| 10 | 442,81 ± 21,56b | |
| 15 | 318,70 ± 13,56c | |
Table 8: Effect of ice storage on gel strength.
| Days | Hardness | Fracturability | Adhesiveness | Springiness | Cohesiveness | Gumminess | Chewiness | Resilience | |
|---|---|---|---|---|---|---|---|---|---|
| With salt | 0 | 1368,15 ± 0,09a | 1707,43 ± 1.70a | -75,79 ± -1.13a | 0,86 ± 0.11a | 0,685 ± 0.10a | 927,75 ± 0.06a | 786,02 ± 1.73a | 0,321 ± 0.02a |
| 5 | 4153,43 ± 1,75b | - | -88,90 ± -0.91b | 0,89 ± 0.75a | 0,700 ± 0.03a | 947,75 ± 0.90a | 826,02 ± 0.4a | 0,31 ± 0.03a | |
| 10 | 2583,21 ± 0,92c | - | -11,20 ± -0.78c | 0,93 ± 0.15a | 0,740 ± 0.05a | 3090,45 ± 0.75b | 2768,94 ± 0.9b | 0,39 ± 0.03b | |
| 15 | 904,85 ± 1,73d | -3,544 ± 0.12b | -61,94 ± -1.34d | 0,87 ± 0.03a | 0,790 ± 0.01a | 701,83 ± 0.08c | 641,37 ± 1.70c | 0,42 ± 0.01b | |
Table 9: Effect of ice storage on TPA.
The strength of the gel depends on the extent of cross-links that occur in the polypeptide chain. Proteins from fish differ in their ability to cross-link to form a network and found to be highly species specific. The present study has revealed that C. carpio had the higher gelforming ability in the fresh condition but in the ice stored, its ability decreased significantly. The reduction in gel-forming ability could be attributed to a loss of protein solubility, and Ca2+ activated ATPase enzyme activity.
Effect of ice storage on dynamic visco-elastic behavior: The viscoelastic nature of the gel obtained from C. carpio meat has been assessed by frequency sweep at 25°C. The results have been given in Figures 3-6. The regression slope of G’ and G’’ as a function of frequency has been taken as an index of viscoelastic nature of the material. The increase of storage modulus G’ coupled with low phase angle with the increase of frequency indicates the weak gel network [32]. The frequency sweep shows that viscoelastic nature of the common carp could be modified significantly (P<0.05) after ice storage.
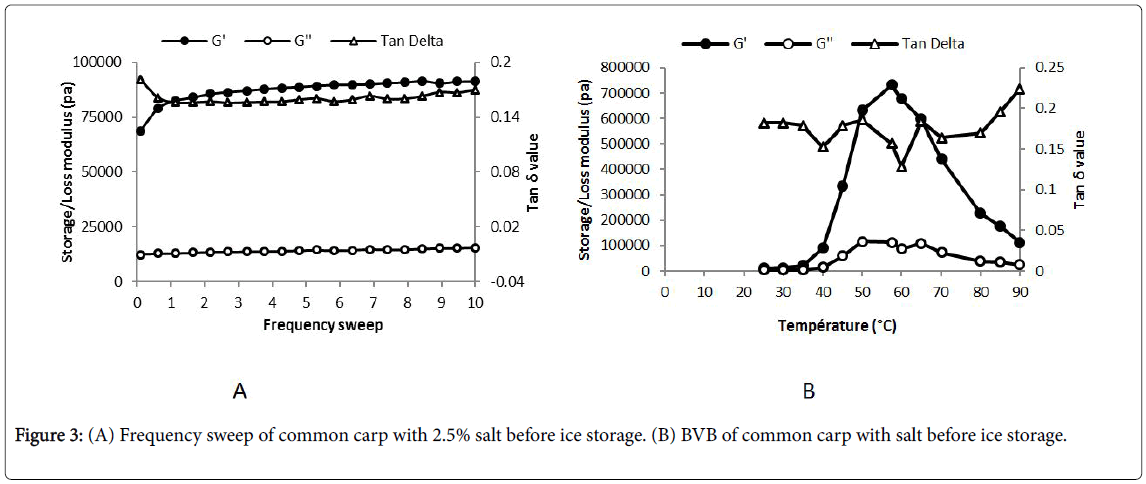
Figure 3: (A) Frequency sweep of common carp with 2.5% salt before ice storage. (B) BVB of common carp with salt before ice storage.
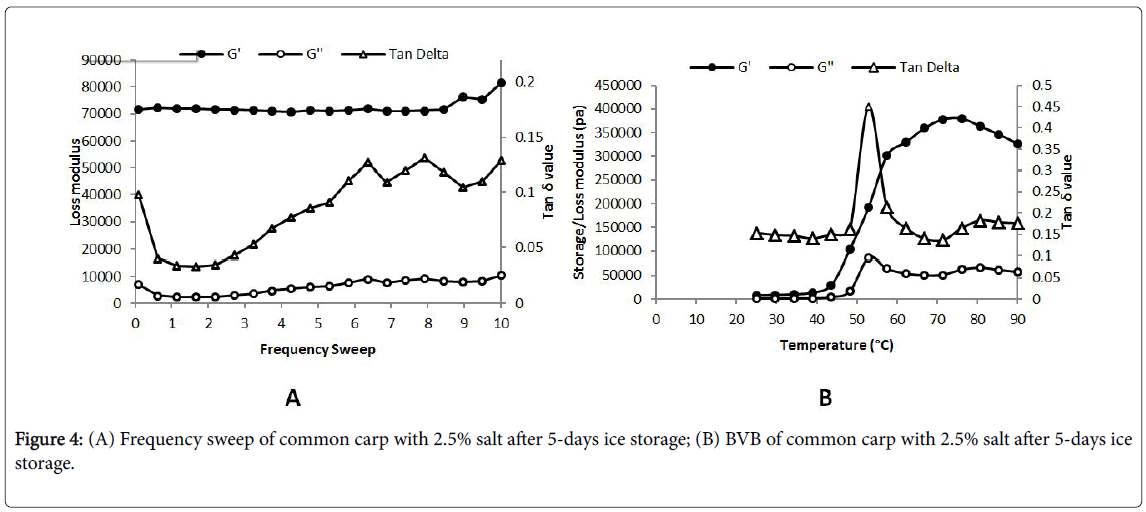
Figure 4: (A) Frequency sweep of common carp with 2.5% salt after 5-days ice storage; (B) BVB of common carp with 2.5% salt after 5-days ice storage.
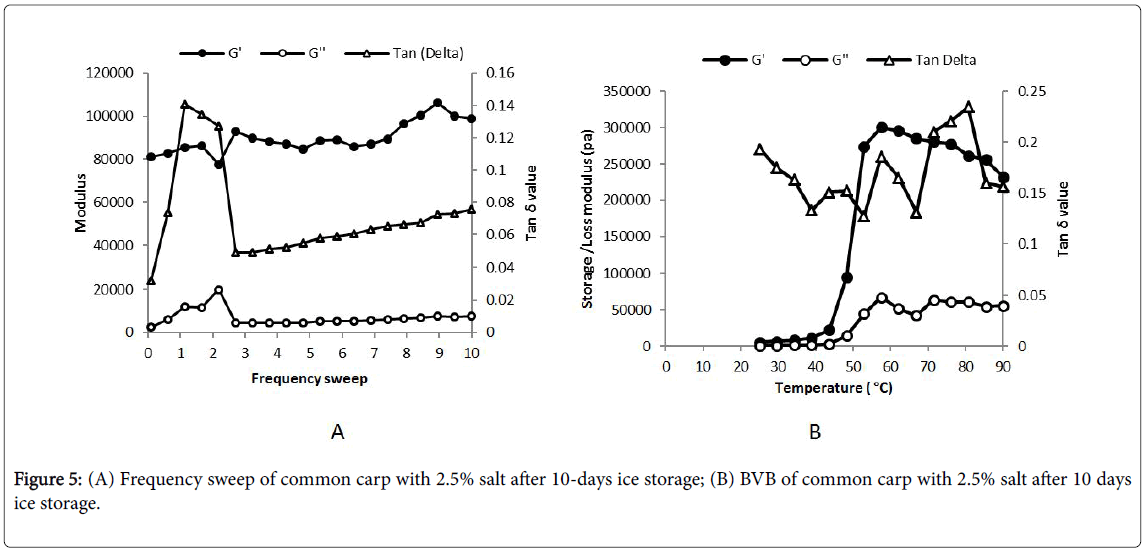
Figure 5: (A) Frequency sweep of common carp with 2.5% salt after 10-days ice storage; (B) BVB of common carp with 2.5% salt after 10 days ice storage.
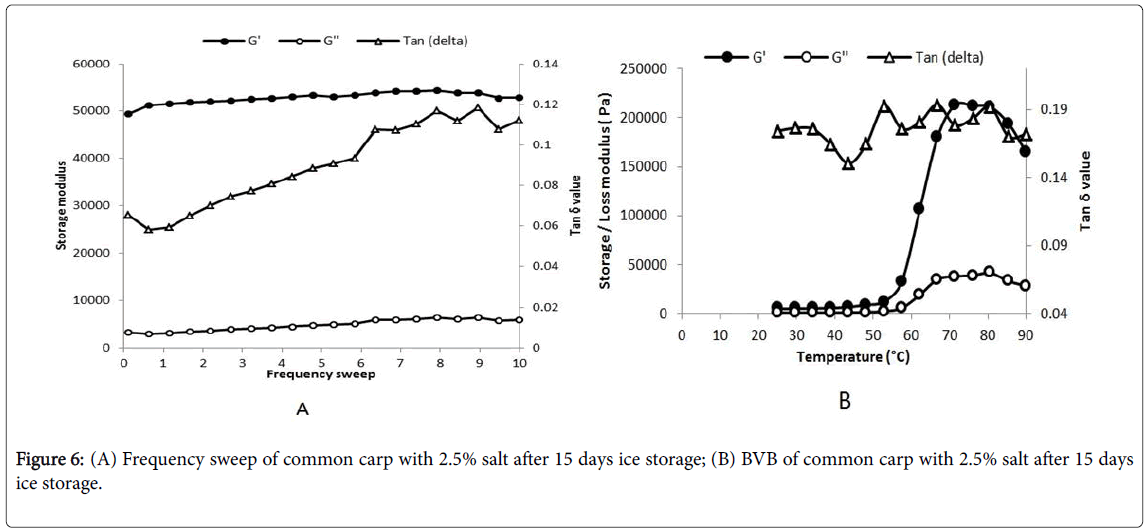
Figure 6: (A) Frequency sweep of common carp with 2.5% salt after 15 days ice storage; (B) BVB of common carp with 2.5% salt after 15 days ice storage.
Changes in storage modulus (G’) have been used to monitor gelation of proteins including structural proteins [33] because G’ is a measure of the energy recovered per cycle of sinusoidal shear deformation, its increase indicates rigidity of the sample associated with the formation of elastic gel structure. The loss modulus is a measure of the energy dissipated or lost as heat per cycle of sinusoidal strain when different systems have been compared at the same strain amplitude. The loss factor (G’’) indicates an extent of the viscous element in the sample. In the present study, the G’’ values were less compared with G’ values, indicating the viscoelastic nature of the gel. The gelation process is then being monitored by measuring changes in stress-strain phase angle during the oscillatory test and indicates the temperature at which transition from sol-gel took place. The tan values have been obtained by taking a ratio of G’’/G’ during isothermal heating.
The DVB profile of C. carpio meat macerated with 2.5% NaCl has revealed a considerable increase of gel-forming ability at the beginning of the experiment. The maximum G’ value was 730 kPa recorded at 57.5°C. The 1st transition in the thermogram of C. carpio is well correlated with the transition from DVB measurement as per the tan values. The transition was irreversible. Hence, according to Supreetha et al. [34], it is evident that the transitions at temperatures above 70°C in the DVB measurements are due to the combined effect of denaturation of different myofibrillar protein fraction as well as the gelatinization of fish. The regression slope of G’ and G’’ as a function of frequency has been taken as an index of viscoelastic nature of the material. In the case of this study, the maximum G’ is decreasing with ice storage as presented in Table 10.
| Days of Ice storage | DVB 40 mm | ||
|---|---|---|---|
| G’ Maxima | Temperature (°C) | ||
| Day | 0 | 730 Kpaa | 57,5 |
| 5 | 379.7 Kpab | 76.1 | |
| 10 | 300.2 Kpac | 57.5 | |
| 15 | 212.9 Kpad | 71,4 | |
Table 10: Effect of ice storage on DVB G’ Maxima value.
The effect of ice storage during 15 days on the physicochemical and viscoelastic properties of C. carpio fish has been evaluated. This study has revealed a reduction in protein solubility and Ca2+ ATPase enzyme activity. The AMB, TVBN and pH results show the decrease of fish quality. This has been confirmed by the sensorial analysis. The DVB and TPA values decrease during 15 days of ice storage indicating an aggregation and denaturation process. The fish stored in ice remained in excellent condition for up to six days and retained high quality up to nine days. This study has revealed that the proliferation of microorganisms especially mesophilic counts in fresh fish tissues were close to the value recommends by the ICMSF. Based on the sensory analysis, on physicochemical parameters and on the microbiological analysis, we can conclude that C. carpio had a shelf life of 9 days to 12 days in ice ratio 1:1 (fish:ice).
All the authors i.e. C.T.T, H.M.W, F.T and B.B.N designed the study. C.T.T, N.H.S carried out the research work for various physicochemical analyses and microbiological parameter. Rheological parameters and gel strength were determined by C.T.T, C.M.V.R.A and P.K has determined the amino acid and the fatty acid composition. C.T.T drafted the manuscript. Statistical analysis was done by BBN. All authors read and approved the final manuscript.
The authors thank the Department of Science and Technology for the RTF-DCS/DST Fellowship received. The NAMS & T Centre for his financial support. The authors are thankful to the Directors of, Central Institute of Fisheries Education and the Central Institute of Fisheries Technology for allowing me to carry out part of this research in their Institutes.